
Another downwards day for Wednesday overall was expected. The main Elliott wave count remains the same and is still preferred over the alternate.
Summary: A pullback to about 1,230 may continue. The target may be reached now in another 4 days time.
New updates to this analysis are in bold.
Last weekly charts are here and the last video on weekly wave counts is here.
Grand SuperCycle analysis is here.
MAIN ELLIOTT WAVE COUNT
DAILY CHART
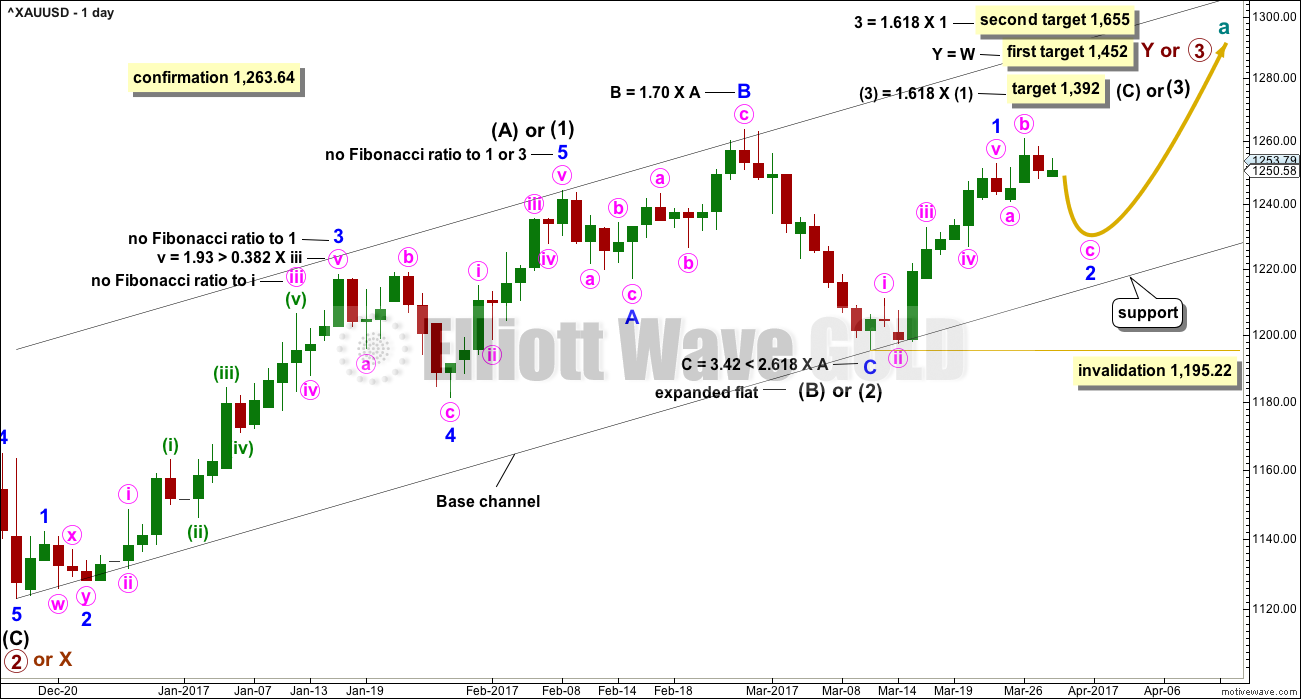
Click chart to enlarge.
This daily chart will suffice for both weekly charts.
Upwards movement is either a third wave (first weekly chart) to unfold as an impulse, or a Y wave (second weekly chart) to unfold as a zigzag. If upwards movement is a zigzag for primary wave Y, then it would be labelled intermediate waves (A) – (B) and now (C) to unfold.
Intermediate wave (1) or (A) is a complete five wave impulse lasting 39 days. Intermediate wave (2) or (B) looks like an expanded flat, which is a very common structure.
So far, within intermediate wave (3) or (C), the first wave up for minor wave 1 may be complete. Minor wave 2 may unfold lower. Minor wave 2 may not be a very deep correction because the strong upwards pull of a big third wave may force it to be more shallow than otherwise. However, if it is relatively deep, it may find support at the lower edge of the base channel and may offer another opportunity to join the upwards trend. At this stage, it looks like minor wave 2 is unfolding as yet another common expanded flat correction.
Minor wave 2 may not move beyond the start of minor wave 1 below 1,195.22.
HOURLY CHART
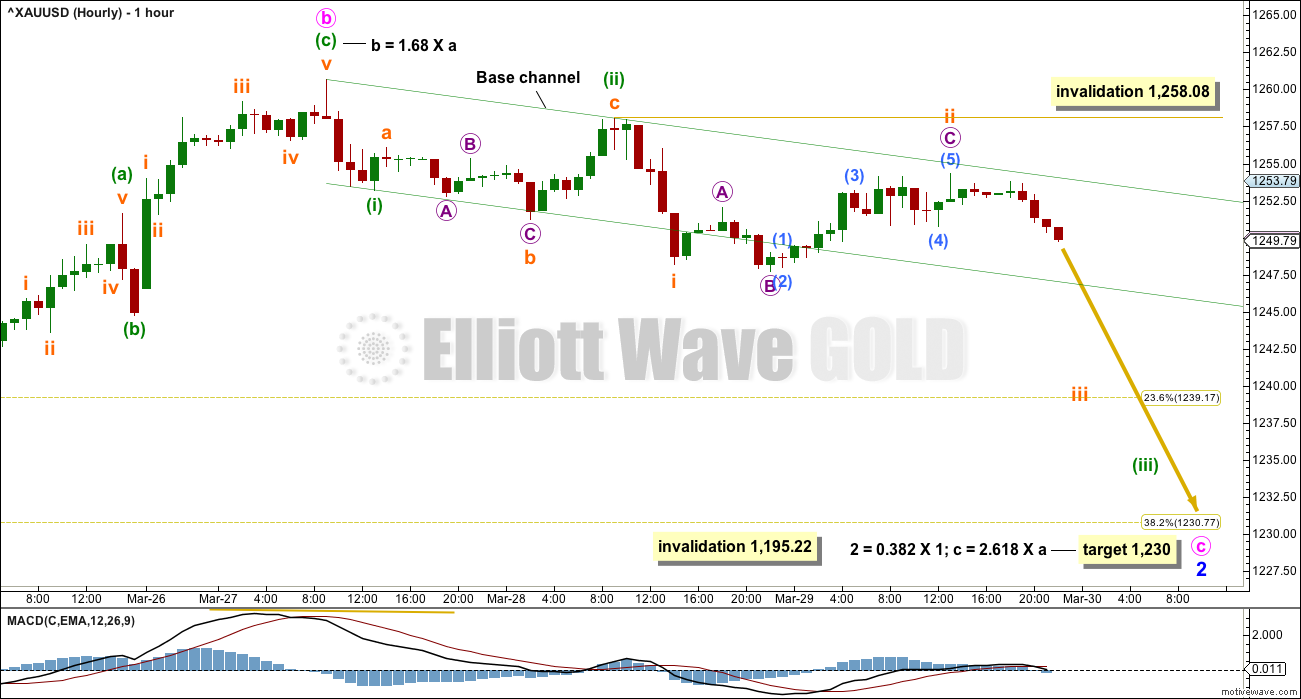
Click chart to enlarge.
Minor wave 2 may be any corrective structure except a triangle. At this stage, it looks like it may be unfolding as an expanded flat correction, which are very common structures. Within minor wave 2, minute wave b is now a little longer than the common length of minute wave a, but is less than twice the length of minute wave a.
The target for minute wave C is calculated at two degrees and both yield exactly the same price point. This has a reasonable probability.
Minute wave c must subdivide as a five wave structure, either an impulse or an ending diagonal. An impulse is more common so more likely. At this stage, that looks like what is unfolding.
Within minute wave c, the first and second waves may be complete. A base channel is drawn about minuette waves (i) and (ii). Along the way down, lower degree corrections should now find strong resistance at the upper edge of the base channel. At this stage, it looks like subminuette wave ii has found resistance as expected there during Wednesday’s session.
Minuette wave (iii) should have the power to break below support at the lower edge of the base channel. It should be able to do that the next time price comes down to the trend line, if this wave count is correct. Once it has done that, then the lower edge should offer resistance.
Minor wave 1 lasted 9 days, 1 longer than a Fibonacci 8. So far minor wave 2 has lasted 4 days. If it continues for 4 more, it may total a Fibonacci 8, and that would give the wave count good proportions and the right look.
ALTERNATE ELLIOTT WAVE COUNT
DAILY CHART
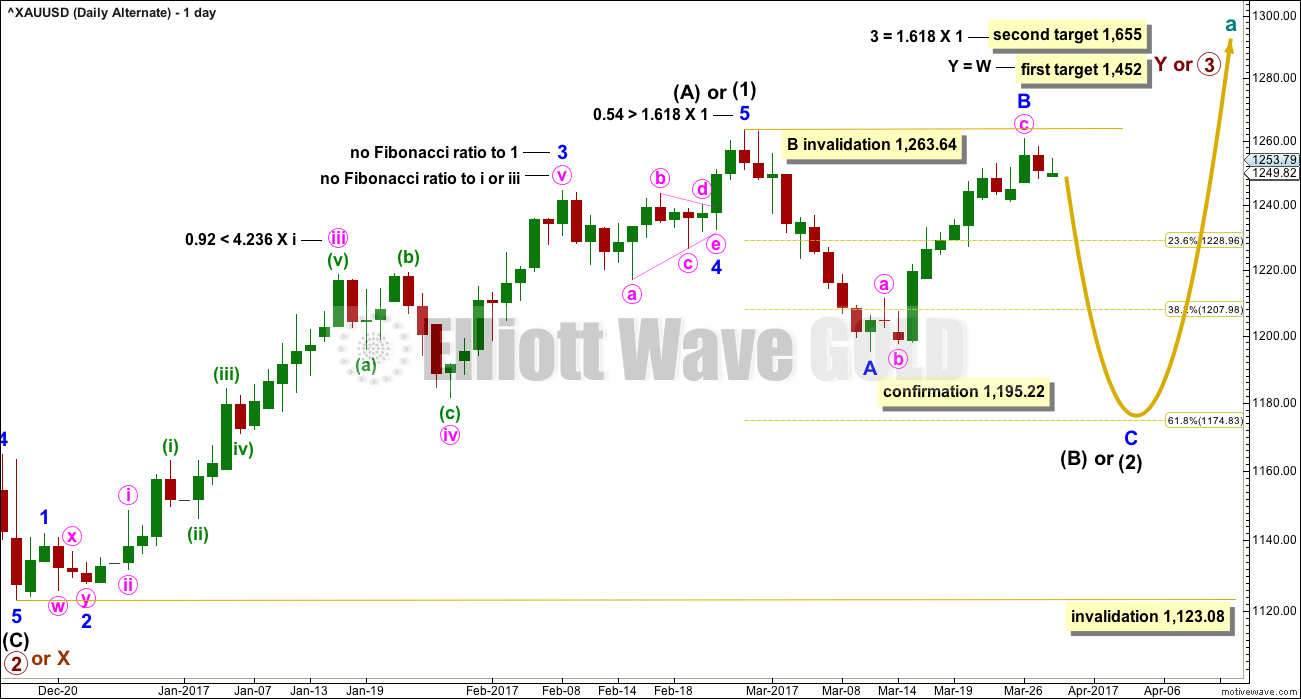
Click chart to enlarge.
This alternate wave count is in response to queries from members.
Fibonacci ratios are noted on both daily charts, so that members may compare the main and alternate wave counts. This alternate wave count has slightly better Fibonacci ratios. This gives this wave count a reasonable probability. Due mostly to volume, this wave count is judged to have a lower probability than the main wave count.
At this stage, this wave count would be considered confirmed if price makes a new low below 1,195.22. At that stage, the target for intermediate wave (2) or (B) to end would be the 0.618 Fibonacci ratio of intermediate wave (1) or (A) at 1,175.
At the hourly chart level, this wave count would see minute wave c of minor wave B as a five wave structure. This would now have a reasonably good fit.
TECHNICAL ANALYSIS
WEEKLY CHART
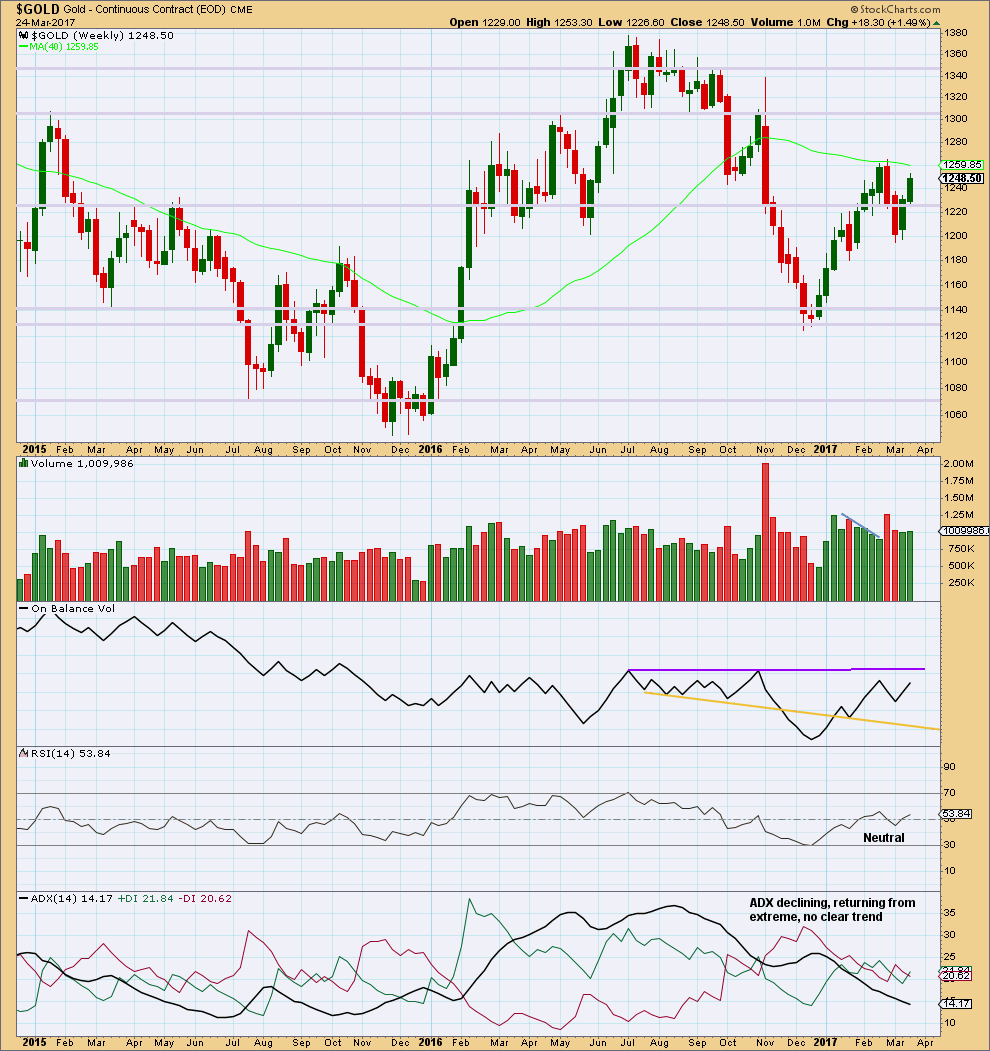
Click chart to enlarge. Chart courtesy of StockCharts.com.
Last week saw price move higher with a small increase in volume. Overall, the rise in price has some support from volume and this supports the main Elliott wave count, which saw it as the end of a first wave up.
On Balance Volume is not close to resistance, so it gives no signal.
ADX has now been pulled right down from extreme. There is now room again for a longer term trend to develop.
DAILY CHART
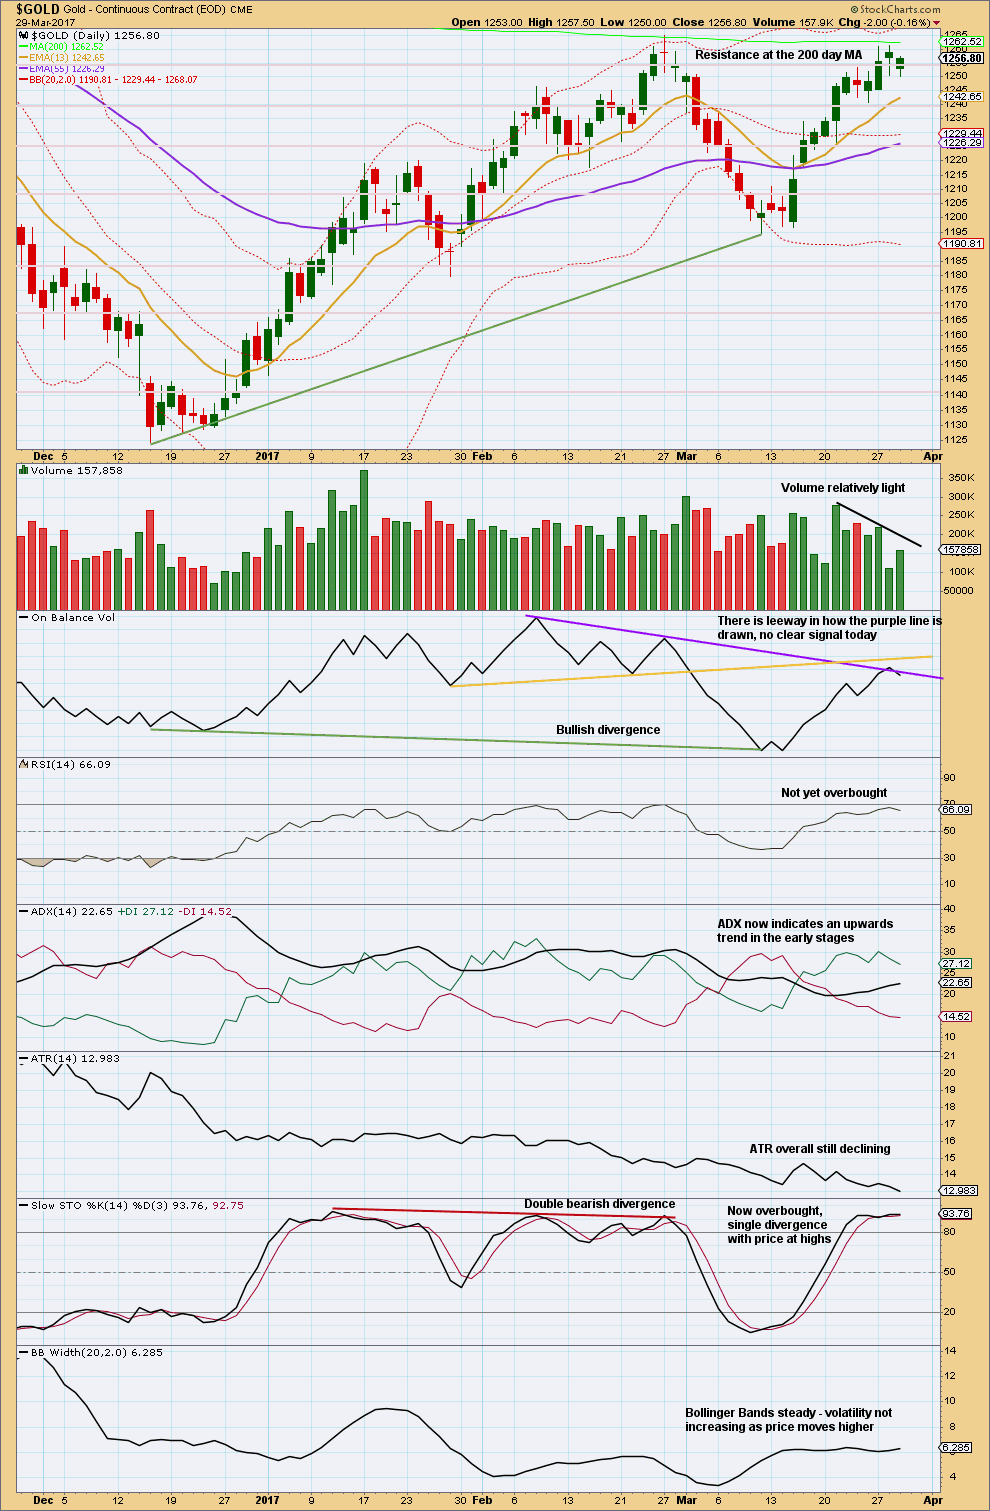
Click chart to enlarge. Chart courtesy of StockCharts.com.
The data for yesterday’s session has changed retrospectively by StockCharts after yesterday’s analysis was published at 8:47pm EST. This really does make accurate analysis impossible.
Yesterday’s candlestick now has a small real body, a long lower wick, and made a new high. Today’s candlestick shows downwards movement with a lower low and a lower high, although the candlestick closed green.
Yesterday, On Balance Volume for yesterday’s session for the 28th of March clearly showed On Balance Volume turned down from resistance at the purple line. Now the data for the 28th of March shows On Balance Volume moved upwards. This data has clearly changed.
There is a little leeway in exactly how the purple trend line for On Balance Volume is drawn. If it has a very slightly steeper slope. then it gives a bullish signal. If it is sloped as drawn, then it would be best considered neutral. It will be read as neutral and not bearish because for a signal this turn or breach needs to be much clearer.
Overall, volume continues to decline. This is slightly bearish. The downwards movement from price with a slight increase today is also bearish.
ADX remains bullish.
ATR is bearish. Bollinger Bands agree that the market is not trending, so this may be interpreted as bearish.
GDX
DAILY CHART
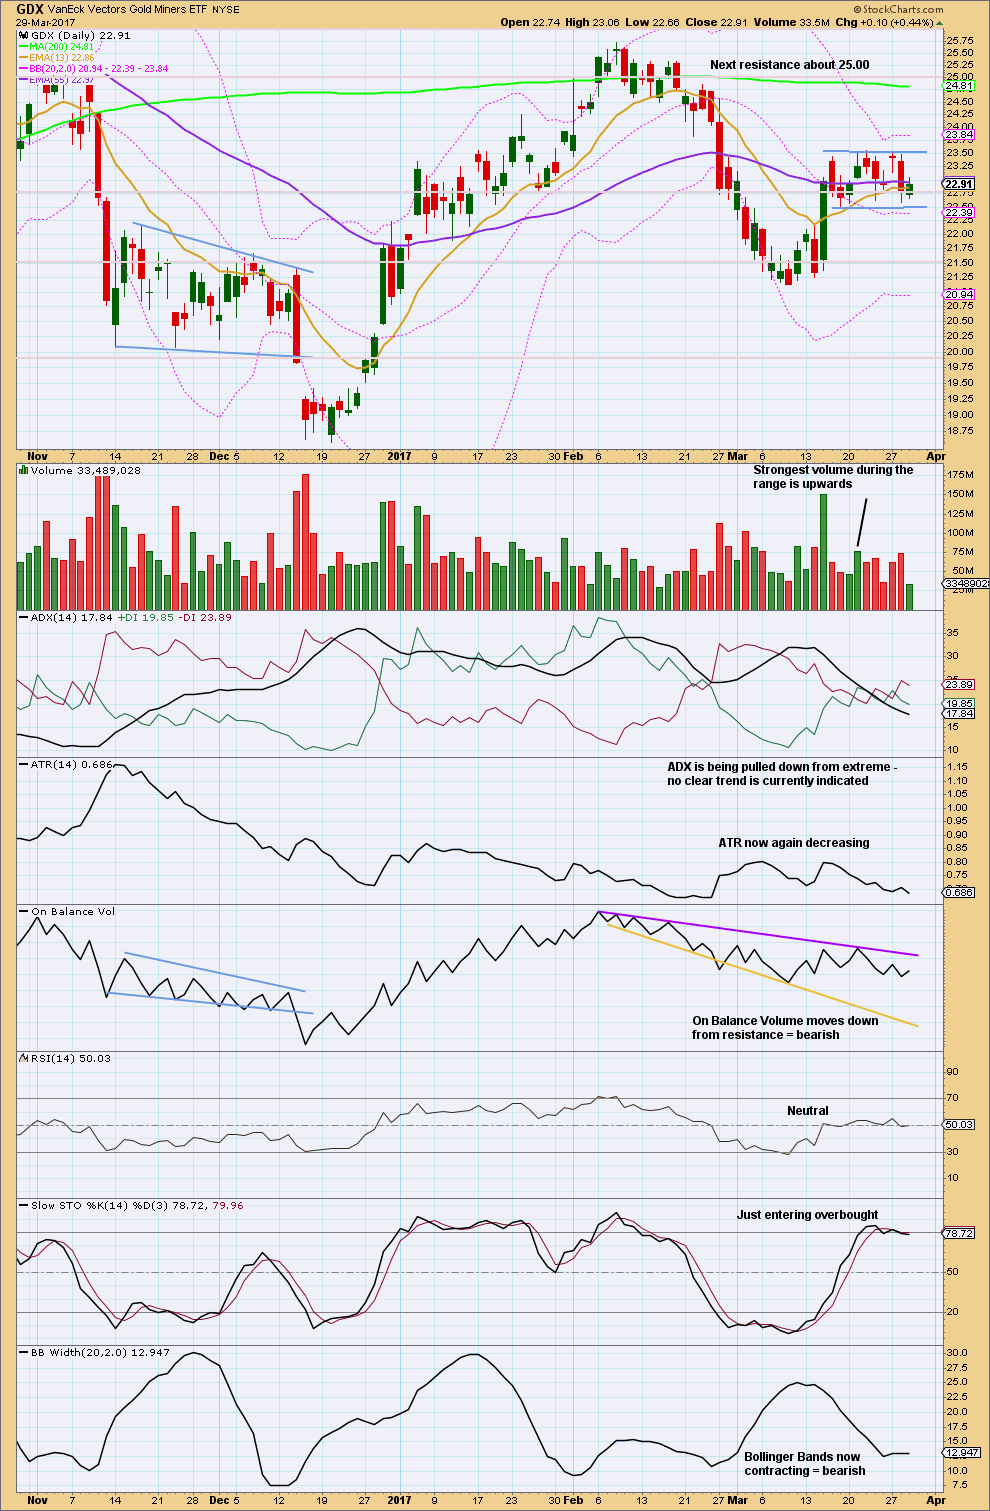
Click chart to enlarge. Chart courtesy of StockCharts.com.
The bottom line for GDX is that it remains range bound. Volume suggests an upwards breakout is still more likely than downwards, but not by much. While this technique works more often than it fails, it is not certain.
A small inside day does not change the analysis for GDX today.
This analysis is published @ 10:41 p.m. EST.
Hi Lara,
When you do your analysis tonight would you please label Micro iiic/Submin iii in detail (to Miniscule degree if poss.) so those interested can compare your count to their charts.
Thank you….
I can’t do that because those small subdivisions aren’t showing up on the hourly chart. At least, where I can see submicro 1 and 2 on the five minute chart doesn’t show up clearly on the hourly.
A note for anyone watching NGas:
Today it made an important new high for price. The invalidation point on my wave count was breached, this can’t be a fourth wave correction because it’s in first wave price territory.
What that basically means is that NGas is now looking relatively bullish, whereas my wave count previously saw it as very bearish.
I’ll be doing a Trading Room post after the close today with Copper for a set up to go short, and NGas to update the wave count and outline what set up we could look for to go long.
Any members who took my advice yesterday to have a punt on the short side should now have profits. Move stops to at least breakeven to eliminate risk.
I am concerned that price has still not broken below the base channel and MACD shows a lack of downwards momentum. This could be resolved with some strong downwards movement, but that has to happen really soon.
Minute wave c is extremely likely to make at least a slight new low below the end of minute wave a at 1,241.04 to avoid a truncation and a very rare running flat. So it’s not done yet. And the structure is incomplete.
Any short positions are very short term trades here, be nimble. But hold onto your hats still for a little bit folks… the ride’s not quite done.
Thanks for the update. I wished I had held onto my NUGT puts instead of rolling them into those SLV puts. SLV has been moving slower than molasses! I am quite loathe to remain short Silver as it is showing remarkable resiience.
Another very weird thing happening today has been how Silver and equities have been moving in tandem….wassup with that?
I think that is an excellent illustration of why we need to be careful to not assume a correlation between different markets.
Correlations aren’t always as robust as we think they are, and sometimes they don’t even actually exist when we think they do.
Indeed. On a more general note I am really surprised at how tepid the price action has been in the metals of late. I wonder where all the volatility typically seen in the precious metals price action gone…??!!
Is this what happens when the banksters are not out to play?!
The metals and miners are coiling inside the triangles. Big volitility is coming soon!
I got out of my SLV puts today as they were expiring tomorrow. Looking at
Lara’s updated chart I suspect I will miss the sweet-spot of the third wave down but I would rather preserve that capital for a long trade than risk loosing it with more meandering or worse tomorrow. We may get that spike down I have been antcipating for days now tonight. Where are those banksters when you really need ’em….? 😉
What’s going on with silver?
Wish I knew… 🙂
Maybe an expanded flat for minor 2?
Makes sense…
Its testing time…!!!…Mr Gold was never easy to handle..:)
Have a look on copper a sharp rise and a blowoff top pull back. Looking at the chart its giving a sense that this might be the end of wave C of wave 2. I think copper will now start its wave 3 downward.
Any comment?
Looks like a great set up.
Looking to buy some JJC puts 🙂
30/33 April call credit spreads for JJC at around 0.30 per spread look good to me…
I agree Roopa that this looks like the end of a wave C of a second wave. I don’t see a blowoff top here, but I do see a doji with a very long upper wick today.
I would expect Copper to print a red candlestick tomorrow as very likely after that long upper wick. And if my short term wave count is correct it should now move down strongly.
I think it’s time for another Trading Room post today. For Copper.
Thank you. I will love to see copper in trading room again.
:))
Price turned up exactly at the lower trend line drawn on Lara’s hourly chart above. Let’s see if it takes it out next time it retests…
Any thoughts on Oil? Is it about to turn?
I’ve been following that for weeks. I must say at this point I’m unsure. The COT commercial short position has decreased over the past 3 weeks. For me that has has been the most consistent foreshadowing tool aside from Lara’s analysis.
Yes, I am short oil today
I think little higher oil might go. Probably a $ or half. Im waiting for the slow STO to rise till over bought level then enter the trend. I found this working many times.
I’m watching it too. I’ll be paying close attention to volume these last three days, and Stochastics as Roopa says. Will post a chart when I think it’s got a good set up for us to go short.
But the COT data is concerning.
Curioser and curioser. I did a brief survey of my favorite Silver miners and they are all printing red today…
Silver in a very powerful uptrend with every dip being bought with conviction. I am starting to think we are not going to see a sub 18.00/oz price anytime in the near future. If we don”t get a decent mkve down the next 24 hrs I think short positions are going to bail, or really get burned…
imvho correction is not over, expecting low to be printed Tues/Weds
Allan,
Would you say we came down in Micro 1 at 9:16 AM and finished in Micro 2 of iii down?
ssandysc.
That is precisely my thinking. Now in micro 3 down.
Looking forward to a gap down tomorrow may be? for a P.O.R. a 3 of 3 of 3.
Unloading half my SLV puts I am not sure what’s going on but whatever it is looks very bullish!
News story breaking how Trump wants to impose a penalty for countries when they manipulate their currencies. This is what caused the bounce in both gold and silver; dollar quickly pared its gains. Silver is just short of moving higher than yesterday’s daily candlestick. This could be a quick overreaction to the Trump news and tomorrow’s economic calendar is payrolls which should generate some additional movement.
I am trying to get out of my remaining SLV 17.5 puts expiring tomorrow with a small profit. I am really stunned at Silver’s absolute refusal to decline. I guess as soon as I sell those puts we will see 100,000.00 futures contracts dumped into the market overnight! lol!
Filled on my remaining puts. Now I am all conflicted. Should I reload hedges or just SOH for the move down??!! Would somebody please make up my mind? 🙂
It’s bounced off the .236 level. Could this correction be over?
Yep! Gold has moved down but Silver is lagging the downside move. At least SLV has also moved lower in concert with Gold…
Here’s the catalyst that triggered the selloff in gold this morning…. GDP numbers released.
http://www.cnbc.com/2017/03/30/us-final-q4-gdp.html
That number seems to me completely bogus but what else is new? They can always revise…
There goes Silver. Funny how it sometimes leads, and at other times lags…
Trying to get June 5.0 strike JNUG calls for under a buck with a stink bid.
I think this wave is going to be shorter than anticipated. I think we have just had wave 4 and are now in 5 down.
Verne, I agree – all seems very odd!
I have learned that whenever price keeps refusing to do what I expect it to do, it is time to start considering whether my expectations could be incorrect. If we do not see a substantial move down today I will be lightening up my downside hedges in the form of SLV 17.50 puts. Fortunately they are still trading to close to what I paid for them but If I am wrong about a move down that could change in a big hurry. Silver in particular has been remarkably resistant to declines of late; it seems to have a permanent bid! 🙂
It is still a bit of a head-scratcher for me that we are observing so little overnight move in a third wave to the downside and it’s making me very curious. The tactics of the B-boys seem to have changed and I cannot help but wonder what they are up to. Listless trading, lacking momentum seems everywhere…
Looking like time buying to me. Combination corrections to push time out.
Hi Lara,
been looking at your USD Index chart again and think you are right that it is finishing wave 4, even though very large compared to wave 2, and think we are in a finale 5th up after which the US Dollar will go down for quite some time.
GDXJ moved up today and overlapped into Subminuette wave 1 price territory. The most likely scenario now is that Minuette wave c is an ending expanding diagonal.
We now have a minimum target of 34.66 so that Subminuette wave 5 exceeds the length of Subminuette wave 3. That’s pretty close to the bottom trend line of the corrective channel.
Expecting a strong move down tomorrow.
https://www.tradingview.com/x/m5vUI32G/
GDX moved up and sideways today as Minuette wave 4 continued. I expect a strong down day tomorrow. The correction may end in 1-3 days.
https://www.tradingview.com/x/GaNSV5jA/
Nice work Dreamer.
That wave count looks good, and yes, I too would be expecting a final fifth down to make it look textbook perfect.