
Downwards movement continued for Thursday as expected. Price is now below the lower edge of the base channel on the hourly chart.
Summary: A pullback to about 1,230 may continue. The target may be reached now in another 3 days time. Volume and On Balance Volume today offer good support to this view.
New updates to this analysis are in bold.
Last weekly charts are here and the last video on weekly wave counts is here.
Grand SuperCycle analysis is here.
MAIN ELLIOTT WAVE COUNT
DAILY CHART
Click chart to enlarge.
This daily chart will suffice for both weekly charts.
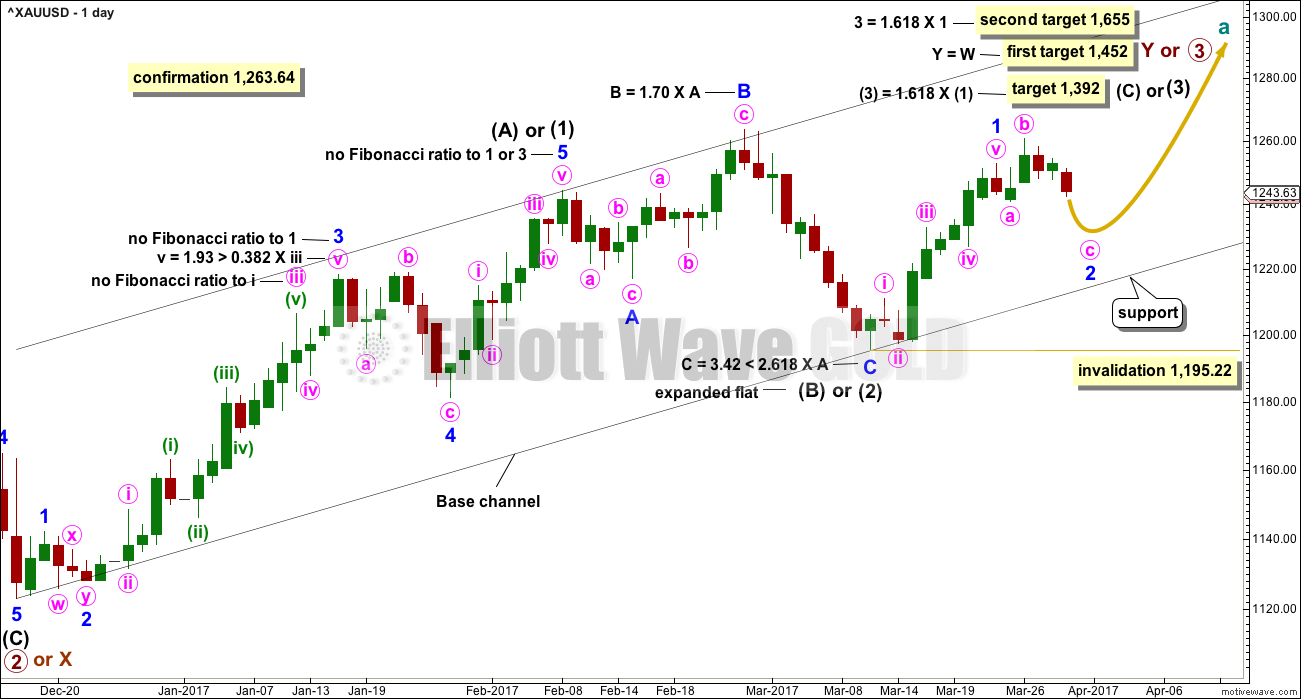
Upwards movement at primary degree is either a third wave (first weekly chart) to unfold as an impulse, or a Y wave (second weekly chart) to unfold as a zigzag. If upwards movement is a zigzag for primary wave Y, then it would be labelled intermediate waves (A) – (B) and now (C) to unfold.
Intermediate wave (1) or (A) is a complete five wave impulse lasting 39 days. Intermediate wave (2) or (B) looks like an expanded flat, which is a very common structure.
So far, within intermediate wave (3) or (C), the first wave up for minor wave 1 looks complete. Minor wave 2 may unfold lower. Minor wave 2 may not be a very deep correction because the strong upwards pull of a big third wave may force it to be more shallow than otherwise. However, if it is relatively deep, it may find support at the lower edge of the base channel. It should offer another opportunity to join the upwards trend. At this stage, it looks like minor wave 2 is unfolding as yet another common expanded flat correction.
Minor wave 2 may not move beyond the start of minor wave 1 below 1,195.22.
HOURLY CHART
Click chart to enlarge.
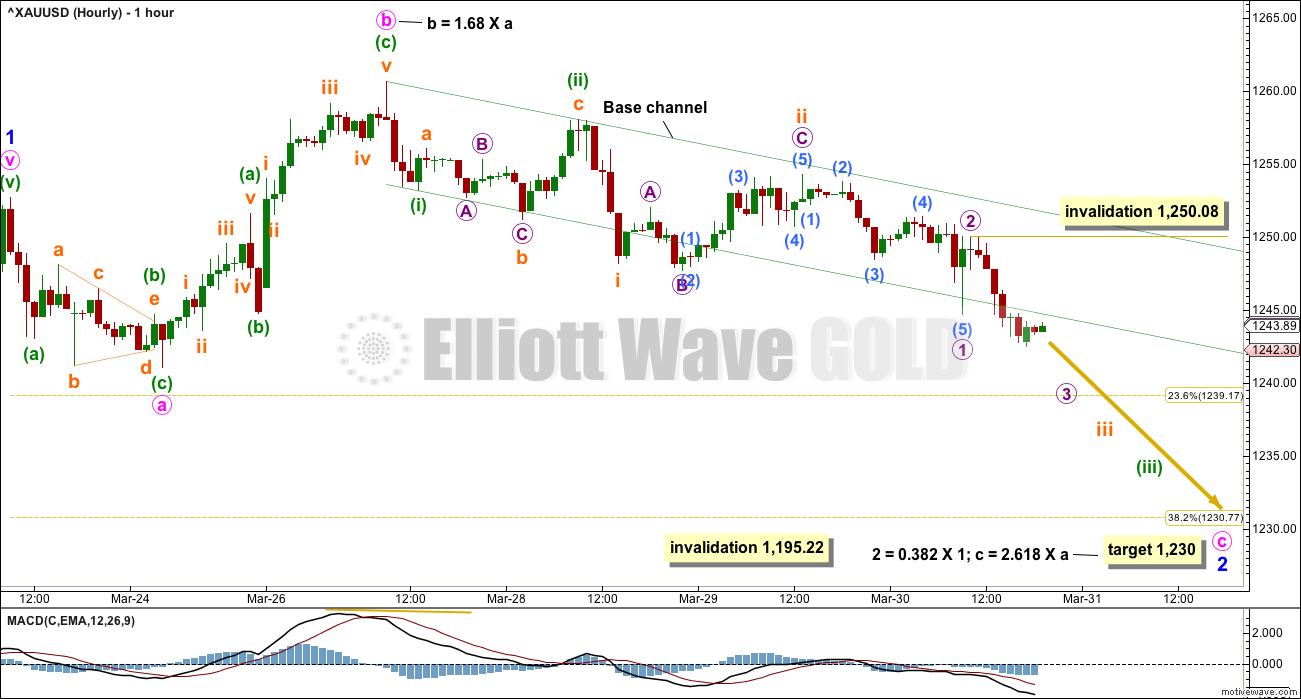
Minor wave 2 may be any corrective structure except a triangle. At this stage, it looks like it may be unfolding as an expanded flat correction, which are very common structures. Within minor wave 2, minute wave b is now a little longer than the common length of minute wave a, but is less than twice the length of minute wave a.
The target for minute wave C is calculated at two degrees and both yield exactly the same price point. This has a reasonable probability.
Minute wave c must subdivide as a five wave structure, either an impulse or an ending diagonal. An impulse is more common so more likely. At this stage, that looks like what is unfolding.
A base channel is drawn about minuette waves (i) and (ii). Minuette wave (iii) should have the power to break below support at the lower edge of the base channel. Now that the channel is breached the lower edge should offer resistance.
Within the impulse of minute wave c, there may now be three overlapping first and second waves. MACD now indicates downwards momentum is increasing, and it looks likely to increase further.
Gold often exhibits swift strong fifth waves within its impulses, particularly its third wave impulses. Look out for a strong end to one or more of subminuette wave iii or minuette wave (iii).
Minor wave 1 lasted 9 days, 1 longer than a Fibonacci 8. So far minor wave 2 has lasted 5 days. If it continues for 3 more, it may total a Fibonacci 8, and that would give the wave count good proportions and the right look.
ALTERNATE ELLIOTT WAVE COUNT
DAILY CHART
Click chart to enlarge.
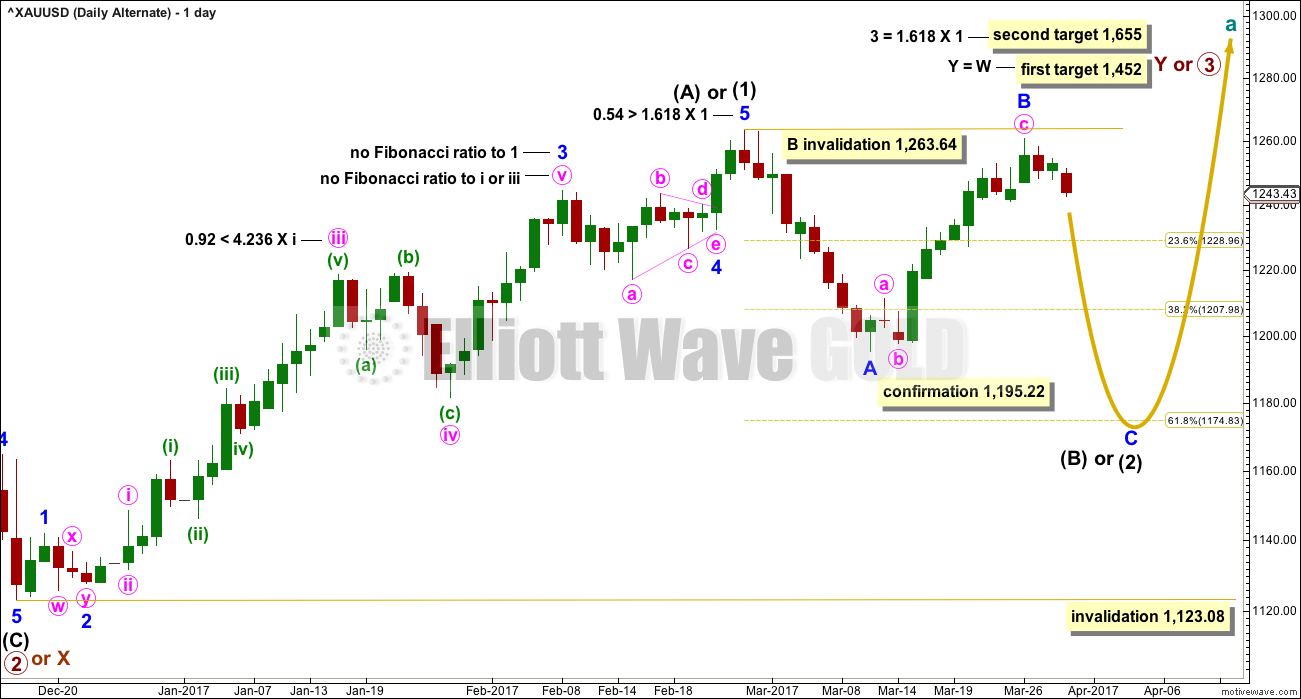
This alternate wave count is in response to queries from members.
Fibonacci ratios are noted on both daily charts, so that members may compare the main and alternate wave counts. This alternate wave count has slightly better Fibonacci ratios. This gives this wave count a reasonable probability. Due mostly to volume, this wave count is judged to have a lower probability than the main wave count.
At this stage, this wave count would be considered confirmed if price makes a new low below 1,195.22. At that stage, the target for intermediate wave (2) or (B) to end would be the 0.618 Fibonacci ratio of intermediate wave (1) or (A) at 1,175.
At the hourly chart level, this wave count would see minute wave c of minor wave B as a five wave structure. This would now have a reasonably good fit.
TECHNICAL ANALYSIS
WEEKLY CHART
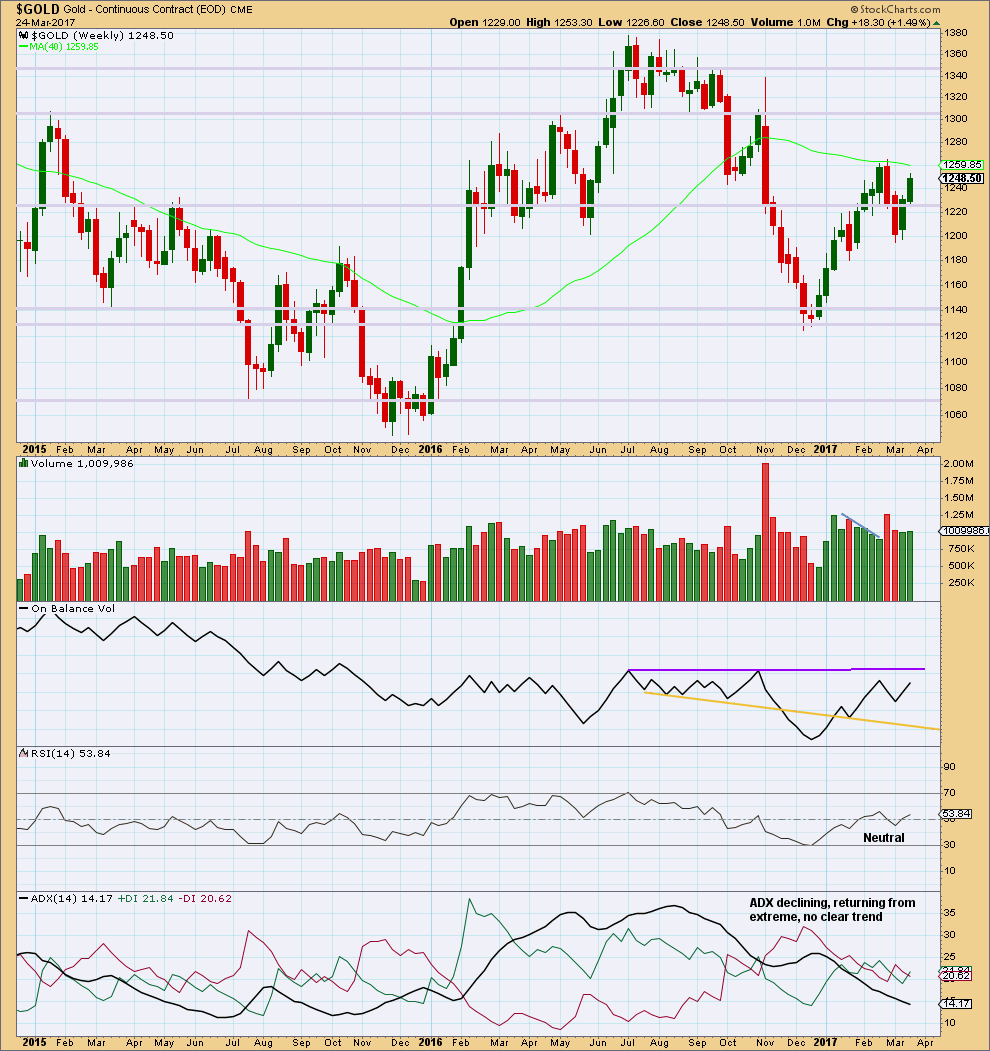
Click chart to enlarge. Chart courtesy of StockCharts.com.
Last week saw price move higher with a small increase in volume. Overall, the rise in price has some support from volume and this supports the main Elliott wave count, which saw it as the end of a first wave up.
On Balance Volume is not close to resistance, so it gives no signal.
ADX has now been pulled right down from extreme. There is now room again for a longer term trend to develop.
DAILY CHART
Click chart to enlarge. Chart courtesy of StockCharts.com.
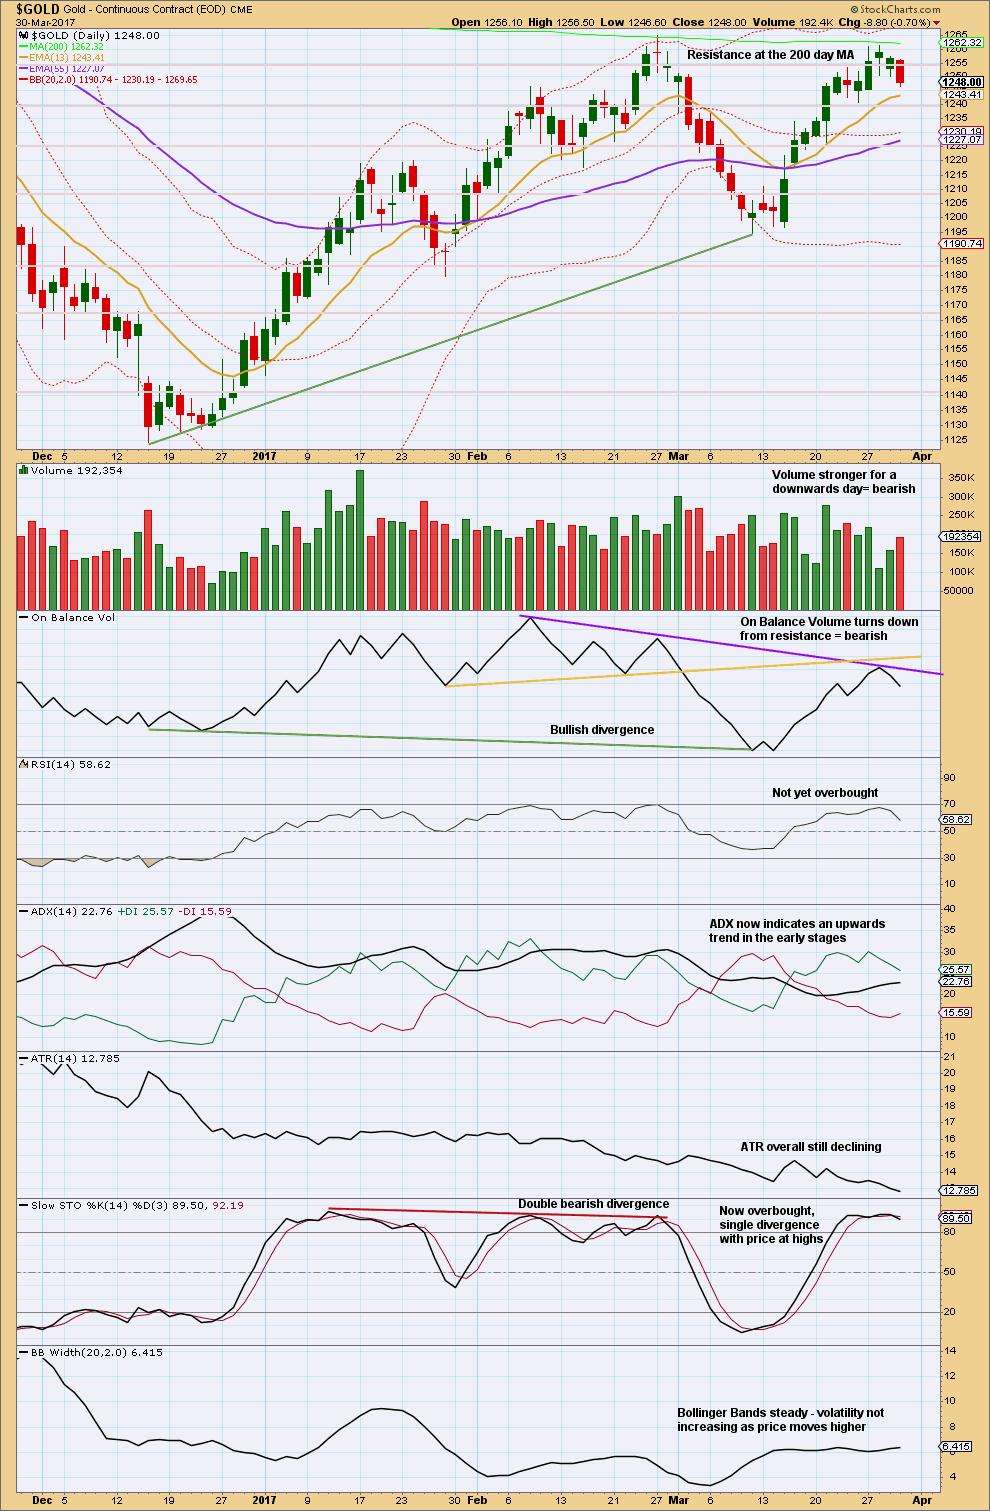
On Balance Volume is giving a clear bearish signal today. This indicator usually works well with trend lines, and this strongly supports the main Elliott wave count.
Volume today also supports downwards movement, so it is bearish, and this also offers good support to the Elliott wave count.
ADX is a lagging indicator (it is based upon a 14 day average). It does not yet show any trend change from up to down.
It is very reasonable to expect a pullback to continue lower at this stage, so that Stochastics is pulled down from overbought.
GDX
DAILY CHART
Click chart to enlarge. Chart courtesy of StockCharts.com.
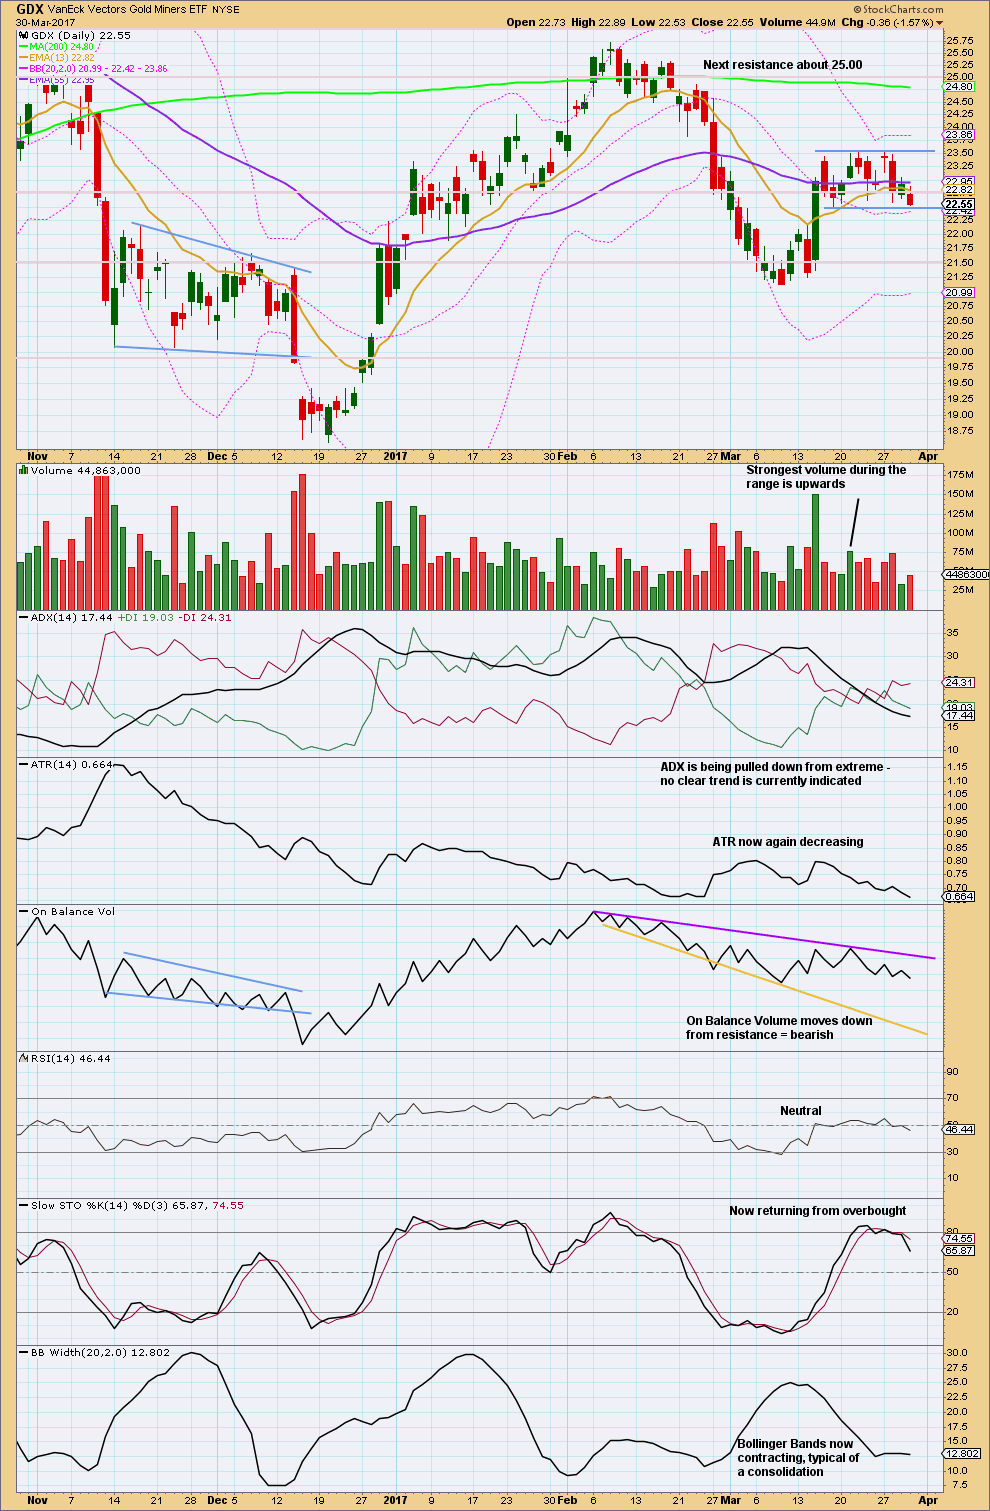
The bottom line for GDX is that it remains range bound. Volume suggests an upwards breakout is still more likely than downwards, but not by much. While this technique works more often than it fails, it is not certain.
Price is at support today, but Stochastics is only just returning from overbought. A range bound approach to this consolidation may need to be used on a lower time frame. The wisest course of action for GDX at this time may be to wait patiently for a breakout and then join the new trend.
This analysis is published @ 07:57 p.m. EST.
Requires a nimble trade imo; expecting an upside move for topping for the week with a pullback on the cards for Monday…. Lets see how this plays out.
So you don’t think the third wave up is underway?
Hi Verne: Am just a novice and no good at trying to figure out a wave count. Would rather let the experts do that and learn something new every day the way Lara explains it. Momentum and ROC seem to indicate an upside move in the making with Gold price encountering resistance in 1250s; overbought stochastic (StochRSI on the daily & weekly and Parabolic SAR) appear to indicate that a top cant be far off. Nonetheless am bullish Gold (there were some moving average bullish crossovers recently) and will look to add on longs on the dip/s. So far holding long from 1232 from previous week with a stop at 1238 having lightened some longs in 1250s and added a few in 1240s as price dropped this week. May end up playing both sides (long & short) depends on how price progresses. GL to all for the coming week; very tricky trade lol….
I am starting to revise my “smack down” theory on the Silver price. Taking a look at the chart the last six months or so, could it possibly that the banksters have already shot their wad, so to speak, even though the crowd may not be fully aware of this. Two things stand out. There are four periods of clearly serious short selling of the metal since last September- September 21- Otctober 6; November 9-23; December 14-23; and most recently from March 1-14. The intensity of the first two draw downs in the price was much greater than the last two instances, and the buying at the end of each has been persistent even if not intense.
The other matter of interest has been the reporting of Ted Butler about a new cohort of Silver buyers long 40K futures contract at last count and who have been steadily adding to their positions even during the price draw-downs of the last six months. This is apparently a completely different cohort form the Commercials and Trend Followers who are usually on the opposite sides of precious metals trades and who normally set the tone for the COT reports. I am not sure how and if the new buyers are affecting price movement, or even if their presence is being accounted for in the COT data, but at some point their position is going to start to be an important factor. Bottom line is that spike down I have been anticipating may be a long time coming.
Very conflicted about how to deploy short term trading capital for on the one hand it is really starting to look as if Silver at least is in the next wave up, but on the other hand you can never underestimate the criminality of the banksters. This is just the kind of situation in which they would be likely to dump 100K futures contracts on the market to effect a thorough shake out of all recently entered long positions, particularly those using leverage. I will give it another 48 trading hours before I deploy.
What say Y’all?! 🙂
Silver’s gap ups are generally very bullish. The gap up open on Monday is reminiscent of what it did on January 30 this year. It hugged the upper BB and just kept climbing until it topped with stocks on March. 1. Open interest in Silver now higher than then…
If we say that the move 1260-1240 is a complete 5 wave structure (though it does bother me a little that subminuette 5 is truncated) then 1240-1250 is either the start of minute 1 of minor 3 (main), which would be invalidated by a new low below 1240. Or it is minute 2 of minor c (alternate), which would be invalidated by a new high above 1260.
This makes sense to me but maybe (almost certainly!) is an over-simplification. Would welcome any comments.
I wonder if we are about to see a repeat of what happened in January when both precious metals and equities were in a strong uptrend. I was initially thinking that they would go in opposite directions but clearly that is not always necessarily so.
Lara.
For Minute C of Minor 2, minuette 1 is at 1253.21.
As today’s weird rise had not gone into wave 1 territory, there is still the chance that Minor 2 could continue towards 1230.
Price had risen to a high of 1250.12 and rebounded strongly downwards in the space of one hour before the close. That could be the beginning of minuette 5 down. If correct, we would see a strong selloff on Monday.
But then again, Minor 2 could have finished on a whimper as you had pictured it to be. This brings Minor 2 pretty close to the 0.236 retrace.
You’re right. And I think that would be the best alternate I can see.
I’ll have two hourly charts to finish the week.
Thinking through how to approach this conundrum for Monday… I’ll formulate some trading advice for members. A hedge here may be a good idea.
Lara kindly give a small comment on silver minor 2 correction. It dosent match with gold. If gold needs to rally for minor 3 than silver following gold seems to have no space for proper correction.
Silver is going down today; so far a lower low and a lower high. But it’s a pathetic correction isn’t it.
Basically Silver is sideways.
Silver and Gold just don’t always move together. They’re not fully correlated. So we should not let the analysis of one influence our analysis of the other.
Lara,
What rules this out as being wave 2 of 5 in minor C in your alternate Daily count above?
Only the fact that minute c has moved below minute a, and the structure could now be complete.
To move it all down one degree would see minute c continue for much longer and be much deeper, minor 2 would be quite time consuming. Minute c would take all of next week at least.
I’m working here on the assumption that minor 2 is going to be relatively brief and shallow, because at this point in the wave count with intermediate (3) and primary 3 underway the corrections may begin to be brief and shallow.
Now it doesn’t have to be this way. And today I’ll have at least one alternate which sees minor 2 continuing further.
But we have to go on the balance of probabilities.
Hi Lara,
Do you see any possibility of your labels, Minute a-b-c being all of Minute a crc.
We are now in the beginning stages of Minute b, still to go down in Minute c?
Would this make Minor 2 take up too much time, or can 2 corrections often times take more time than an impulse up in a 1?
Thanks…
That’s entirely possible. But with a potential third wave at two large degrees waiting in the wings, I wouldn’t want to bet on it.
It’s quite likely at this point in the wave count that minor 2 is going to be relatively brief and shallow, so we should work with the most likely scenario.
Of course, that could be wrong. Nothing in TA nor EW is certain. We’re working with probabilities here.
I think it’s all over folks for the short side.
I would recommend closing shorts and taking any profits there now.
Minute c moved beyond the end of minute a, so it avoided a truncation. The channel is breached by upwards movement no matter how it’s drawn, this upwards movement is too large and strong to remain contained within it.
The structure can be seen complete with adjustment.
Yep!
Alan,
Minuette iv O/L is not till 1252.72 so far still Ok? Any thoughts? It has gone deep retrace any bullish alternate?
ssandysc.
The move up is weird. I did not expect it to go up to 0.618 Fib. Minuette 2 was a very deep retrace, and Minuette 4 is now following suit when it should have been mild. Perhaps the lure of a third wave is distorting the picture.
The consolation is that if this is still the 4th wave, and not some other count, then the 5th will be very strong, a climactic selloff possibly, unless it is truncated.
On the brighter side, somebody could be playing an April Fool’s Day joke — it is now April where I live.
Or may be the low at 10:31 PM yesterday was the low for running bullish flat Minute c of Minor 2 and now in Minute I of Minor 3 now.
Running flats are very bullish normally. If so next retrace down is going to be
an awesome entry.If so 1239.86 low should not be breached.
BTW do you live in Australia?
Singapore, with the dubious honour of being the most expensive city in the world.
This could be the alternate playing out
Based on the chart that Lara posted within the comments section, the invalidation point has been breached. Game over on the short, I guess?
That’s reasonably likely. I’ve taken profits on my short, I’m waiting on the sidelines now to see how this session ends.
https://seekingalpha.com/article/4059473-silver-pretty-dangerous?app=1&uprof=51&isDirectRoadblock=false
A fair point made in this Silver article above…
Hi Alan,
Perhaps my thinking is way off, but is there a chance that what Lara has labeled ast Minute a-b-c is ALL of Minute a. Now we are in Minute b of Minor 2?
Melanie.
I guess that is possible. Let’s hear what Lara has to say.
That was a rather quick Minuette 4. Now let’s get down to business with the final fifth.
First target 1234.
Yikes. Spoke too soon.
Looking at gold on the 5 minute level and it’s a either a rising wedge or expanded flat? Either way, I’m wondering if it’s a bearish signal. Needless to say, gold is nearing the invalidation point… about 1 dollar away.
If miners lead, they’re signaling strength today with JNUG gaining over 7% and NUGT up over 5%.
Silver continues its bullish trend. I am glad I exited those puts yesterday.
Once again no expected dive in over-night action. Could something else be going on?
I don’t think I’ve ever seen a dollar chart like this. While short term is unclear on this chart, longer term (think months/years), looks like down is the direction of least resistance. If this chart was more up to date, it would show an upward break of the triangle to backtest the rising wedge.
Looks like a 5 wave up from 1864 to 1985 and now in a decades long correction?
Lara, any thoughts?
Chart posted by Spock @ Goldtent
Oh wow, that’s an awesome chart!
I completely agree that down would be the most likely direction. Especially after a breach of that forever trend line and a back test. If it turns down from the back test, then it should keep going down.
I think micro 3 and 4 are over, subminuette iv may now be unfolding.
Redraw the channel using Elliott’s technique.
Subminuette ii was a deep flat, subminuette wave iv may be a shallow zigzag so it may be quicker than submineutte wave ii.
Profitable short positions may now move stops down to just above the invalidation point, or use a trailing stop if that’s your technique.
The structure is not done yet, but it’s getting closer.
Oops. That’s not a base channel. Ignore that label.
Lara if suppose the hourly count you posted in comments got invalidated above 1248.17. Does that mean we have actually just finished the subminutte1 and the correction probably be much deeper? May be till 1210$ levels or it might increase the weight on alternate count?
New chart above
Alan,
Do we have Micro 3 done at 10.32 PM low? Micro 4 now to near 38.2% of Micro 3?
Also has a INV. H&S at N/L now
Sub-divisions are tough to count for lack of clarity.
There are so many little subdivisions within micro 3 on the five minute chart, there are so many possible ways to count that wave down. Don’t get too hung up on all the little subdivisions.
At 1,234 micro 3 would = 1.618 X micro 1. That’s pretty close to the target at 1,230 so either 1,234 is too low or 1,230 is too high.
If price gets close to 1,234 and we see a good bounce that shows up nicely on the hourly chart, then assume micro 3 is over and micro 4 has arrived.
BUT for Gold, it’s fourth waves are quite often more brief and shallow than it’s counterpart second waves. Micro 4 may not show up on the hourly chart.
Sorry that this is probably not what you want to hear. Just expect the structure is incomplete, it should keep going lower.
Lara,
Thanks for nice explanation, micro 3 target at 1234 looks good. Only concern is to 1230 we only have allowance for $12 from here and need to fit three sets of 3’s, 4’s and 5’s. Will be challenging?
Hi ssandysc. Just came back from some errands and didn’t have time to check yet.
I agree with Lara that there are too many subdivisions to do justice to a count for micro 3. I’ll let it drop to a point when the short-term trend lines indicate a change before deciding whether to realise some profits from the short. I am also eyeing the trigger event of the payrolls report early Friday morning EST. That could cause investors to bail out before continuing the downtrend, meaning a strong 4th wave which would ease the problem of 1234 being too close to 1230, the most probable eventual target of Minor 2. Then again, it may prove to be a non-event, and the slide continues unabated.
As it stands, the most probable drop is to 1230. But, if 1230 fails, then there is the likelihood that the next target is 1217.20 (Minor 2 = 0.618 * Minor 1) or 1211.12 (Minute C = 4.236 * Minute A).
I guess we may have to play it by ear.
While GDX made a new low today, GDXJ did not. That leads me to believe that tomorrow, the miners will make one more new low. If the ending expanding diagonal identified for GDXJ is correct, a minimum low of 34.66 is expected.
https://www.tradingview.com/x/Sexv3D7X/
GDX moved down to a new low today as expected. Shorts should consider closing their trade with a nice profit. GDX may or may not make another new low tomorrow before reversing up.
https://www.tradingview.com/x/LdHWRzII/
FWIW both the 20-day and 100-day moving averages for GDX are at 22.42…
Silver continues to buck the trend with every little dip being bought aggressively. I am not more convinced than ever if we see any substantial decline its is going to be artificially triggered with a massive shorting of the metal via futures contracts. The fact that this has not happened so far could be signal that the usual suspects are afraid to pull that trigger…very bullish imho…
slightly off topic but does anyone here experience what my broker gave me ?
TP at 1242 but it was never closed automatically.
looking into 1m and I saw this: (the first 1m stick that opened at 1240.87
That spike down on the left of your chart is likely a “phantom” spike. I’ve read numerous explanations for them. Often they “foreshadow” an actual move to that price which appears to be occurring now.
Thanks dreamer 😀
Agreed. BarCharts data do this after the NY close. I’ve noticed it seems to foreshadow the next direction too.
I’ve heard one explanation that it’s a large order which is placed but not filled. That may make sense.
With BarCharts sometimes it’s removed retrospectively, sometimes not.