Two hourly Elliott wave counts were provided yesterday. The first hourly wave count is now looking more likely.
Summary: The bottom line for the short term is that while price remains within the channels on the hourly charts expect it to continue to fall. Each time price touches the upper edge of the channels represents an opportunity to join the short term downwards trend, but this is only for more aggressive risk tolerant traders.
This trend may end in two days. Look out for the possibility of a selling climax. If that happens, take profits on short positions.
If price breaks above the upper edge of the hourly chart channels (with upwards not sideways movement), exit short positions. The downwards trend may be over or a deep bounce may be underway.
The main wave count expects a deep pullback to a target at 1,197 – 1,192.
New updates to this analysis are in bold.
Last monthly and weekly charts are here. Last historic analysis video is here.
Grand SuperCycle analysis is here.
MAIN ELLIOTT WAVE COUNT
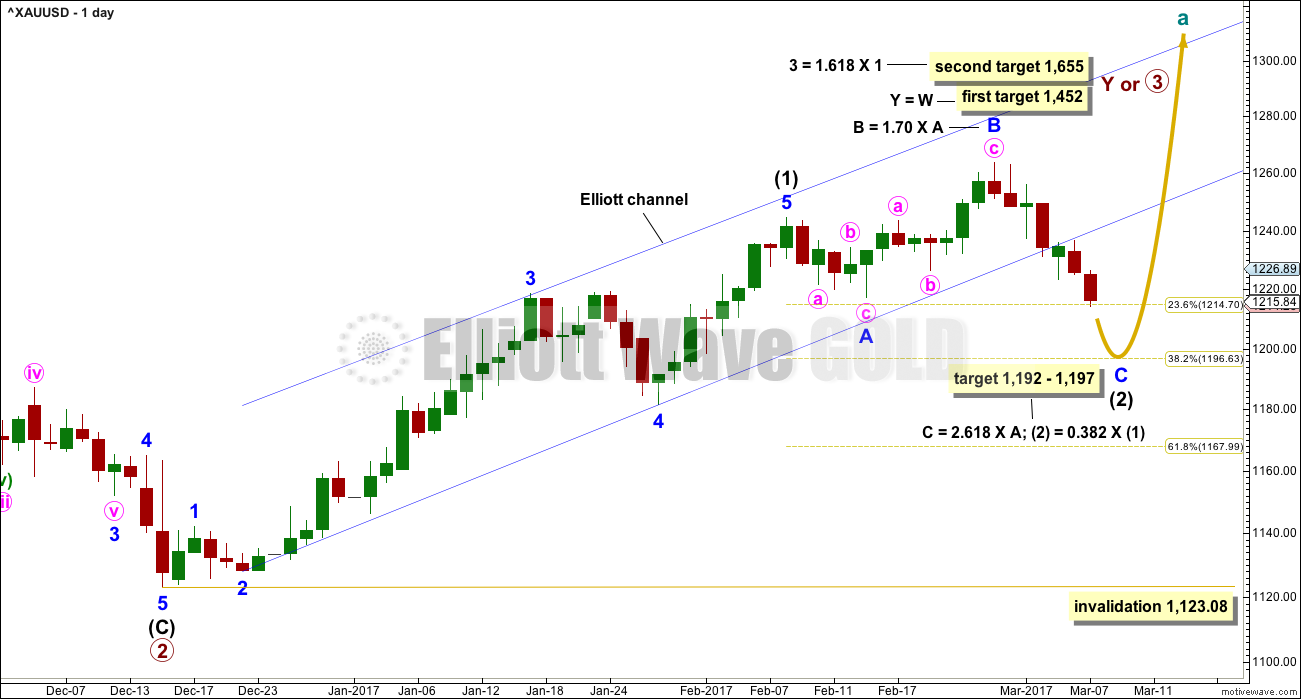
DAILY CHART
Intermediate wave (1) is a complete five wave impulse lasting 39 days. Intermediate wave (2) so far looks like an expanded flat, which are very common structures. The most likely point for it to end would be close to the 0.618 Fibonacci ratio of intermediate wave (1) at 1,197. This is also close to where minor wave C would reach the most common Fibonacci ratio to minor wave A at 1,192, so this target zone has a good probability.
Minor wave C must subdivide as a five wave structure. It would be extremely likely to make at least a slight new low below the end of minor wave A at 1,217.05 to avoid a truncation and a very rare running flat.
So far intermediate wave (2) has lasted 19 sessions. If it exhibits a Fibonacci duration, it may total 21 or 34 sessions and that would see it continue now for a further 2 or 15 sessions.
Intermediate wave (2) may not move beyond the start of intermediate wave (1) below 1,123.08.
At this stage, there are multiple ways to see the subdivisions of minor wave C downwards at the hourly chart level. Below are just three possibilities. It looks entirely possible for minor wave C to now end in just two more sessions.
If this wave count is correct, then at its end minor wave C will provide a very good opportunity to join the longer term upwards trend.
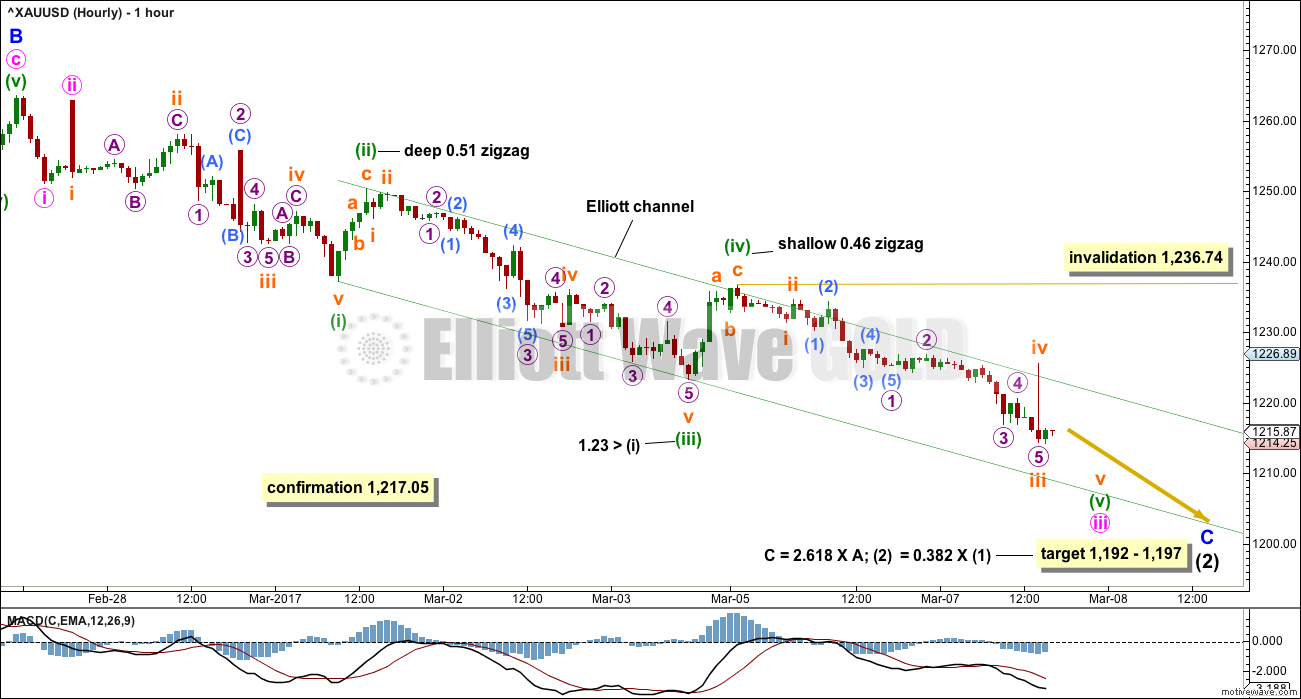
FIRST HOURLY CHART
Minor wave C must subdivide as a five wave structure, either an impulse or an ending diagonal. At this stage, an ending diagonal does not look likely.
Minute waves i and ii are seen still as complete. Minute wave iii is seen still as incomplete.
Minute wave iii may only subdivide as an impulse. It is common for Gold to exhibit very strong extended fifth waves within its third wave impulses. Look out for minuette wave (v) to be very strong, possibly ending with a selling climax.
There is still weakness to downwards movement with MACD showing weaker momentum, but support from volume today improves the probability of this wave count.
It is my judgement today that this first hourly wave count and the third hourly wave count are the most likely scenarios.
If this wave count is right, then each time the upper edge of the channel is touched represents an opportunity to join the short term downwards trend.
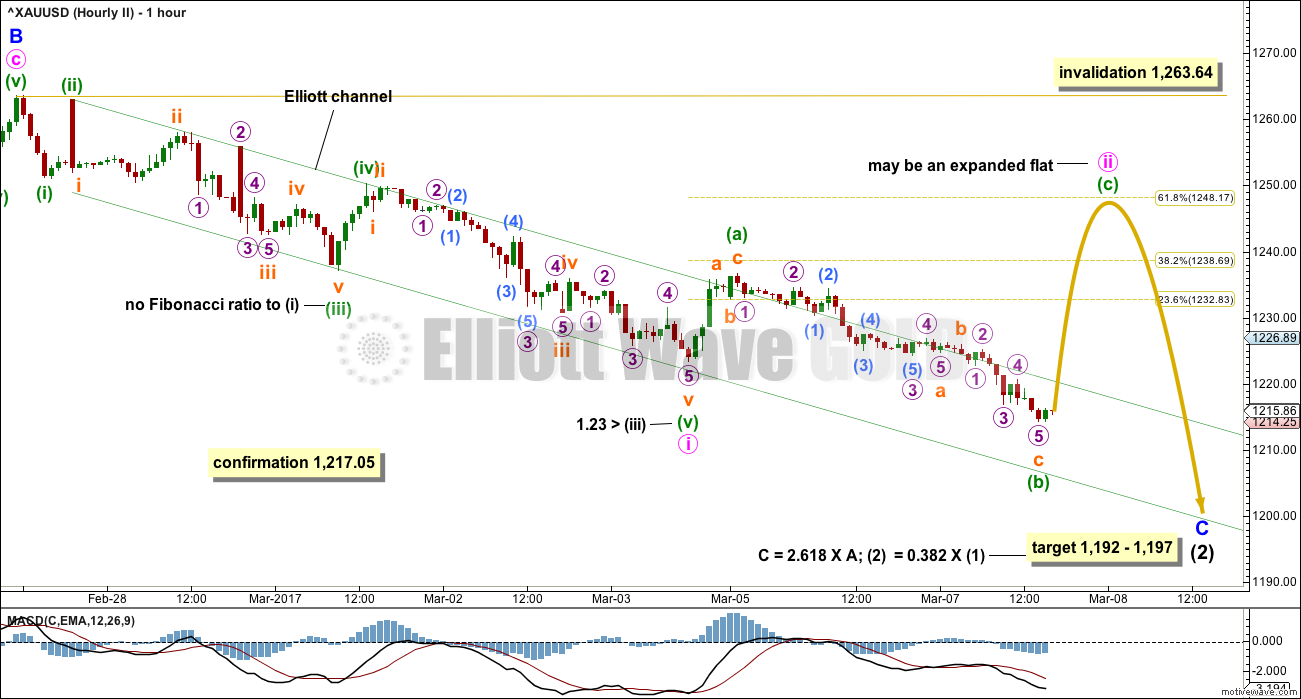
SECOND HOURLY CHART
It is possible that a five wave impulse downwards completed on Friday. This may be minute wave i within the impulse of minor wave C.
Minute wave ii may correct to about the 0.618 Fibonacci ratio at 1,248. Second waves are most commonly deep.
Minute wave ii may be an expanded flat correction. But the support from volume for today’s downwards movement indicates this idea is less likely. B waves should have lighter volume.
If minute wave ii is continuing as an expanded flat, then minuette wave (b) is now a 1.68 length of minuette wave (a). This is reasonably longer than the common length of up to 1.38 but within the allowable convention of up to 2 times the length of minuette wave (a).
This wave count today has less support from classic technical analysis. It is published to illustrate the risk to entering a short position here.
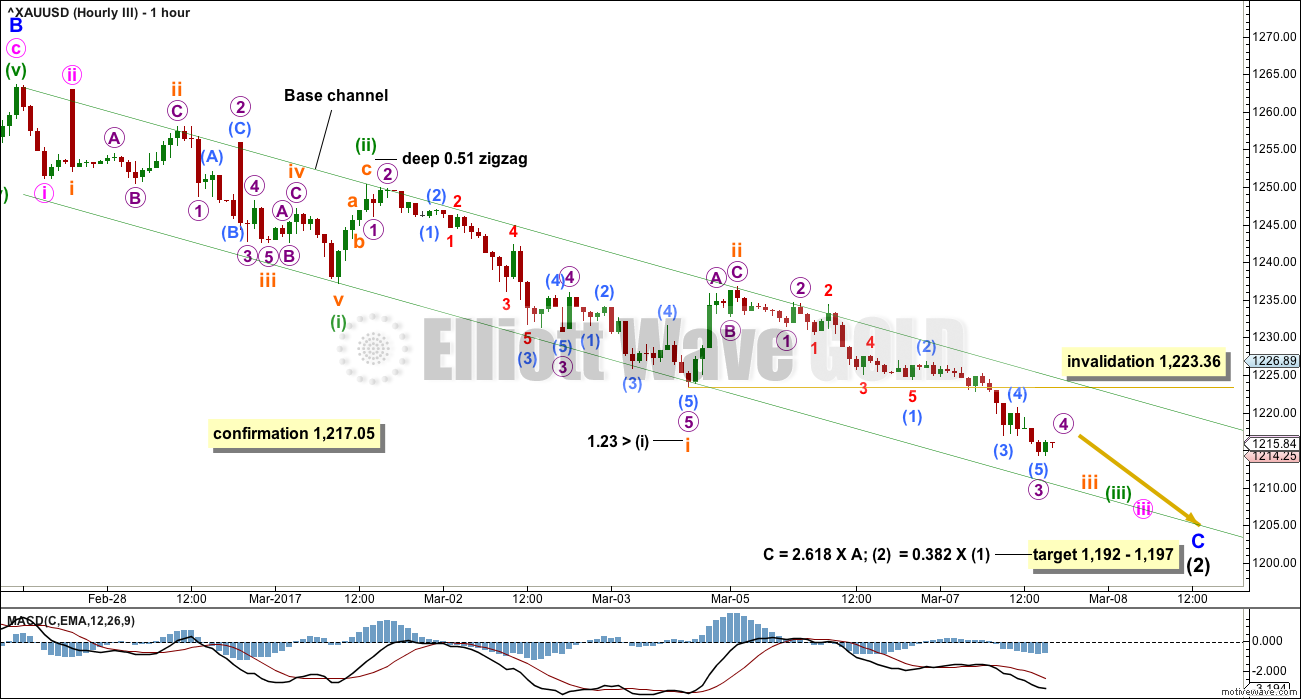
THIRD HOURLY CHART
The first hourly wave count expects an extended fifth wave to complete minute wave iii.
This third hourly wave count expects minute wave iii is the longest extension.
Both scenarios are possible.
The first hourly wave count follows the most common situation for Gold, so it has a slightly higher probability.
It makes no difference at this stage to the final target and almost no difference to the channel.
The bottom line is that while price remains within the channel each time the upper edge is touched represents an opportunity to join the short term downwards trend. If the channel is breached by upwards movement (not sideways), then short positions should be exited.
If price breaks below the lower edge, a selling climax may be building so hold onto short positions. Short positions may then be exited after a day with strong downwards movement and strong volume.
Always use a stop and do not invest more than 1-3% of equity on the short side as this is a counter trend movement.
Alternatively, more patient traders may wait for the bottom to be in before entering long.
TECHNICAL ANALYSIS
WEEKLY CHART
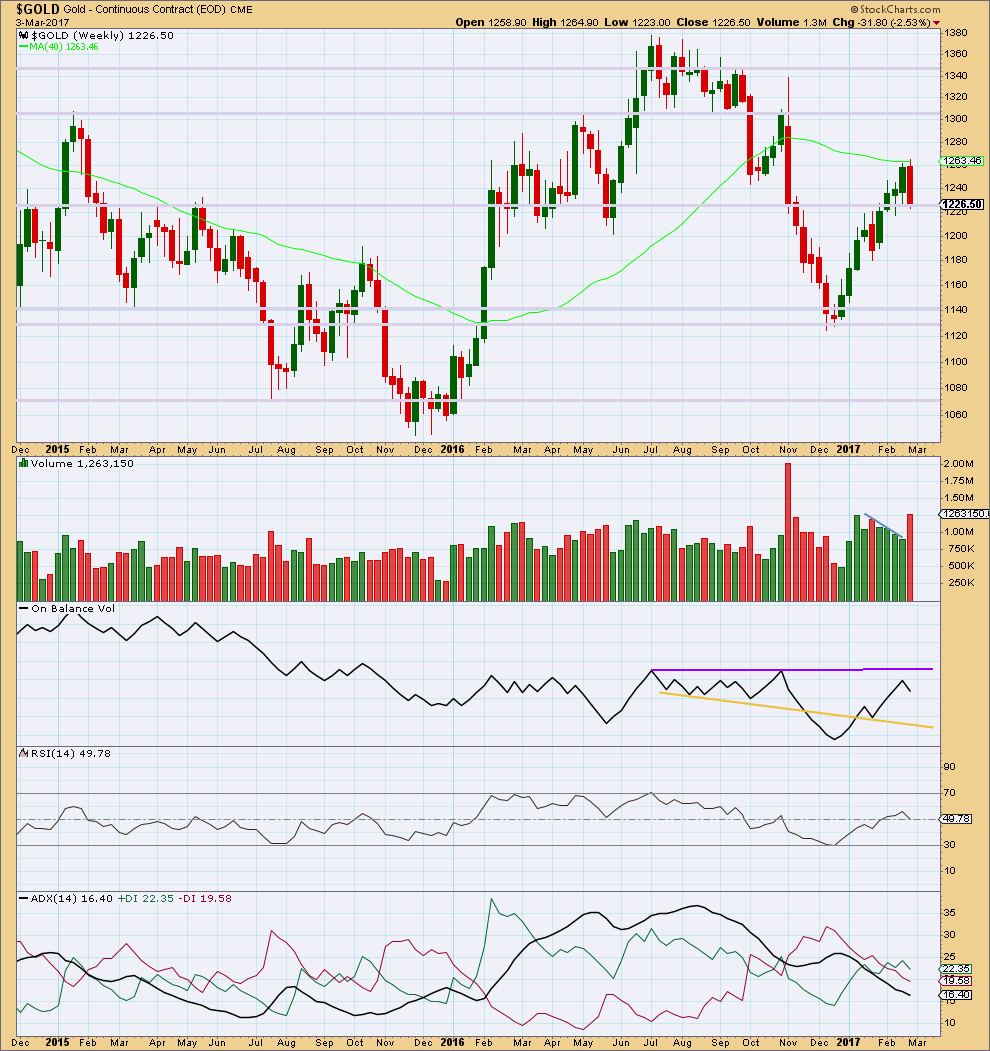
Click chart to enlarge. Chart courtesy of StockCharts.com.
The prior four upwards weeks are all green and showed a decline in volume. Now last week is red and shows a strong increase in volume. Last weekly candlestick completes a bearish engulfing candlestick pattern, the most reliable reversal pattern.
This indicates strongly that upwards movement is over for now. Either sideways or downwards movement from here is a reasonable expectation.
On Balance Volume has still not found resistance.
ADX still indicates the market is not yet trending at the weekly time frame.
DAILY CHART
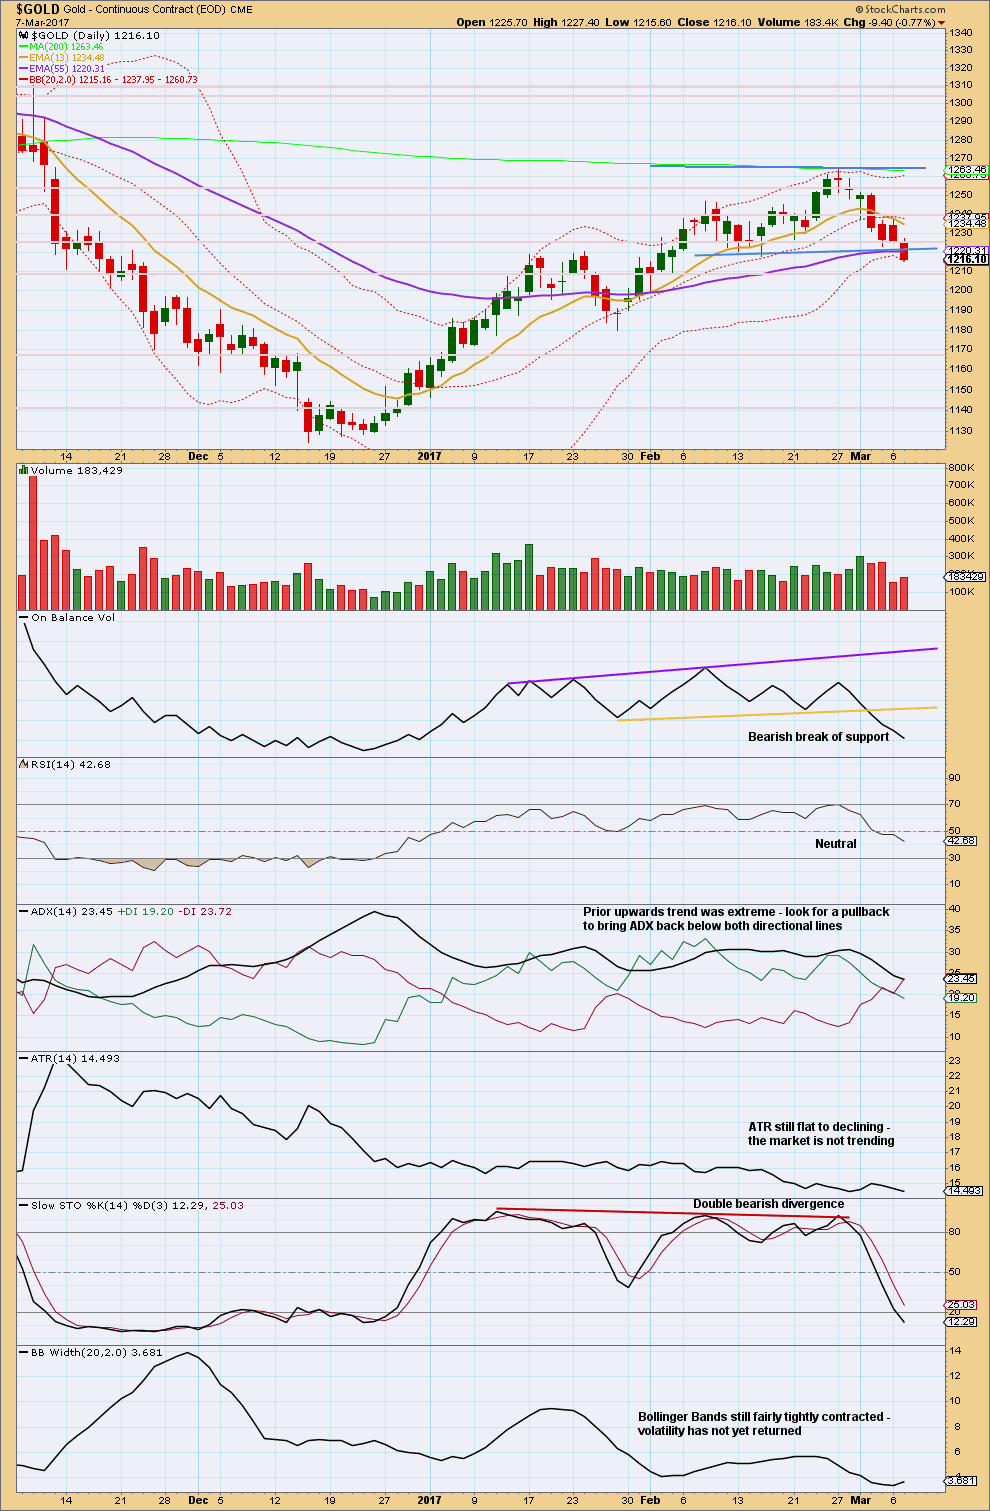
Click chart to enlarge. Chart courtesy of StockCharts.com.
Another downwards day closes below prior support about 1,220. Next support is about 1,210.
Volume today supports downwards movement. This supports the first and third hourly wave counts.
ADX is still not below both directional lines, Stochastics is just entering oversold, and RSI is not yet oversold. There is room for downwards movement to continue, so expect it to continue until conditions reach extreme and show divergence.
GDX
DAILY CHART
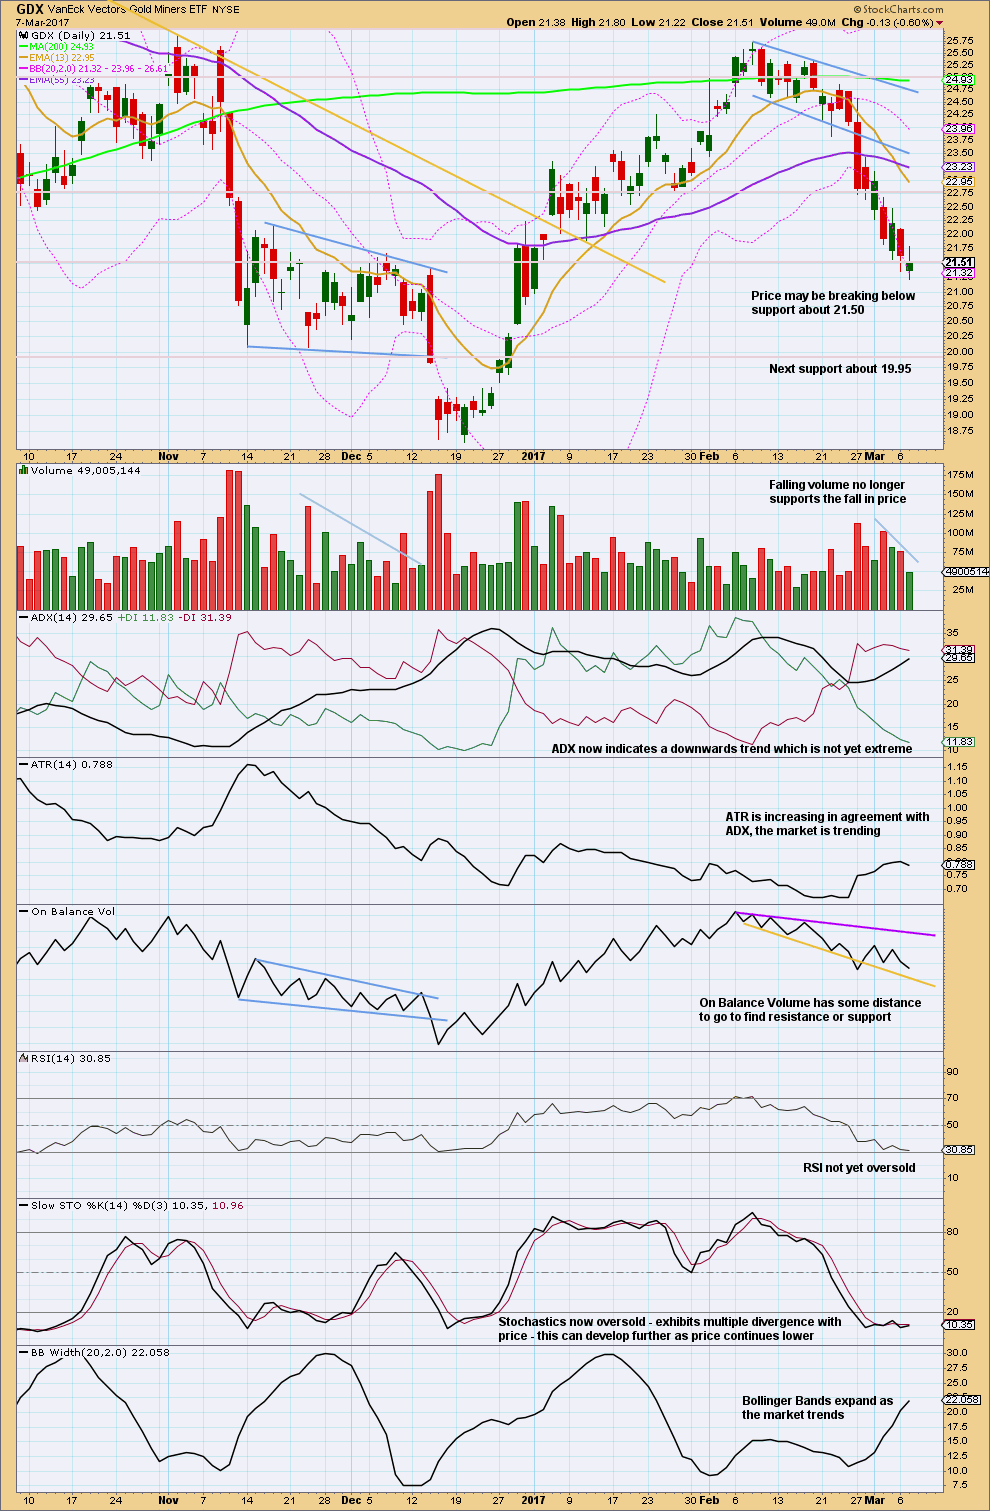
Click chart to enlarge. Chart courtesy of StockCharts.com.
Price has sat on the lower edge of Bollinger Bands for seven days in a row now. A bounce or sideways consolidation here or very soon would be a reasonable expectation to bring price back within Bollinger Bands.
The last three sessions moved price lower on declining volume. The market is falling of its own weight.
Stochastics exhibits multi day divergence now with price, but RSI is not yet oversold.
This downwards trend is nearing extreme, but there is still a little room for price to fall further. Look for next support about 19.95.
This analysis is published @ 05:23 p.m. EST.

Hi Lara,
Would be interested to get your take on GBP/AUD for the trading room as might provide a good opportunity for us over next few days. Is moving up from support and looking to break through daily trendline. Possibly start of Minute C?
In a perfect world gold would bottom tomorrow and the stock market would head down.
I am keeping a close eye on a few moving averages. I like Lara’s count and I expect the miners to turn before Gold bottoms. We really should see at least one green candle by this Friday, even if the faster 13 day SMA does not turn immediately. If we get a green candle tomorrow and one one Friday that would be most auspicious!
Third hourly chart updated:
First hourly chart updated: the invalidation point is now the low of minute i. But it’s the channel which should be used.
Alan,
It appears 9:07 AM low in /GCJ (April Futures) was the low for Minute[iii] and in minute [iv] now towards 1222-1226?
Yes. Although 1220 seems a bit too high as of now.
It does seem high, 1226.50 is 38.2% retrace of Minute [iii] so thereabout
It could be just 23.60% near 1218.80
I am on yellow alert for the miners as in three of four of the etfs the 13 day SMA has now crossed below the 50 day SMA. A failure to bounce there is bearish for the intermediate term. I am loading some hedges today for my long positions just in case. if we do not see a reversal in the next 48 hours I am out of my long miners’ trades and going short the sector.
My 2 cents.
Silver is back testing the break out of Jan 3rd week at 17.28 area. Let us hope it continue sideways and turns here in few days.
May get a washout overnight here soon and then look for a hammer on the gold stocks. But those dang commercials have me nervous. I’ll be watching them carefully over the next few weeks for clues
Is it possible we are not in 3 up but still correcting from the move from 1050 to 1400. Perhaps we just finished b up of 2 down and are now in c down?
Lara, what if this move down is a continuation of the bear market. There is always that possibility as much as we can’t see it now. Could you give us a quick overview of that when you have the opportunity.
Thanks
I do expect that we are probably at a point of a bounce or the start of another large leg up. I was concerned with the commercials having a large short position in silver. It was about the same as what it was in the last move down from a higher price. See chart. See jack chans article in gold-eagle for more info
Here are the gold traders positions
Now that price has dropped to more than two times Fib in the 2nd Hourly count, where Minuette B > 2 times Minuette A, that count can be dropped. Anyways, the drop should be over, or almost over unless the 5th wave extends.
The junior miners GDXJ and JDST have also already made the turn ahead of the corresponding “senior” ETFs…I think we are close.
A message to members to take a look at Copper. It’s behaving as expected, this may be a nice short opportunity. Stop set just above 2.706, the last swing high. Target minimum 1.937.
It broke a support line, turned up for four days to retest, and now has moved down to make a new swing low. That’s adding confidence in a trend change here for Copper.
Remember please members, noting in TA is always right. I make mistakes. That’s why it’s important to manage risk. Please remember my two Golden Rules.
Here are a couple of ways to trade the decline. The first has options, the second does not and will have to be sold short directly.
1. JJC ( iPath® Bloomberg Copper Subindex Total Return(SM) ETN )
2. COPX (Global X Copper Miners ETF)
I am buying a cache of JJC March 17 expiration 30 strike puts for 0.50 per contract.
This is a good candidate for a quick double in about ten days….
That’s great info Verne, and Lara.
Many thanks…
Most welcome Ari. Another ETF to keep an eye on is the ishares MSCI Chile index ECH. Chile is the world’s largest copper produce (about 33%) and the price hit copper is taking is going to show up in that index sooner or later. I am keeping an eye out for a close below 40 which I think would trigger a sell signal; will post an update when and if that happens…
That would be great Verne 🙂
Not much change in the miners today although GDXJ did close positive as GDX closed negative. This is a good sign of a bottoming process. We are getting close. Another 2-3 days and the bottom will likely be in.
https://www.tradingview.com/x/OOIhzJNG/
Most excellent. I’m picking right now maybe 2 days for Gold to bottom too….
We may have a very nice buying opportunity coming up Dreamer!
It’s gonna be YUGE! 🙂