
Price continues to move lower towards the target as expected.
Summary: The bottom line for the short term is that while price remains within the channels on the hourly charts expect it to continue to fall. It is entirely possible that my targets could be wrong and price could fall much lower, so for more aggressive risk tolerant traders each time price comes close to the mid line of the channels presents another opportunity to join the downwards trend.
This trend may end very soon now. Look out for the possibility of a selling climax. If that happens, take profits on short positions.
If price breaks above the upper edge of the hourly chart channels (with upwards not sideways movement), exit short positions. The downwards trend may be over.
The target remains at 1,197 – 1,192. Price is now less than $1 away from the target. Short positions may be closed in part or full if the target is met (favour 1,196).
New updates to this analysis are in bold.
Grand SuperCycle analysis is here.
MAIN ELLIOTT WAVE COUNT
FIRST WEEKLY CHART
Click chart to enlarge.
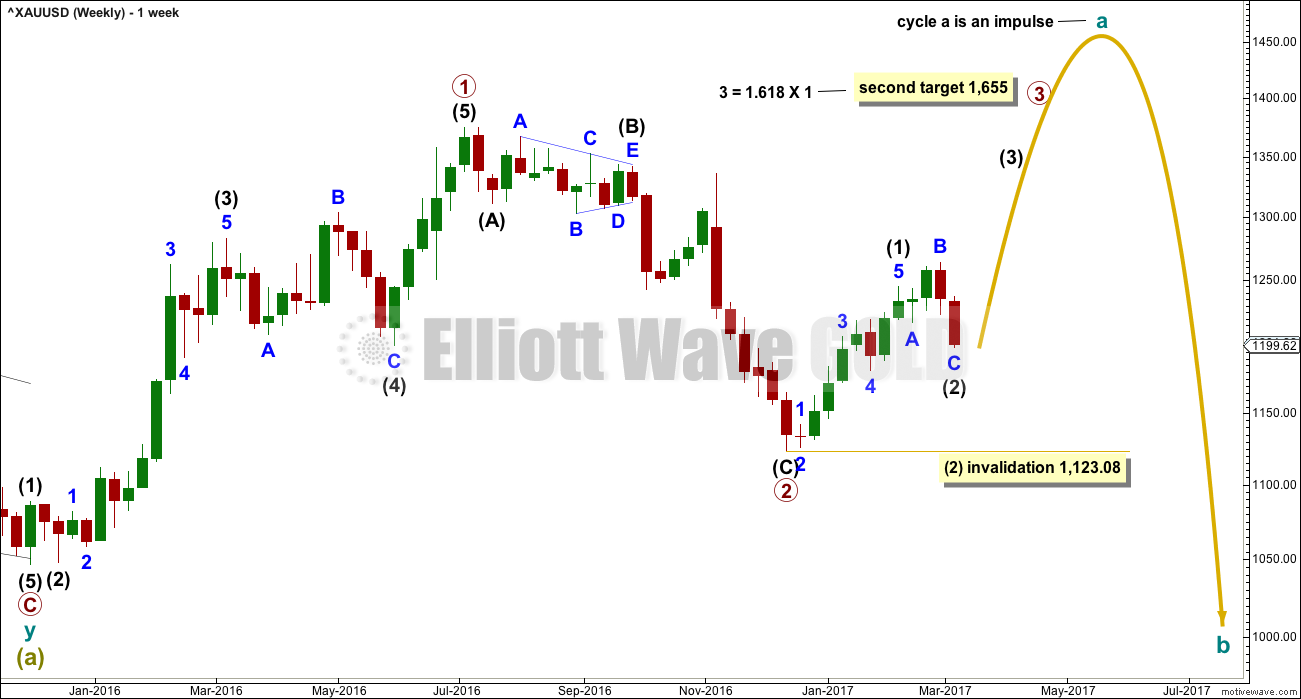
The upwards wave labelled primary wave 1 will subdivide as a completed five wave impulse.
The downwards wave labelled primary wave 2 is seen in exactly the same way for both main weekly charts, as a single zigzag.
This weekly chart expects to see an increase in upwards momentum as a third wave unfolds.
Primary wave 1 lasted 31 weeks, primary wave 2 lasted 23 weeks, and primary wave 3 may be expected to last about a Fibonacci 55 weeks.
SECOND WEEKLY CHART
Click chart to enlarge.
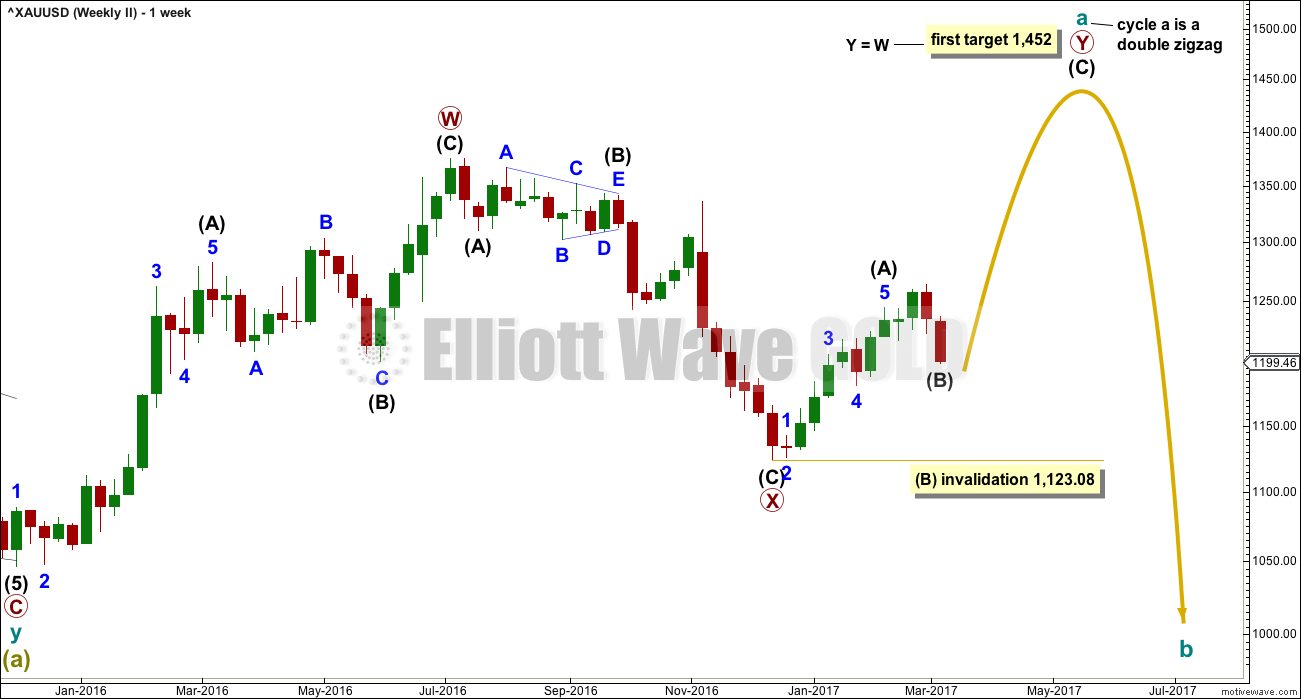
The upwards wave labelled primary wave W looks good as a three. Cycle wave a may be unfolding as a double zigzag.
Within the double zigzag, primary wave X may now be a complete three. This downwards movement fits neatly as a single zigzag.
Primary wave W lasted 31 weeks, so primary wave Y may be expected to last about a Fibonacci 34 weeks.
DAILY CHART
Click chart to enlarge.
This daily chart will suffice for both weekly charts above.
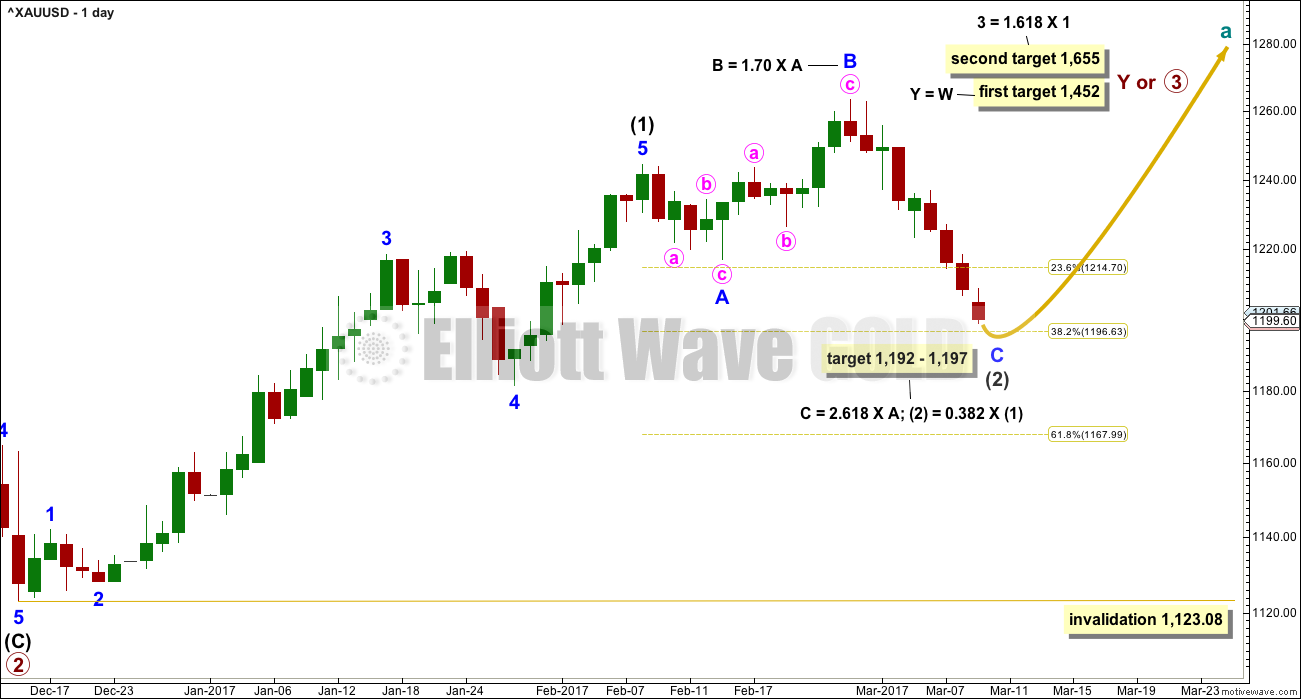
Upwards movement is either a third wave (first weekly chart) to unfold as an impulse, or a Y wave (second weekly chart) to unfold as a zigzag. If upwards movement is a zigzag for primary wave Y, then it would be labelled intermediate waves (A) – (B) and now (C) to unfold.
Intermediate wave (1) is a complete five wave impulse lasting 39 days. Intermediate wave (2) so far looks like an expanded flat, which is a very common structure. The most likely point for it to end would be close to the 0.618 Fibonacci ratio of intermediate wave (1) at 1,197. This is also close to where minor wave C would reach the most common Fibonacci ratio to minor wave A at 1,192, so this target zone has a good probability.
Minor wave C must subdivide as a five wave structure. It would be extremely likely to make at least a slight new low below the end of minor wave A at 1,217.05 to avoid a truncation and a very rare running flat.
So far intermediate wave (2) has lasted 21 sessions. It may end here slightly short of the target, or it may continue a little lower and not exhibit a Fibonacci duration. Waves sometimes exhibit Fibonacci durations but not always.
Intermediate wave (2) may not move beyond the start of intermediate wave (1) below 1,123.08.
At this stage, there are multiple ways to see the subdivisions of minor wave C downwards at the hourly chart level. Below are just two possibilities.
If this wave count is correct, then at its end minor wave C will provide a very good opportunity to join the longer term upwards trend.
FIRST HOURLY CHART
Click chart to enlarge.
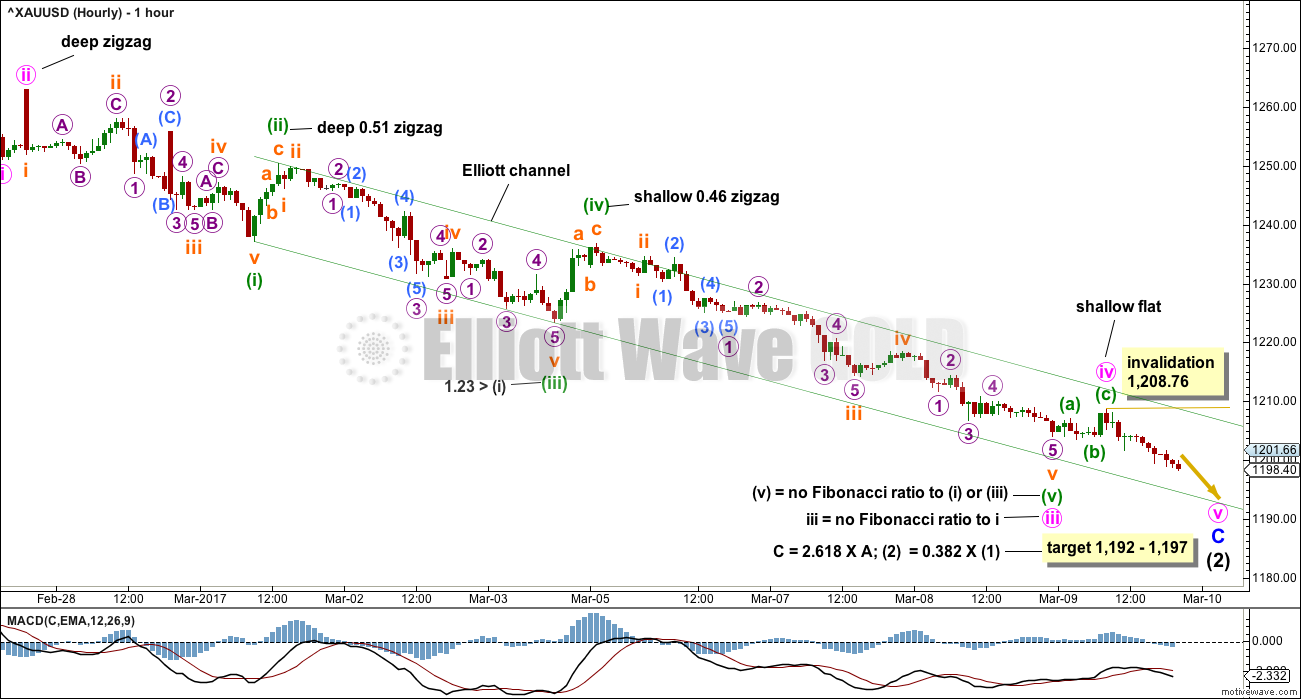
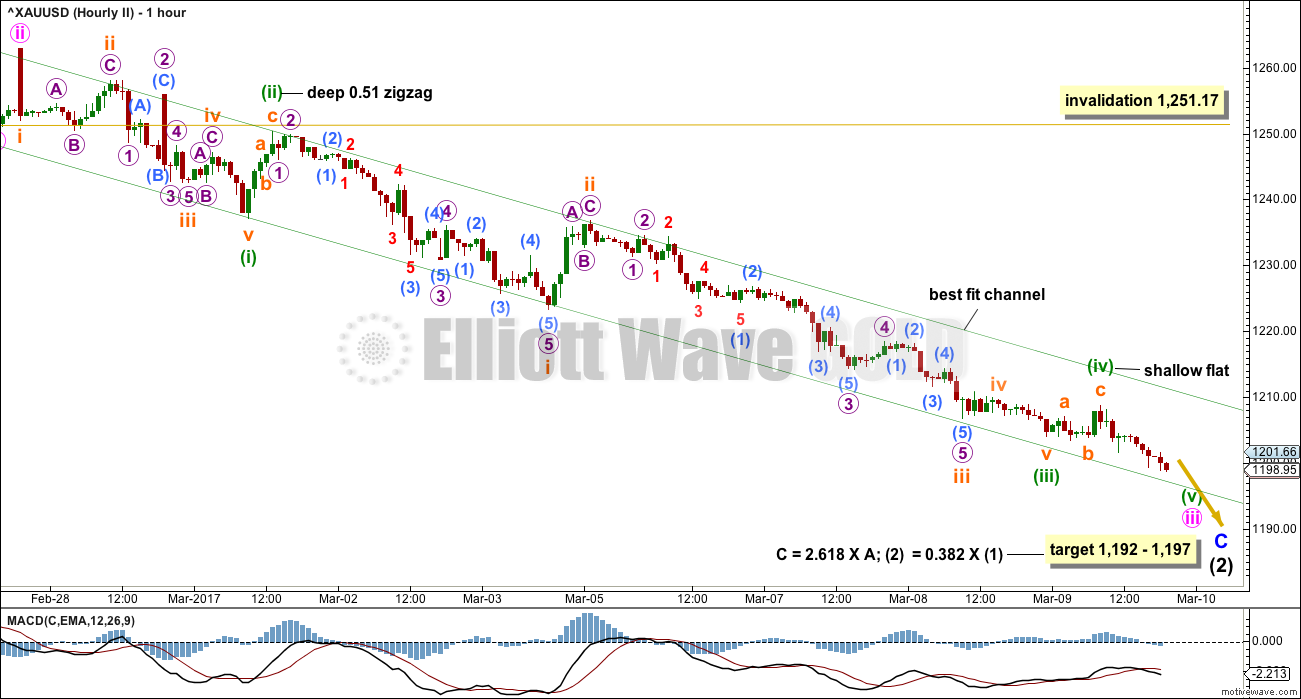
Minor wave C must subdivide as a five wave structure. It is an almost completed impulse.
Minute wave iii may have unfolded as a very shallow regular flat correction. This would give perfect alternation with the deep zigzag of minute wave ii.
The tendency of Gold to exhibit strong swift fifth waves turns up most commonly at the end of its third wave impulses. If this wave count is now correct in that minute wave iii is over, then we may now not see a selling climax. Minor wave C may come to a more quiet end.
A selling climax is still possible for minute wave v as it is a fifth wave, but because it ends a C wave and not a third wave the probability of a selling climax has reduced slightly.
There is still weakness to downwards movement with MACD showing weaker momentum, but support from volume again today improves the probability of this wave count.
Minute wave iii exhibits no adequate Fibonacci ratio to minute wave i. This makes it more likely that minute wave v will exhibit a Fibonacci ratio to either of minute waves i or iii, and equality in length with minute wave i is the most common. This would be achieved at 1,196, which is within the target zone already calculated.
This zone now would provide Fibonacci ratios at three degrees, so it has a very good probability.
SECOND HOURLY CHART
Click chart to enlarge.
This wave count has a slightly lower probability than the first. It expects the extension within minor wave C is the third wave. It is common for Gold to exhibit extended fifth waves. Both possibilities should be considered.
However, it makes almost no difference still to how the channel is drawn. It makes no difference to the target and no difference to the expected direction.
Today it does make a difference to the question of whether or not to expect a selling climax. This wave count still sees minute wave iii incomplete and the final fifth wave down within it now underway. If momentum builds strongly and price continues lower, look out for the possibility the target may be too high. If the next session completes a selling climax, that may be the end of minute wave iii.
Use the channels on these hourly charts for an indication of when minor wave C is over. When the channels are breached by upwards movement (not sideways) that shall be the earliest indication that minor wave C is likely to be over, so intermediate wave (2) in its entirety is likely to be over.
The next wave up for Gold may be a third wave at two large degrees, an excellent buying opportunity, if the daily wave count is correct.
ALTERNATE ELLIOTT WAVE COUNT
WEEKLY CHART
Click chart to enlarge.
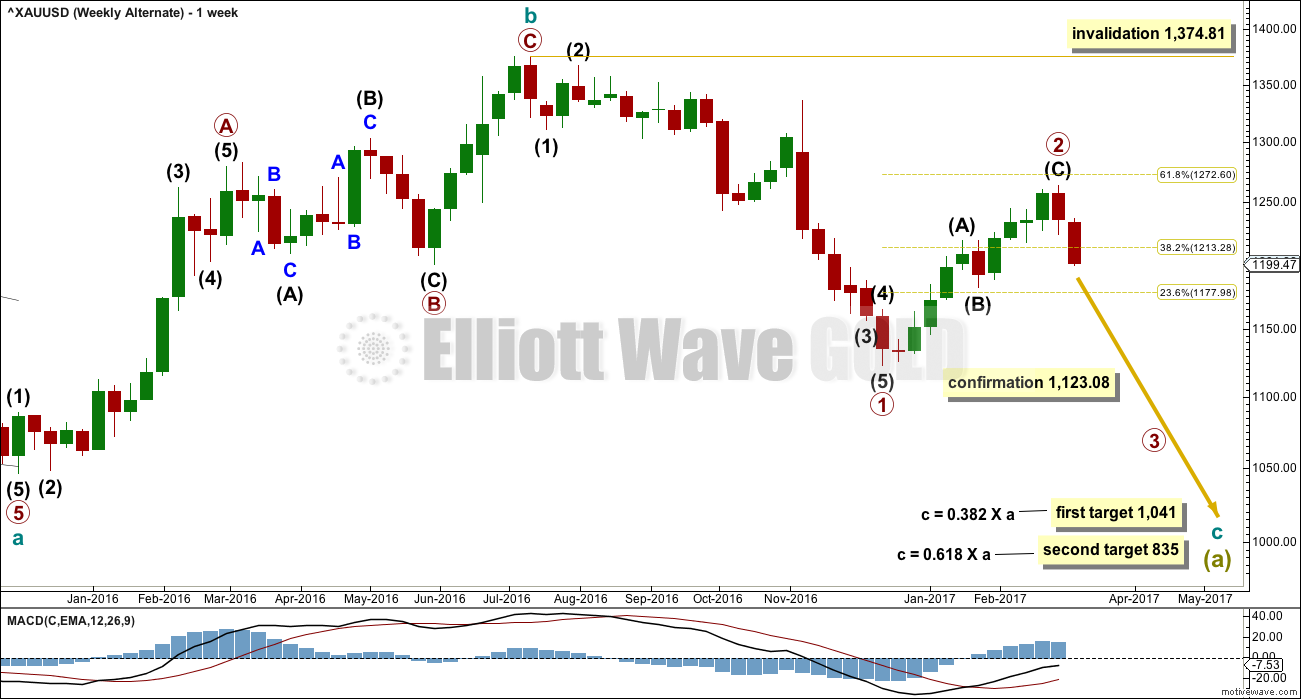
Cycle wave b may be a complete zigzag.
Within cycle wave c, a first wave down for primary wave 1 would now be complete.
Primary wave 2 is most likely to correct to the 0.618 Fibonacci ratio at 1,272.60.
Primary wave 1 lasted 22 weeks, one longer than a Fibonacci 21. Primary wave 2 may have ended in just 11 weeks (no Fibonacci duration).
Primary wave 2 may not move beyond the start of primary wave 1 above 1,374.81.
This wave count is very bearish and is not supported by classic technical analysis at the weekly chart level at this stage. It will be published in historic analysis only, and not published daily as it is my judgement that would give it too much weight. If it shows itself to be true, then it will be published daily. It requires confirmation with a new low below 1,123.08.
TECHNICAL ANALYSIS
WEEKLY CHART
Click chart to enlarge. Chart courtesy of StockCharts.com.
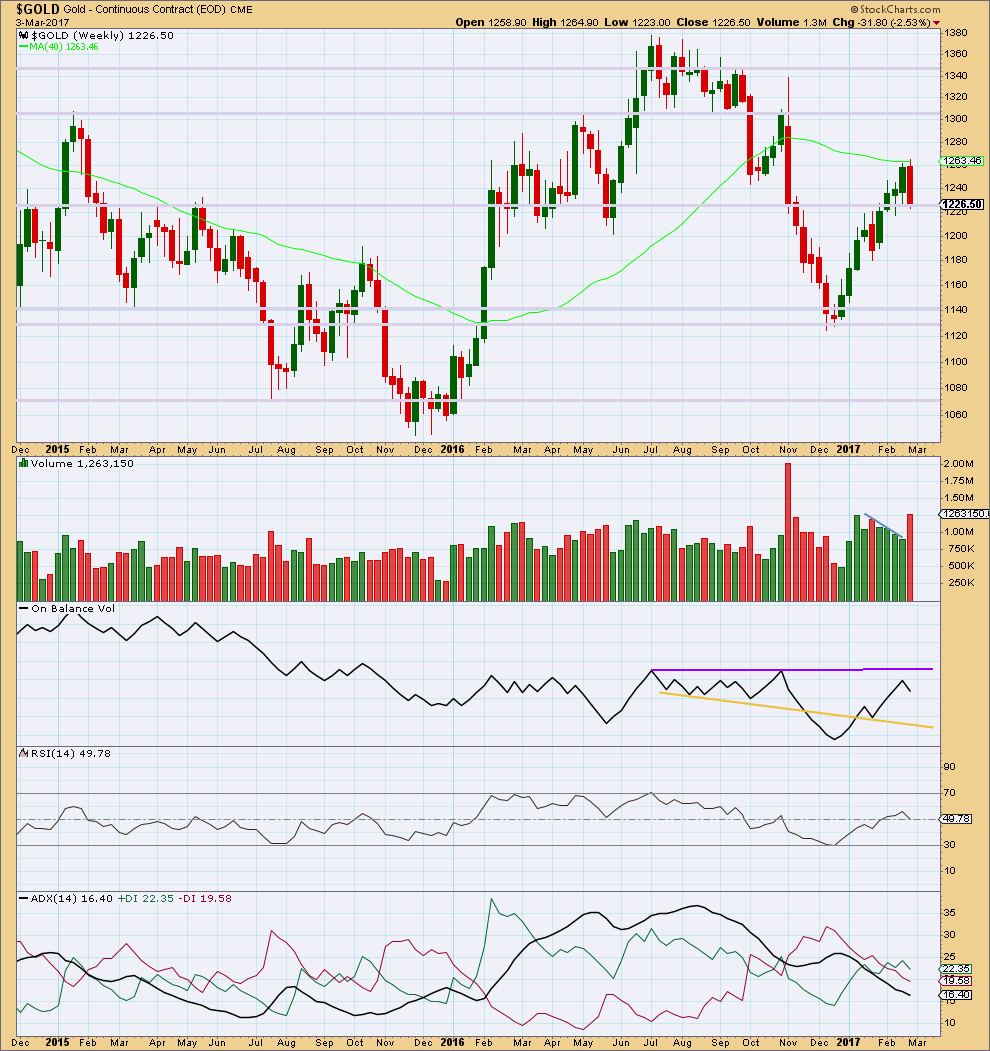
The prior four upwards weeks are all green and showed a decline in volume. Now last week is red and shows a strong increase in volume. Last weekly candlestick completes a bearish engulfing candlestick pattern, the most reliable reversal pattern.
This indicates strongly that upwards movement is over for now. Either sideways or downwards movement from here is a reasonable expectation.
On Balance Volume has still not found resistance.
ADX still indicates the market is not yet trending at the weekly time frame.
DAILY CHART
Click chart to enlarge. Chart courtesy of StockCharts.com.
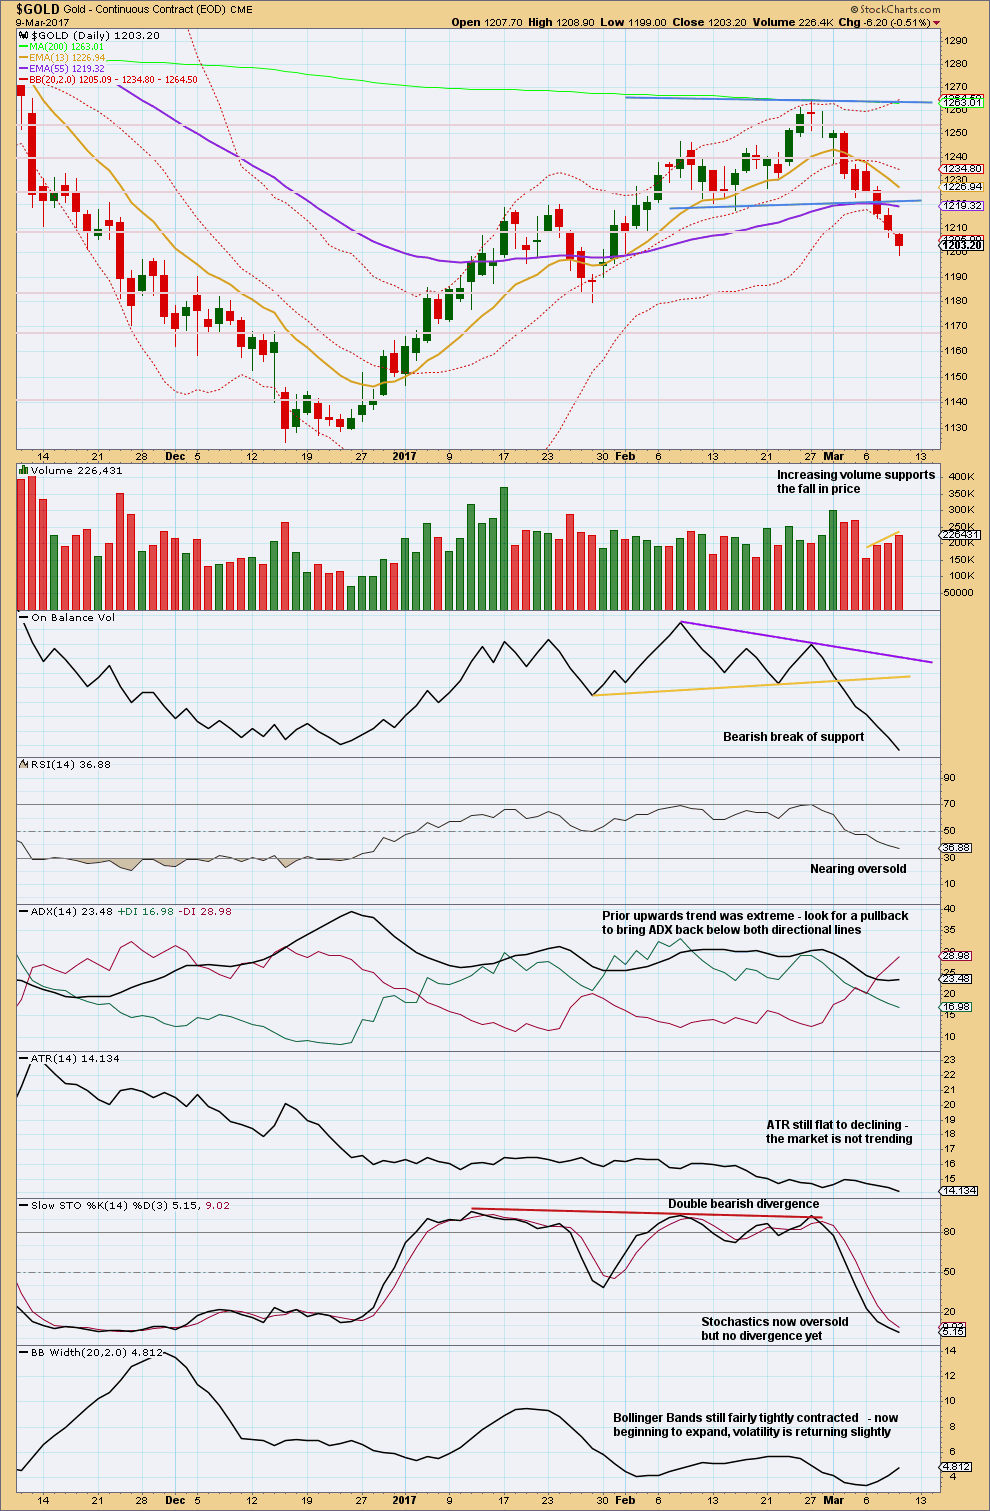
Notice how volume this week for downwards movement is all lighter than prior upwards days. A rise in volume today offers some support for the fall in price, but unless tomorrow completes a strong downwards day with very strong volume the volume this week will be much lighter than last week.
At higher time frames this downwards movement looks like a counter trend movement with lighter volume. This fits the main weekly Elliott wave counts.
On Balance Volume is very bearish.
ADX is still not below both directional lines. Stochastics still does not exhibit any divergence with price at lows and RSI is still not oversold. There is room still for price to fall further.
Next good support is just above 1,180.
GDX
DAILY CHART
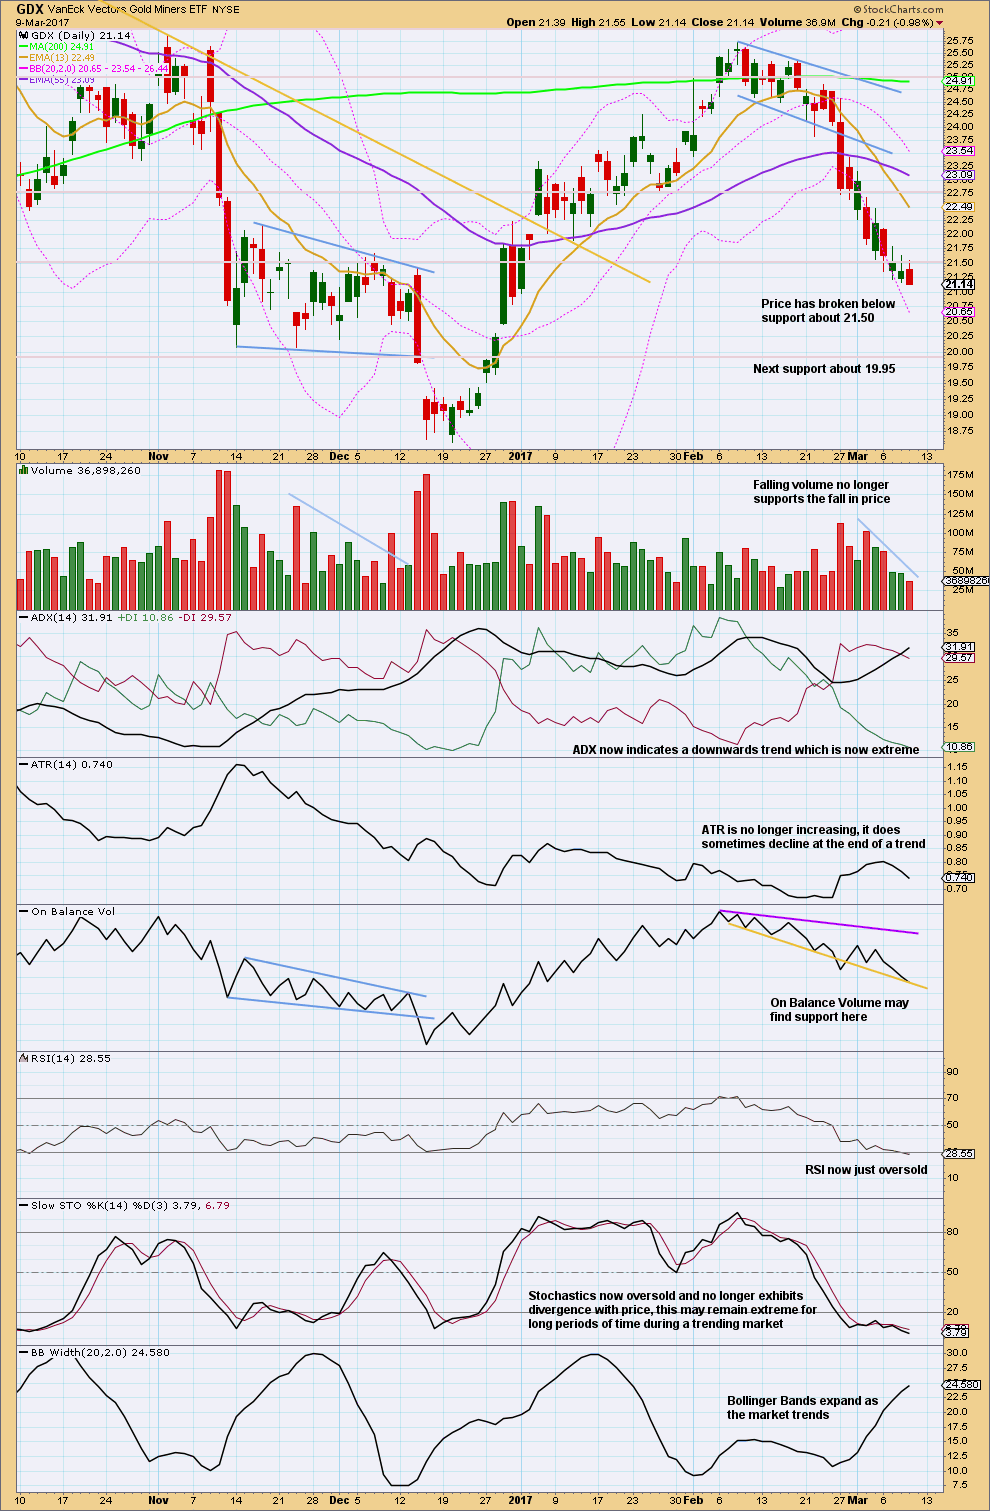
Click chart to enlarge. Chart courtesy of StockCharts.com.
Next support is still about 19.95.
However, RSI is now oversold and ADX is now extreme. Look out for an end to this trend here.
More conservative risk averse traders may like to take profits here. Alternatively, draw a channel about downwards movement on an hourly chart and wait for it to be breached by upwards movement before taking profits on short positions.
This analysis is published @ 09:17 p.m. EST.
I forget who mentioned the possibility of a BitCoin ETF recently….was it Thomas?
Anyway, one of the possibilities, the Winklevoss Trust was rejected. Still others in the pipeline.
http://www.marketwatch.com/story/heres-whats-next-for-bitcoin-after-the-sec-killed-the-winklevoss-bitcoin-trust-2017-03-10
Opening a short to hedge on Gold, stop just above last swing high, target the 0.618 Fibonacci ratio at 1,168.
Gold is failing so far to break out of the trend channels. Long upper wicks on the last two highs.
If it’s going to make a new low then I want to mitigate my loss on the long position, and hold on a bit further to take some profit.
Still also holding a small hedge. I still think we could see one final bear raid which would be a great opportunity to
add to long positions.
It is possible that we have had a trend change, but it is too early to have any confidence in this idea.
Any members still holding shorts should consider taking profits if the trend channel is properly breached.
I define a breach as a full hourly candlestick above and not touching the upper edge, and it should be upwards movement not sideways. So far the channel has only been overshot, not breached.
The channel on the second hourly chart has the upper edge a bit further away, that hasn’t even been touched yet. A more conservative approach would be to wait for that channel to be breached before entering long.
I am concerned about the Eur/USD move up. It is more then a 1%. The PM are not plaing it. Currencies are now flirting with Oil?
So I see 1205 are tested with the smart money just now 🙂
Umpf…
Umpf and a half…
I’m really concerned about what EURUSD is doing too. I had a short, now out. I can’t find a decent trend line for resistance on Euro.
Miners are strong going into the close and volume is picking up. If volume beats yesterdays volume that will be another positive sign.
The banksters are almost certainly going to try and run the stops of these early buyers. This is what they always do. The next spike down after this bounce will be the ideal entry point I think. I plan to exit my remaining hedges then.
Mid-day update:
Gold and Silver are putting in doji type candles so far, so that could be the bottom. Volume looks low.
Miners look a little better with more bullish candles and a decent increase today, albeit on low volume.
With a breach of the GDX Elliott Channel, it should be safe to go long with a stop below yesterday’s low.
Sometimes a turn in trend takes a few days to get going.
Got Gold? Got Miners?
https://www.tradingview.com/x/PP7NQcey/
Nice. It’s all looking good so far…. lets see how this session closes.
Whoa! Sharp turn North! Are we really done? Yippee!
1204.674 USD is 0,68 of todays low and yesterdays high. Can I state that upwards trend is coming if price checks this value?
I set my order at 1,205. That looked pretty safe. But it did move up there really quickly the the channel is overshot, not breached 🙁
So at this point in time the channel isn’t breached, so no confidence in going long. Yet.
We could see a final sharp spike down to shake out remaining longs. I will be unloading remaining hedges today and opening a few “stink bids” to take advantage of any such move.
Yesterday I saw a possible contracting ending diagonal forming, but wanted to see more structure. Today the structure looks complete and it fits good, adhering to the trend lines and wave length restrictions. The invalidation point for Minuette wave 5 of the ED is 21.00 which is very close. I think this has a very good probability of being correct, which means that GDX won’t make it down to the 2016 uptrend line.
So this implies that Gold needs to complete it’s downward move overnight and start to move up on Friday. The release of the jobs data before Market open could be the trigger to start Gold’s next move up and it does appear that the Gold EW count is in alignment.
https://www.tradingview.com/x/mZIScHPr/
That ending diagonal looks good.
Let’s see if Gold can print a green candlestick, or a candlestick with a long lower wick. I’m looking to set an order to open a long before I go to sleep tonight, if Gold is going to turn it will probably do it while I’m out.
And a big THANK YOU again Dreamer for posting the chart 🙂
Indeed! 😄
You’re welcome. Looks like the bottom may be in!