
Last week expected a pullback to begin for Silver. Price has edged up slowly all week.
Summary: Look out for a small pullback here or very soon for Silver. This may present a good opportunity to join a new upwards trend. If it is deep, look for strong support at the lower edge of the black base channel on the main daily Elliott wave chart.
New updates to this analysis are in bold.
Last monthly chart is here.
ELLIOTT WAVE COUNT
WEEKLY CHART
Click chart to enlarge.
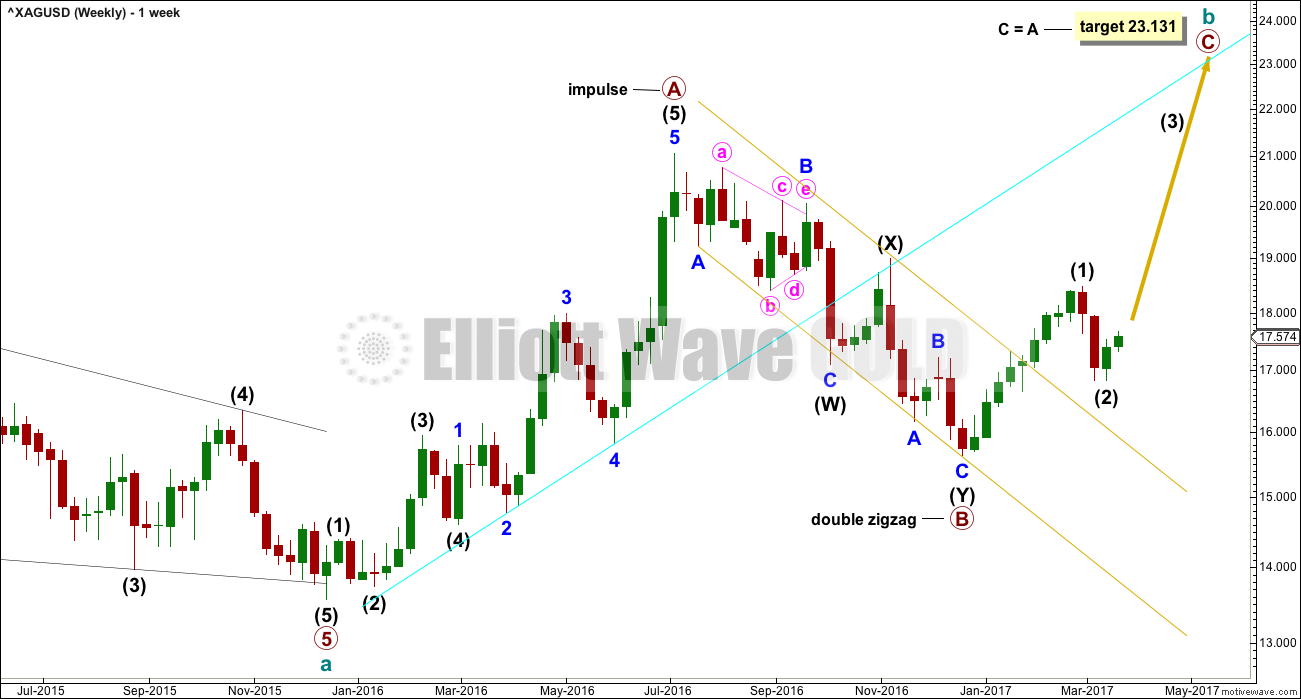
Upwards movement labelled primary wave A fits perfectly as an impulse.
Primary wave B fits as a deep double zigzag. Primary wave C must subdivide as a five wave structure. The target expects it to reach the most common Fibonacci ratio to primary wave A.
Primary wave A lasted 29 weeks. Primary wave B so far lasted 24 weeks. These waves are in proportion. However, B waves can be very long lasting, so it is important to consider alternates. An alternate is provided at the daily chart level.
DAILY CHART
Click chart to enlarge.
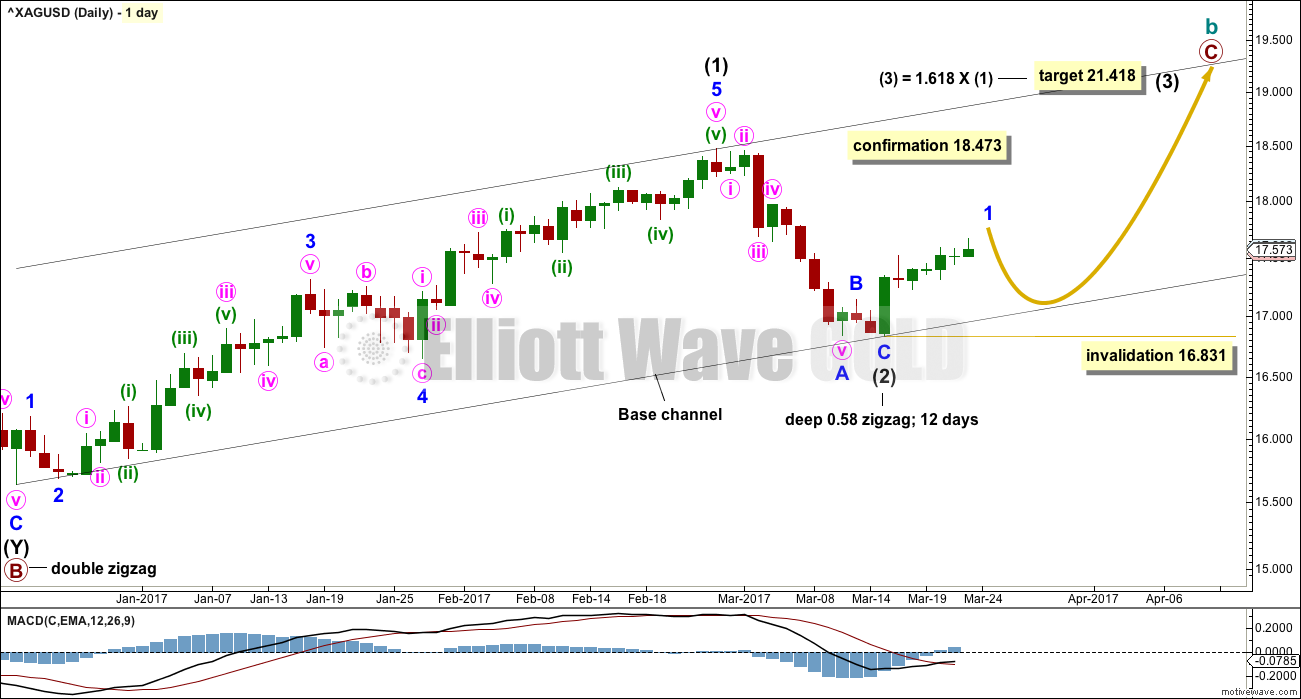
Intermediate wave (2) now looks complete as a zigzag, close to the 0.618 Fibonacci ratio of intermediate wave (1).
A new high above 18.473 would invalidate the alternate below and provide confirmation of this main wave count. At that stage, intermediate wave (3) would also have moved beyond the end of intermediate wave (1) meeting the Elliott wave rule.
Within intermediate wave (3), no second wave correction may move beyond the start of its first wave below 16.831.
It is not possible to see a complete five wave structure at the hourly chart level for minor wave 1 because it requires a final high for the last fifth wave up. Thereafter, minor wave 2 may unfold lower.
Lower degree corrections should now find support at the lower edge of the base channel.
ALTERNATE DAILY CHART
Click chart to enlarge.
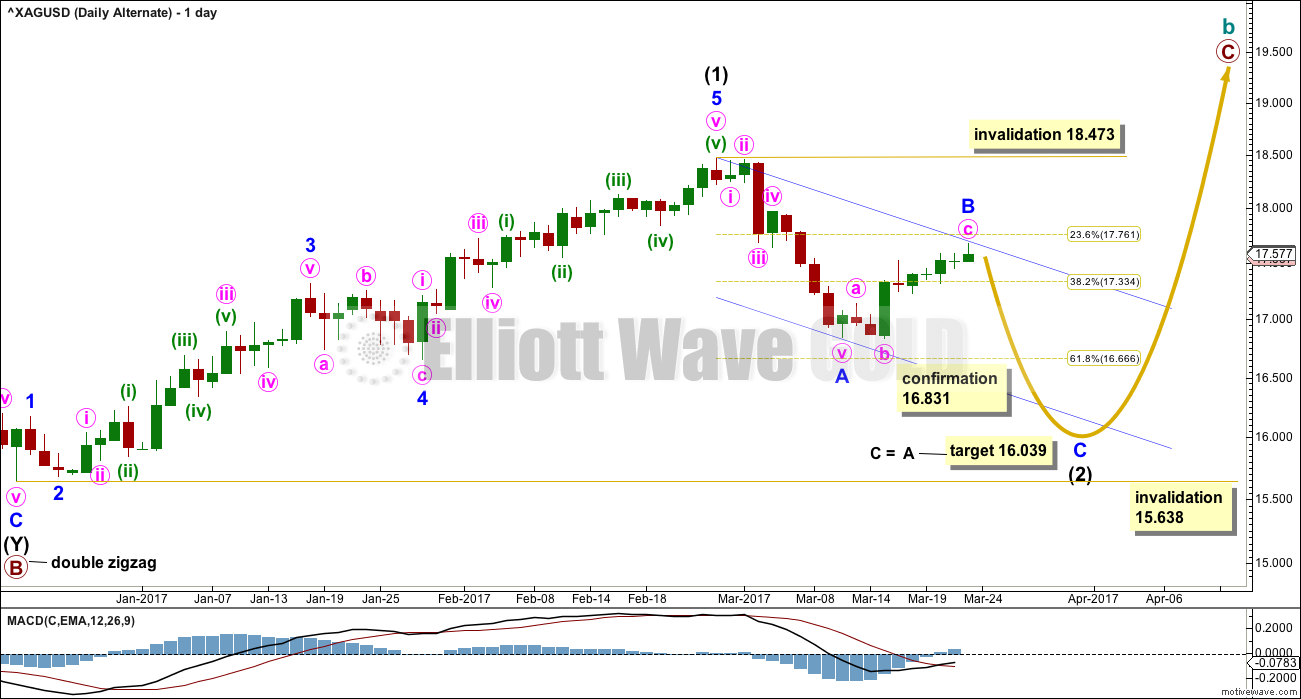
What if intermediate wave (2) is not over?
Minor wave A will fit as a five and minor wave B fits as a regular flat correction, which may be complete here or more likely needs one more high to complete the structure.
The target is recalculated this week for intermediate wave (2) to end. If minor wave B moves higher, then this target must also move correspondingly higher.
Intermediate wave (2) may not move beyond the start of intermediate wave (1) below 15.638.
TECHNICAL ANALYSIS
WEEKLY CHART
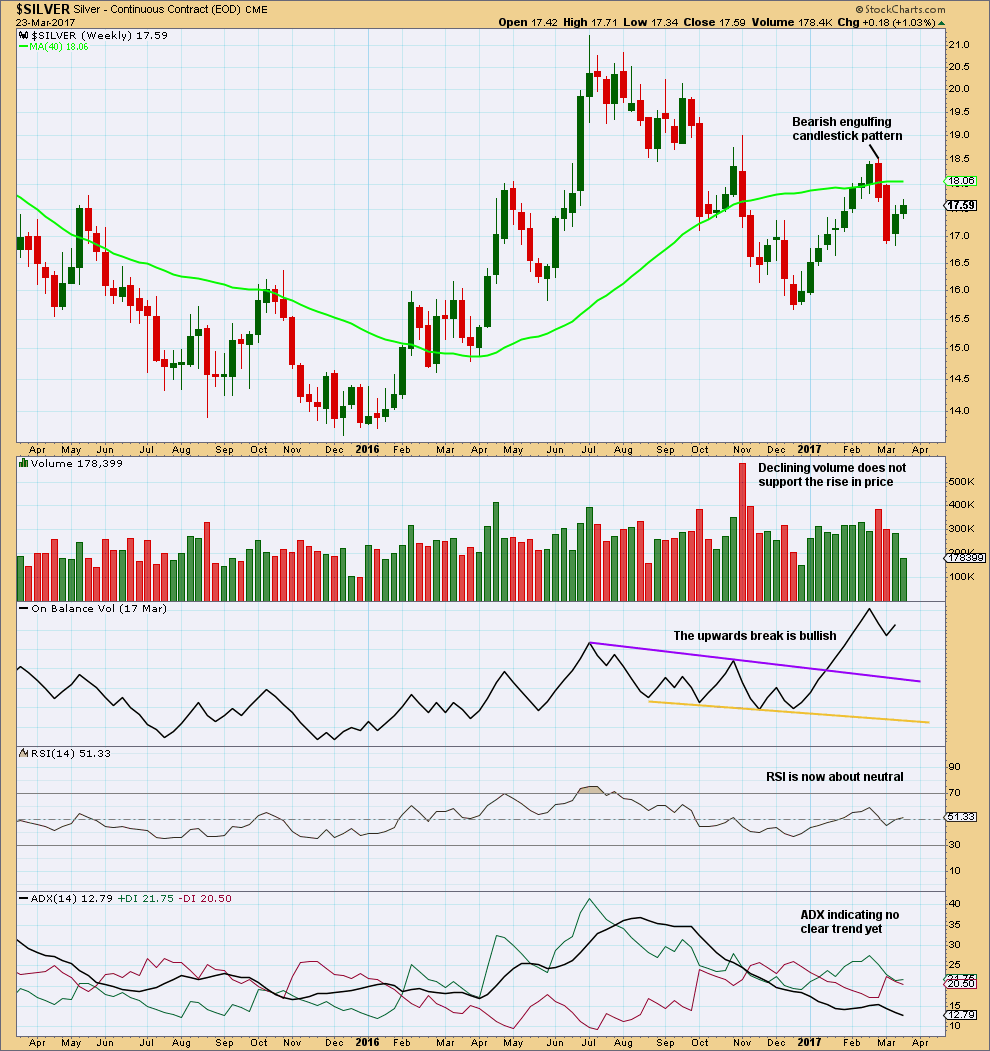
Click chart to enlarge. Chart courtesy of StockCharts.com.
Unless this current week ends with a very strong upwards day for Friday’s session, it looks like the range shall be smaller and the volume lighter than the prior upwards week. The rise in price is not being supported by volume, so this is concerning for bulls.
DAILY CHART
Click chart to enlarge. Chart courtesy of StockCharts.com.
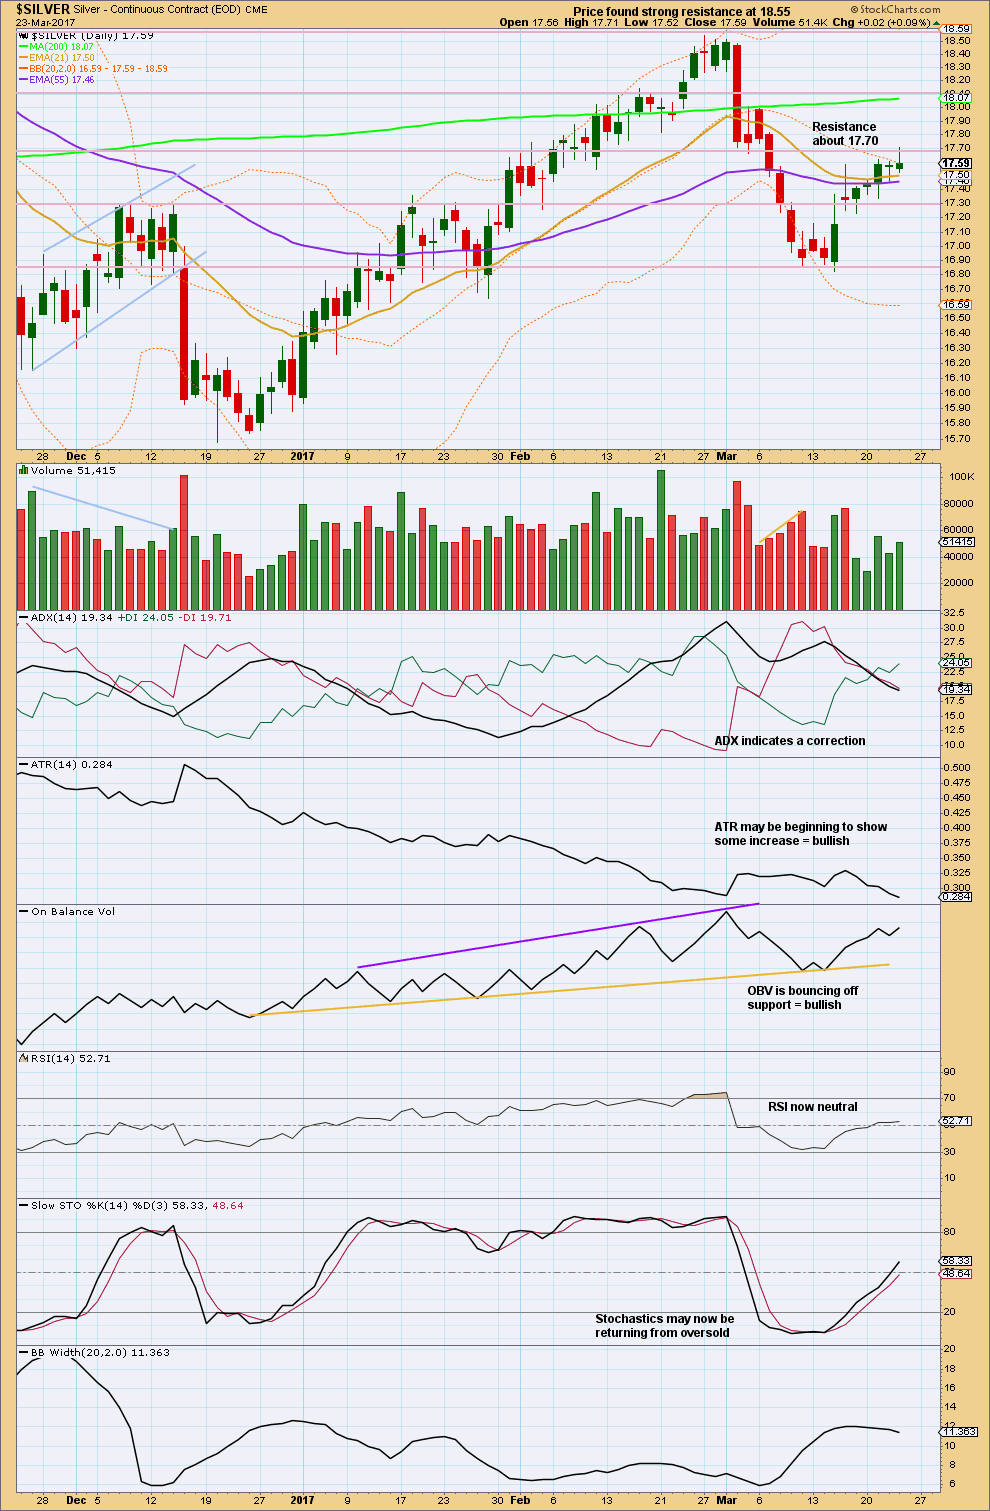
Price is finding strong resistance about 17.70. The long upper wick on the last daily candlestick is bearish for the short term. Coming after a Dragonfly doji candlestick, it looks like this upwards movement may be temporarily exhausted. Look out for a pullback here or very soon.
Within this week, there has been some increase in volume overall to offer some support to the rise in price.
ADX has indicated a potential trend change from down to up with a cross of the +DX line above the -DX line.
With RSI and Stochastics not yet overbought, there is room for price to continue higher here.
This analysis is published @ 12:22 a.m. EST on 24th March, 2017.
Lara, do you still see a pullback for silver soon? It seems to be continuing higher. Thanks