
Last week expected a pullback for Silver.
Price moved higher for three days. Thereafter, it has turned down strongly.
Summary: A deeper pullback has most likely begun. The target is about 16.666. A breach of the channel on the main daily chart would add confidence to this view. A new low below 17.317 would add further confidence. This pullback may total a Fibonacci 34 days.
Always follow my two Golden Rules:
1. Always use a stop on every trade.
2. Do not invest more than 1-5% of equity on any one trade.
New updates to this analysis are in bold.
Last monthly chart is here.
ELLIOTT WAVE COUNT
WEEKLY CHART
Click chart to enlarge.
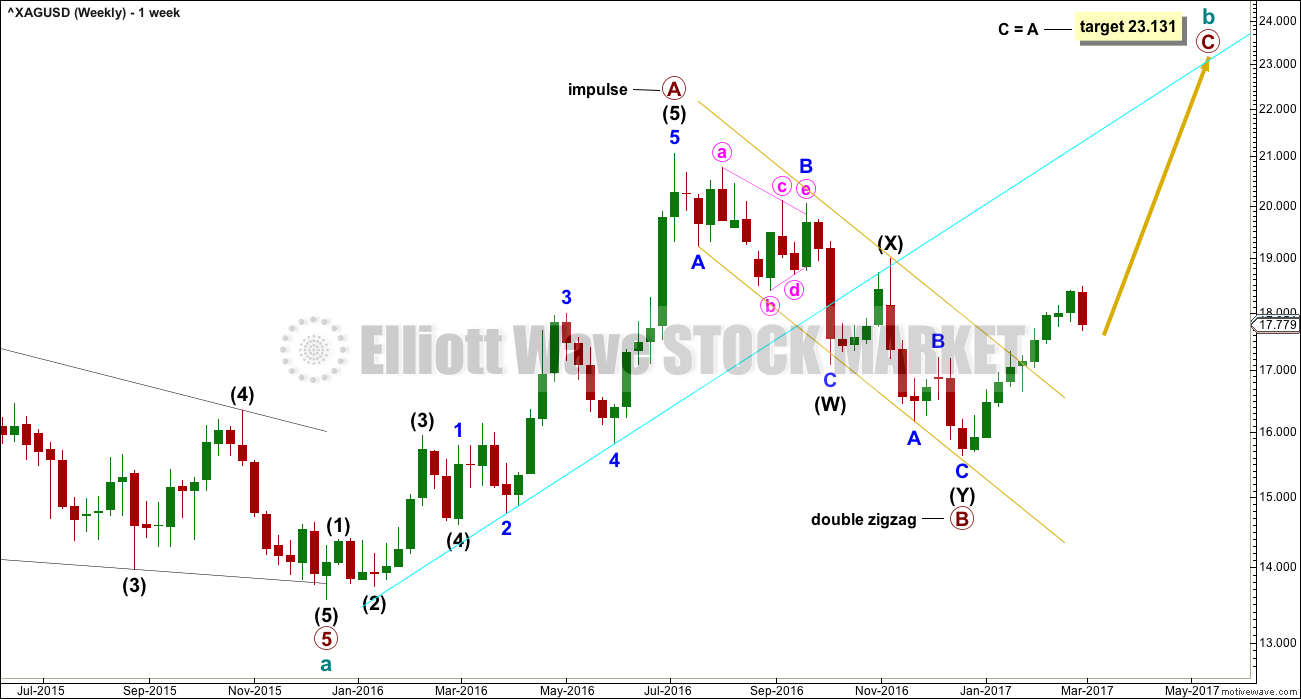
The analysis this week is simplified. This idea was an alternate at the weekly chart level, but it is now the main weekly chart because it has more common structures and less problems.
Upwards movement labelled primary wave A fits perfectly as an impulse.
Primary wave B fits as a deep double zigzag. Primary wave C must subdivide as a five wave structure. The target expects it to reach the most common Fibonacci ratio to primary wave A.
MAIN DAILY CHART
Click chart to enlarge.
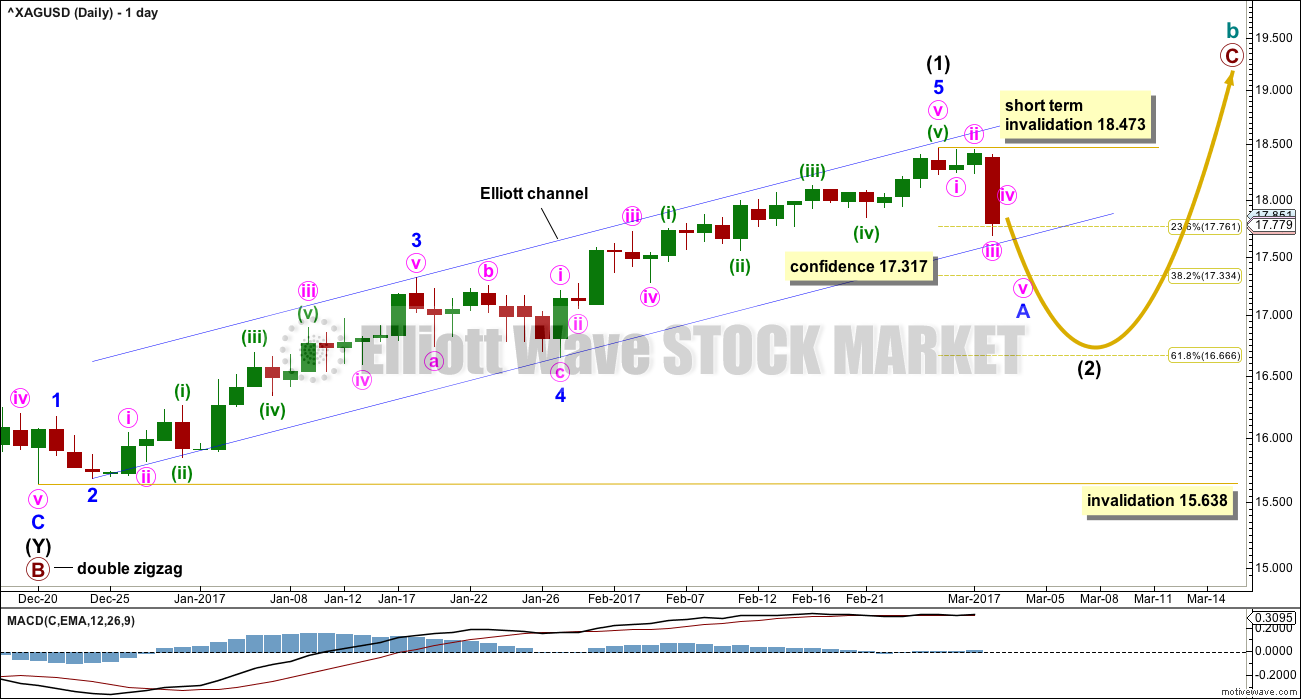
The degree of labelling within upwards movement is moved up one degree. Intermediate wave (1) may have just ended. The most likely point for intermediate wave (2) to end would be the 0.618 Fibonacci ratio of intermediate wave (1) about 16.666.
Intermediate wave (2) may be any corrective structure except a triangle. The first movement within it should be a five down, because this is a movement at intermediate degree.
The blue channel should be breached. If that happens, then more confidence may be had in this main wave count. In the first instance, with price almost at the lower edge, look for a small bounce there.
A new low below 17.317 would invalidate the alternate daily wave count below and provide confidence in this main wave count.
Intermediate wave (1) lasted 50 days, no Fibonacci duration. Intermediate wave (2) may reasonably be expected to last a Fibonacci 34 or 55 days in total.
ALTERNATE DAILY CHART
Click chart to enlarge.
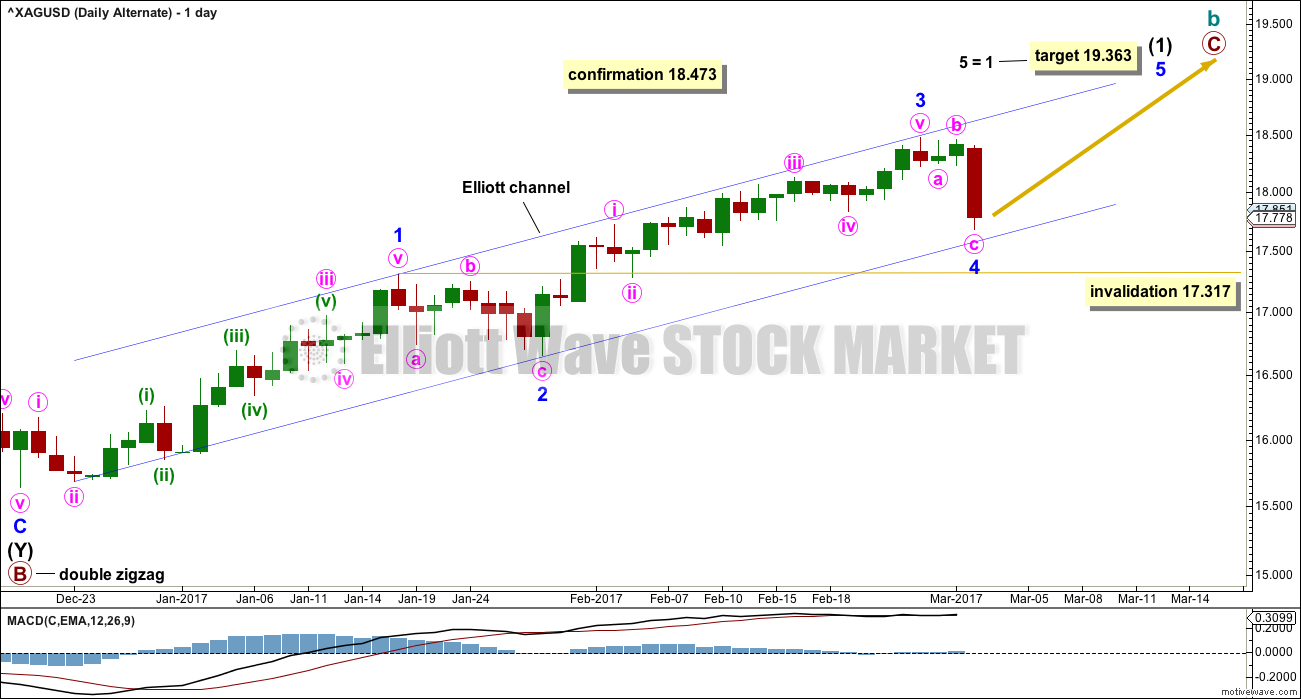
This alternate wave count sees intermediate wave (1) differently. It is possible that it is not over and needs a final fifth wave up to complete it.
Minor wave 4 may not move into minor wave 1 price territory below 17.317.
The target for minor wave 5 expects the most common Fibonacci ratio to minor wave 1.
If price continues lower here and breaches the lower edge of the blue Elliott channel, then the probability of this alternate would reduce further.
TECHNICAL ANALYSIS
WEEKLY CHART
Click chart to enlarge. Chart courtesy of StockCharts.com.
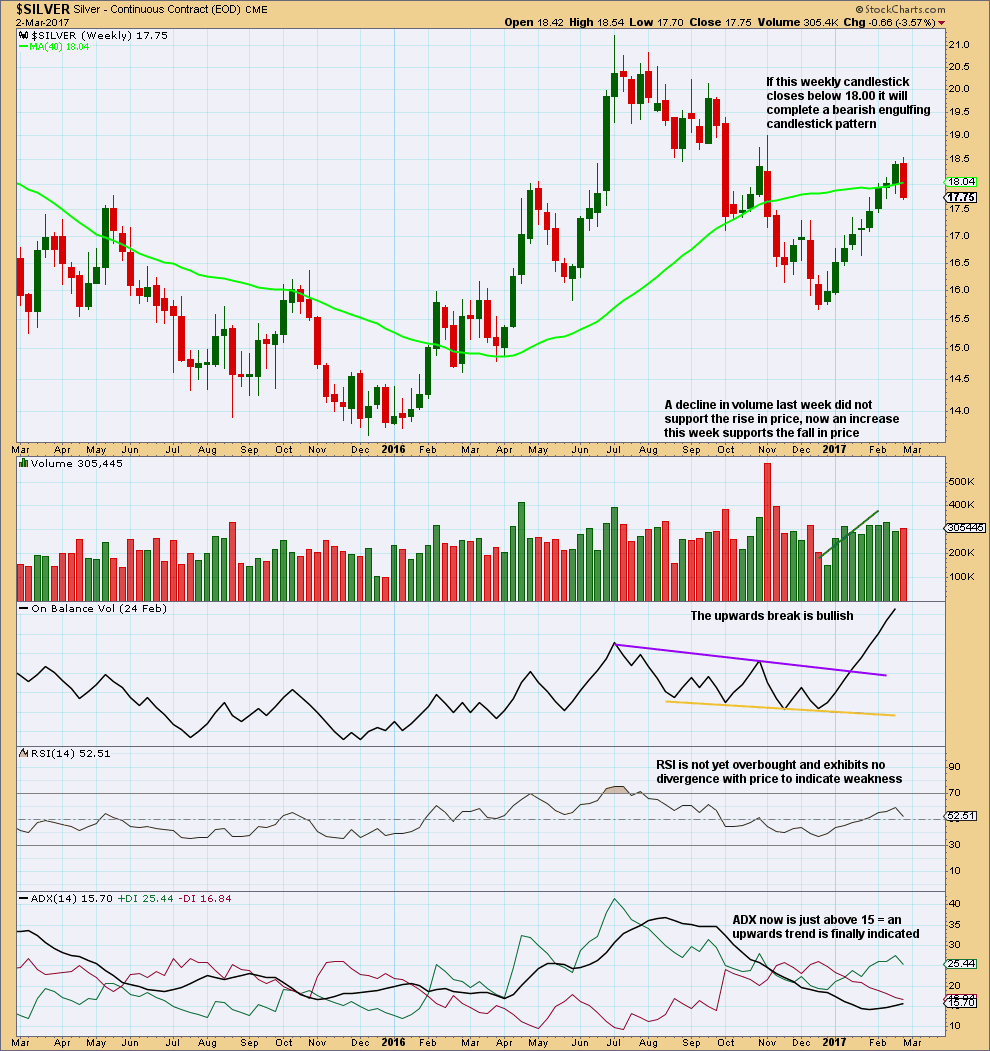
The longer term trend is still up. But if this weekly candlestick closes below 18, then it would signal an interruption to the trend. That would change the outlook from bullish to neutral at this stage.
DAILY CHART
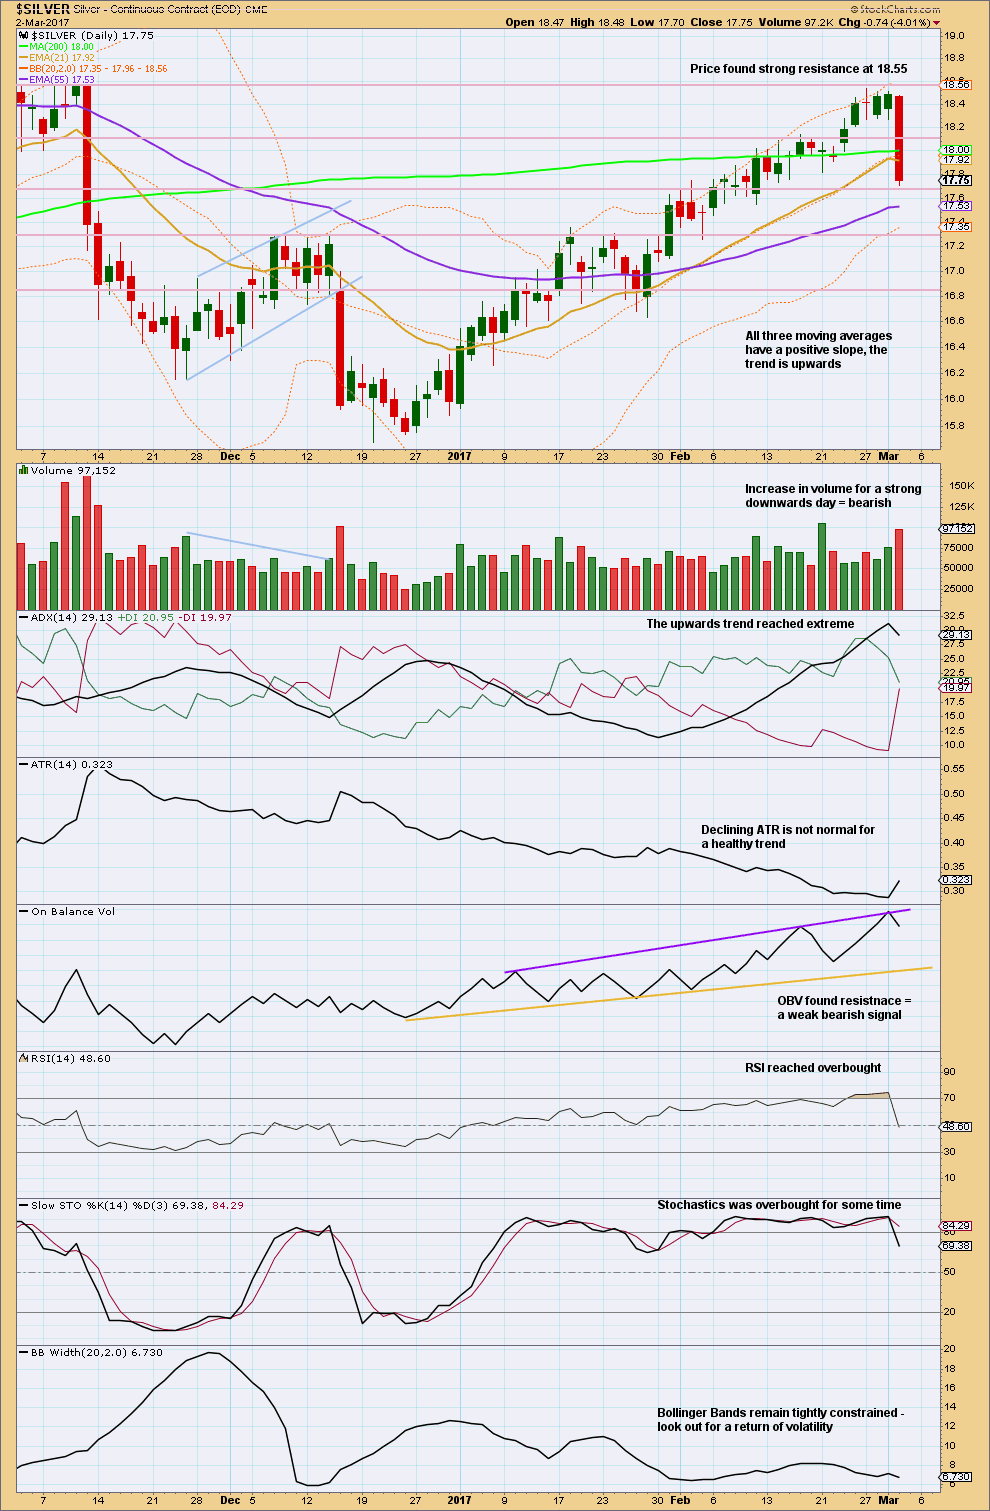
Click chart to enlarge. Chart courtesy of StockCharts.com.
There is support here about 17.70. Next support is about 17.30.
Today completes a very bearish engulfing candlestick pattern. This changes the short term outlook from up to neutral or down.
ADX reached extreme, so expect a pullback here.
On Balance Volume may now move lower to find support. Stochastics also may move lower to reach oversold, as may RSI.
There is room here for price to fall.
This analysis is published @ 10:21 p.m. EST.
Ted Butler has noted a new development in the arena of Silver traders. Most folk are aware that the two major players are the technical hedge funds and the big banks which take opposite sides of the trade of major price trends. Apparently there are some new players holding futures contracts in perpetuity. Their long term position has now grown to a remarkable 400 million ounces worth of contracts, and it it keeps growing. JPM is the only one of the big banks holding enough physical metal to cover their share of the roughly 800 million ounces worth of short contracts. It will be interesting to see at what point, considering the permanently corralled 400 ounces, the other banks feel compelled to buy back their short positions. Global production after all is only 100 million ounces annually!