
Last weekly analysis expected a violent downwards breakout as likely. This is exactly what happened.
Alternate wave counts are now invalidated.
Summary: The target for downwards movement to end is minimum 28.61, with 25.59 reasonably likely.
New updates to this analysis are in bold.
MONTHLY ELLIOTT WAVE COUNT
Click chart to enlarge.
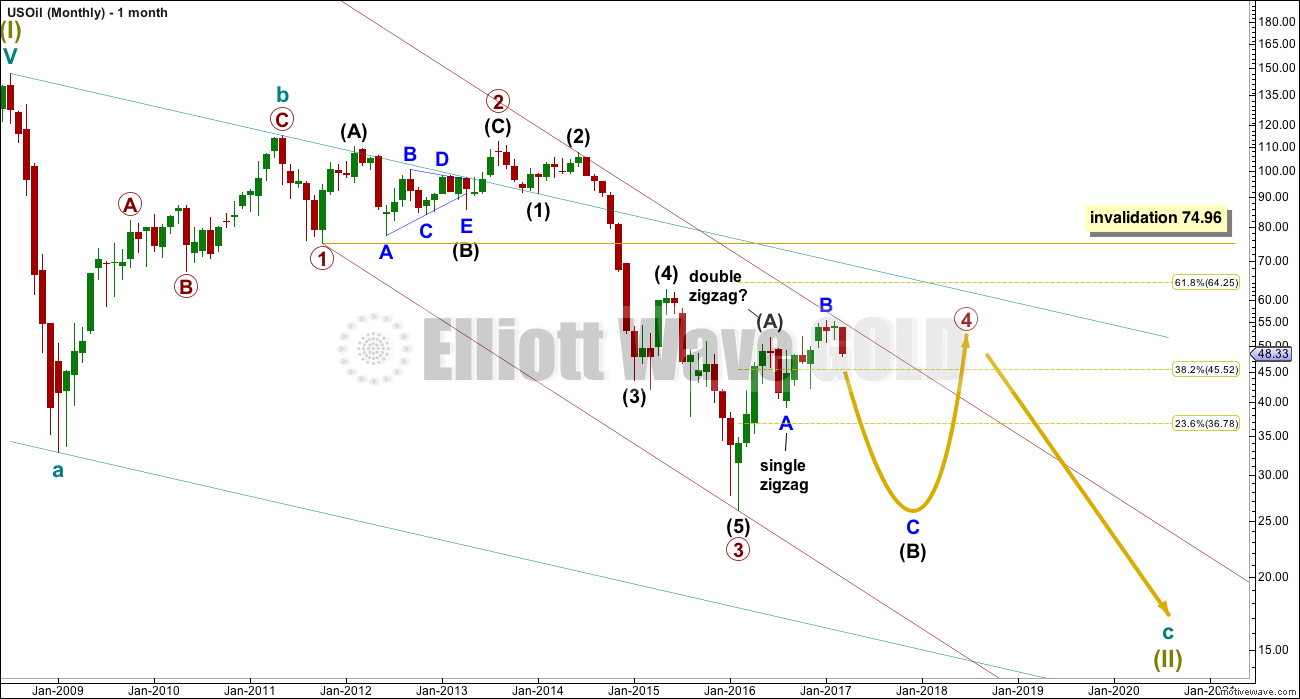
Within the bear market, cycle wave b is seen as ending in May 2011. Thereafter, a five wave structure downwards for cycle wave c begins.
Within cycle wave c, at this stage it does not look like primary wave 5 could be complete. That would only be possible if primary wave 4 was over too quickly.
Primary wave 1 is a short impulse lasting five months. Primary wave 2 is a very deep 0.94 zigzag lasting 22 months. Primary wave 3 is a complete impulse with no Fibonacci ratio to primary wave 1. It lasted 30 months.
Primary wave 4 is likely to exhibit alternation with primary wave 2. Primary wave 4 is most likely to be a flat, combination or triangle. Within all of these types of structures, the first movement subdivides as a three. The least likely structure for primary wave 4 is a zigzag.
Primary wave 4 is likely to end within the price territory of the fourth wave of one lesser degree; intermediate wave (4) has its range from 42.03 to 62.58.
If primary wave 4 is incomplete, then it looks like it may not remain contained within the channel. Sometimes fourth waves overshoot channels and this is why Elliott developed a second technique to redraw the channel when it does not contain a fourth wave.
Primary wave 4 is most likely to be shallow to exhibit alternation in depth with primary wave 2. So far it has passed the 0.382 Fibonacci ratio at 45.52. It may now continue to move mostly sideways in a large range.
Primary wave 4 may not move into primary wave 1 price territory above 74.96.
At this stage, primary wave 4 has completed intermediate wave (A) only. Intermediate wave (B) is incomplete.
WEEKLY ELLIOTT WAVE COUNT
Click chart to enlarge.
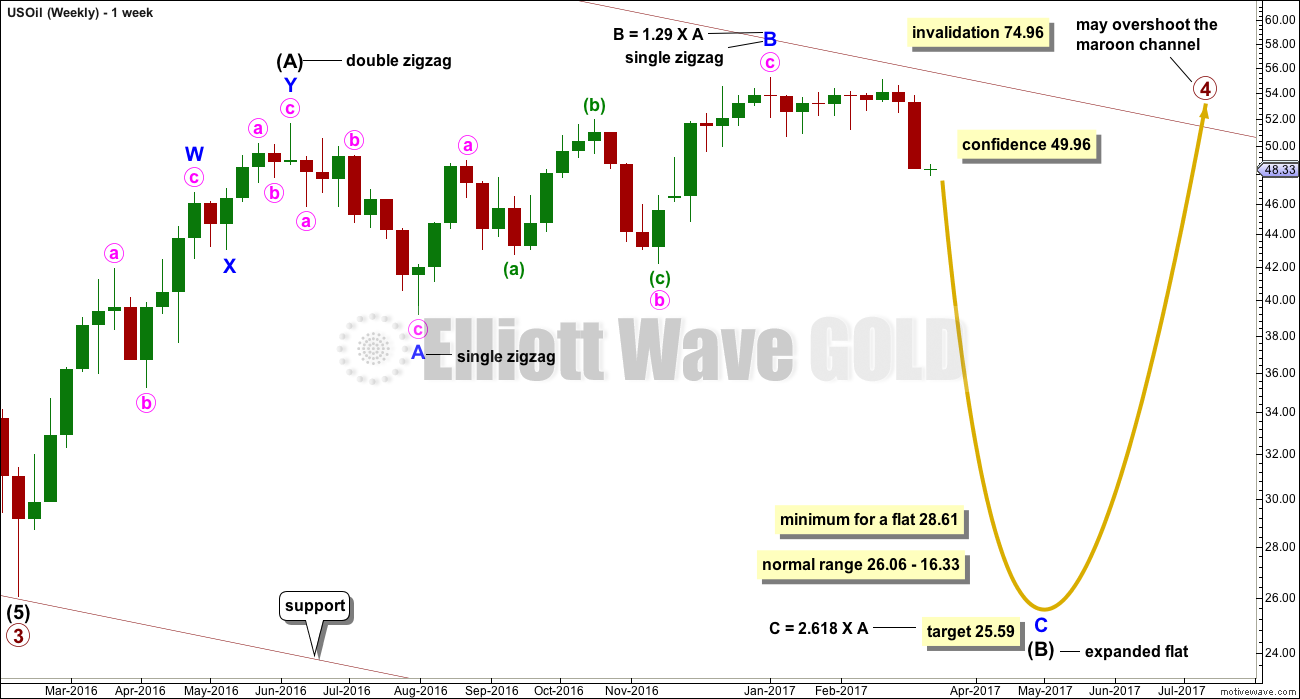
The whole structure of primary wave 4 is seen here in more detail.
The first wave labelled intermediate wave (A) is seen as a double zigzag, which is classified as a three.
Intermediate wave (B) is also a three. This means primary wave 4 is most likely unfolding as a flat correction if my analysis of intermediate wave (A) is correct. Flats are very common structures.
Intermediate wave (B) began with a zigzag downwards. This indicates it too is unfolding most likely as a flat correction.
Within intermediate wave (B), the zigzag upwards for minor wave B is a 1.29 correction of minor wave A. This indicates intermediate wave (B) may be unfolding as an expanded flat, the most common type.
The normal range for intermediate wave (B) within a flat correction for primary wave 4 is from 1 to 1.38 the length of intermediate wave (A) giving a range from 26.06 to 16.33.
Primary wave 4 may not move into primary wave 1 price territory above 74.96.
Within the larger expanded flat correction of primary wave 4, intermediate wave (B) must retrace a minimum 0.9 length of intermediate wave (A) at 28.61 or below.
DAILY ELLIOTT WAVE COUNT
Click chart to enlarge.
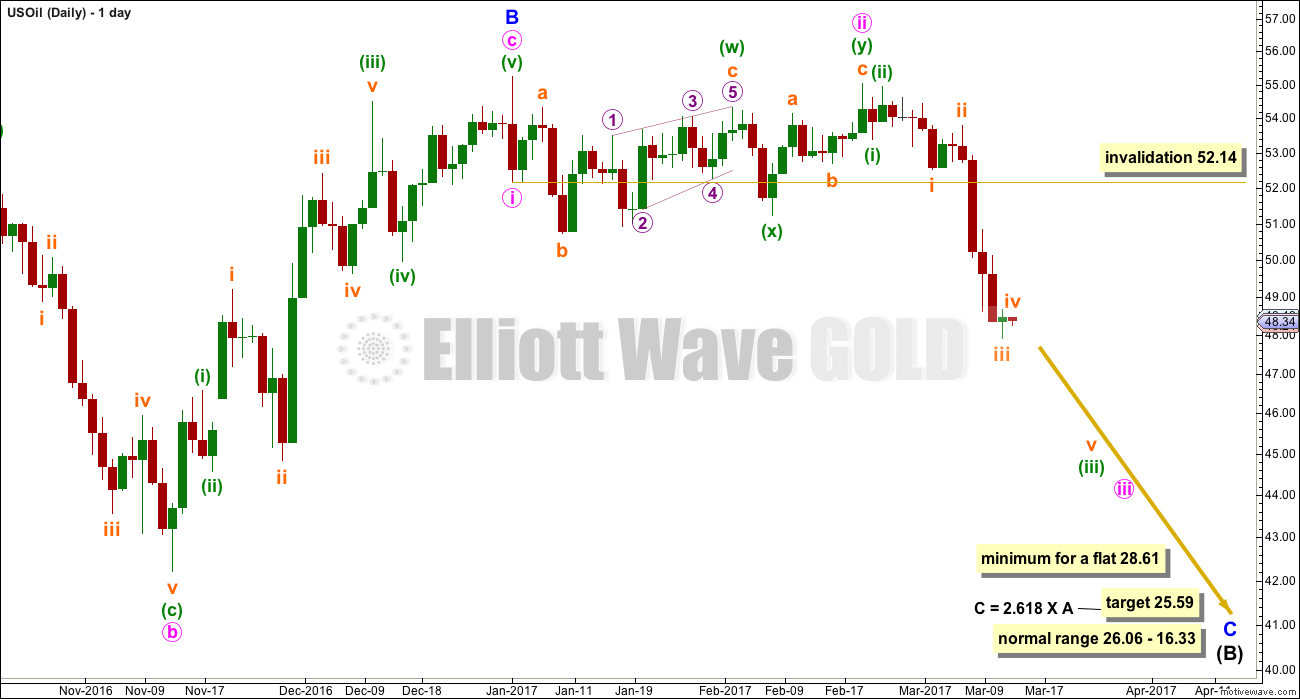
Minor wave C downwards must subdivide as a five wave structure.
Within minor wave C, minute wave iii now looks to have begun. A first possible target for it to end may be at 46.91 where it would reach 2.618 the length of minute wave i. If price keeps falling through this first target, then the next target may be at 41.90 where it would reach 4.236 the length of minute wave i.
Within minor wave C, minute wave i is not extended. This means that either or both of minute waves iii and v may be extended. For commodities it is very common for fifth waves to be strong extensions.
When minute wave iv arrives it should last at least two weeks. It is most likely to be a zigzag or triangle. It may not move into minute wave i price territory above 52.14.
TECHNICAL ANALYSIS
DAILY CHART
Click chart to enlarge. Chart courtesy of StockCharts.com.
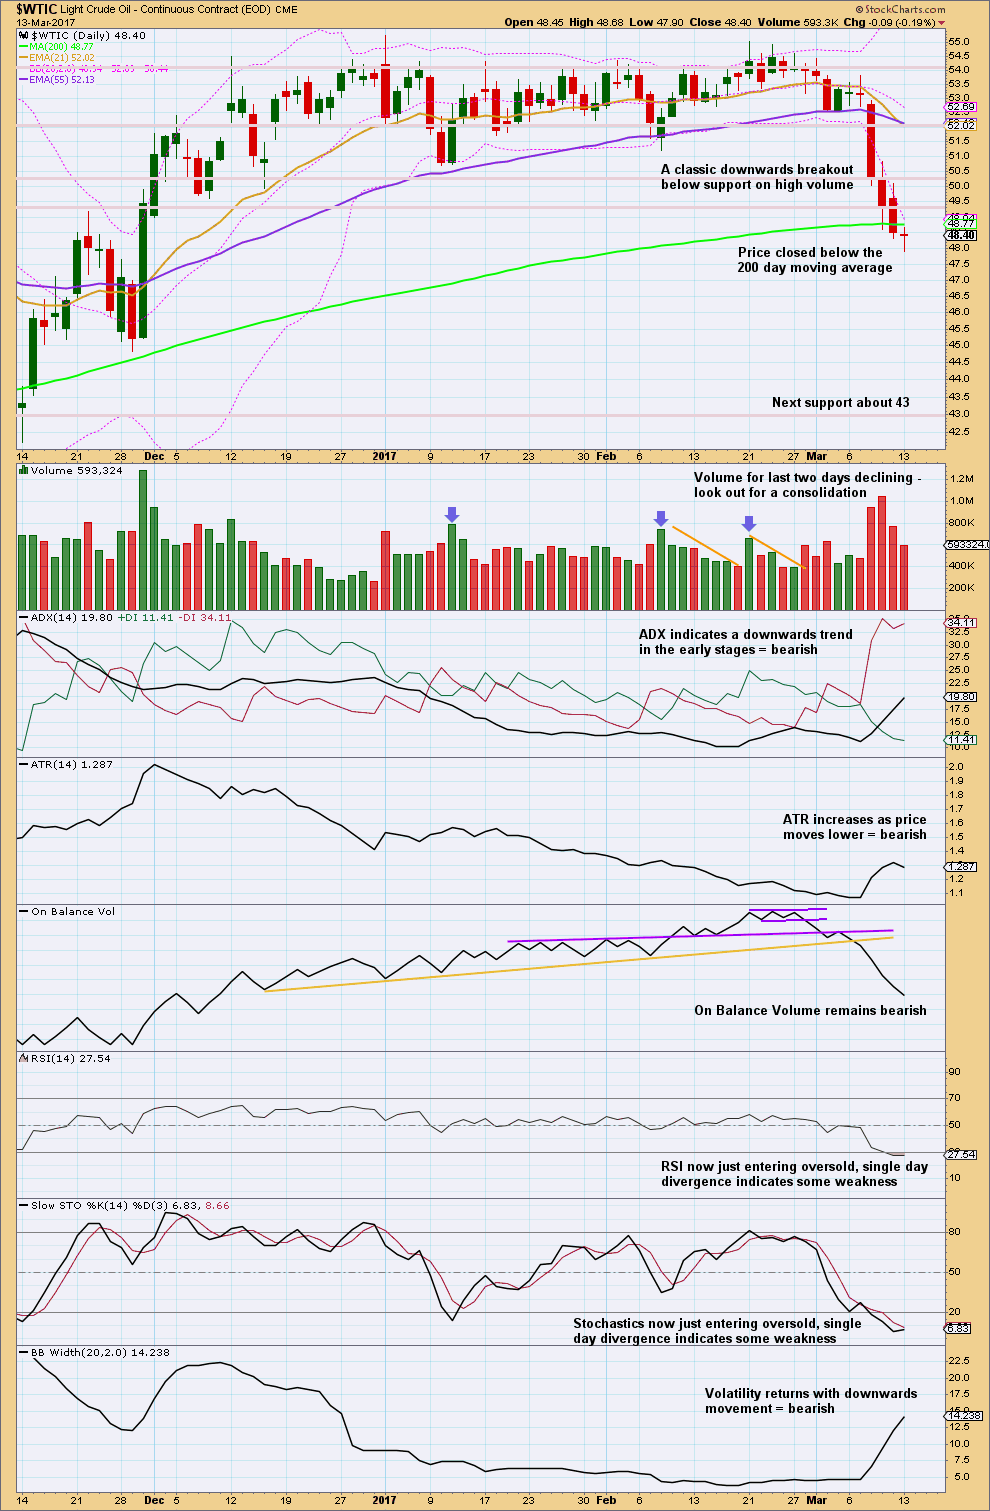
Price has closed two days in a row below the 200 day moving average. Today’s candlestick is a doji with a slightly longer lower wick than upper. This indicates some indecision, a balance of bulls and bears. A little caution here is advised. Oil may be about to enter into a small consolidation.
The last two days of downwards movement have declining volume, and this also indicates caution.
The trend is still young and On Balance Volume is still bearish.
Stochastics and RSI may remain extreme for reasonable periods of time when Oil trends. Extreme readings for these two indicators does not mean downwards movement must stop here but does indicate some caution. If price continues lower and these two then exhibit divergence, it would be a stronger bullish signal.
Members should now be holding profitable positions on US Oil after the downwards breakout. Corrections are an opportunity to join the trend. The trend is down.
If positions were opened within the prior consolidation, then they may be held until targets are reached or analysis shows the downwards movement is likely over, whichever comes first.
Short positions opened below 50.70 may possibly be taken out by a test of resistance at the lower edge of the prior consolidation zone. If Oil moves into a consolidation here, then consider taking profit on those positions.
Sometimes after a consolidation and breakout price curves back up to retest the edge of the prior consolidation, so be aware that if this happens because it could see profits evaporate.
Stops may be moved down to protect some profits. Ideally, stops may now be set about 50.71. Alternatively, a trailing stop may be used to protect profits.
As always remember my two Golden Rules for trading:
1. Always use a stop.
2. Never invest more than 1-5% of equity on any one trade.
VOLATILITY INDEX
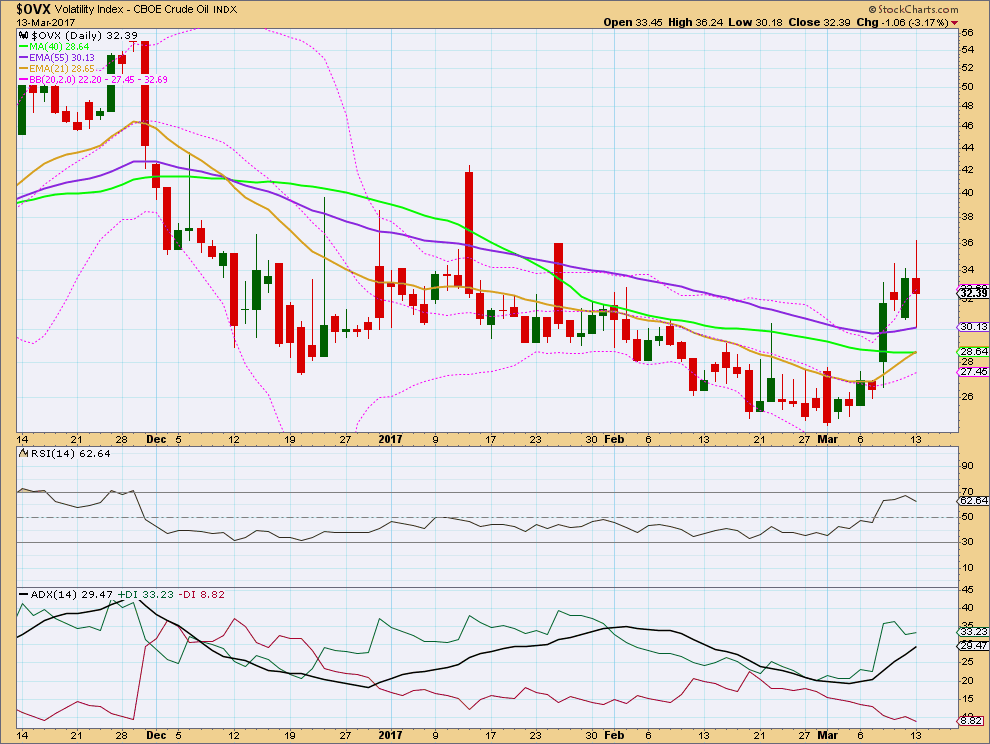
Click chart to enlarge. Chart courtesy of StockCharts.com.
Normally, volatility should decline as price rises and volatility should increase as price falls. Divergence from this normal can provide a bullish or bearish signal for Oil.
Price has made a new low strongly below the prior low of the 12th of January, but volatility has not made a corresponding new high. Volatility has not made a corresponding increase while price has declined substantially. This divergence is interpreted as bullish; it indicates some weakness within downwards movement from price.
Divergence between price and volatility signals traders to be cautious. It is possible Oil price may bounce to resolve this.
This analysis is published @ 11:38 p.m. EST.
Hi Lara,
so we are in a correction in Oil which might give us another opportunity to go short?
Anyone a calculation how high we go, are we going to 51 or just below I see a resitance line there.
Thanks
Ursula
I’m wondering the same thing, and it’s a difficult call to make. A 0.38 retracement from a high of 55 to low of 47 would make it at $50.
The 13 day MA is at 50.50 and 18 day MA is at 51.50. I think any accumulation above 50 (if we even get there) would be a nice set up for the next leg down.
We might not have much time as the next inventory release is Tuesday after market close by API followed by EIA release at 10:30 AM the very next day.
I’m hoping oil goes up Mon/Tue to re-open a short position… But if there is another withdrawal or only a small build in inventories, we could see it retest the 52.50 level.
Good luck 🙂
Looks like we maybe in a 3-3-5 correction of subminuette iv of minuette (iii); with wave A complete, currently in B, a 5 up for a C wave would be a good entry point for a short position.
Let’s see how this unfolds…