
The classic technical analysis picture has changed this week for US Oil. On Balance Volume is now giving a strong signal as to which direction price may break out.
Price has been consolidating now for about twelve weeks. There will be a breakout and it may come soon.
Summary: A new high above 55.24 would indicate an upwards breakout, and the target would be 57.22. A new low below 51.22 would indicate a downwards breakout, and the target would be 28.61, minimum, with a next target possibly at 25.59.
At this stage, it looks now like a downwards breakout is more likely. This should come soon. The longer price moves sideways in a consolidation, the more violent the breakout should be. Watch Oil closely daily now for the breakout.
New updates to this analysis are in bold.
MONTHLY ELLIOTT WAVE COUNT
Click chart to enlarge.
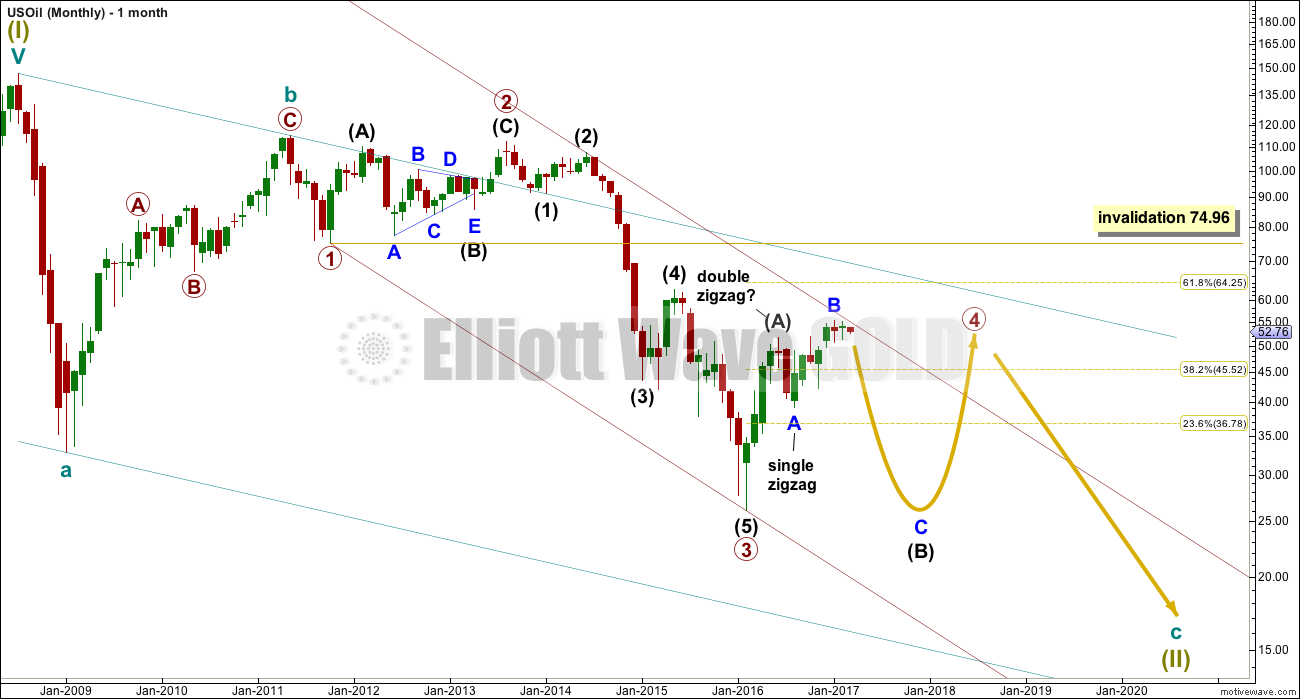
Within the bear market, cycle wave b is seen as ending in May 2011. Thereafter, a five wave structure downwards for cycle wave c begins.
Within cycle wave c, at this stage it does not look like primary wave 5 could be complete. That would only be possible if primary wave 4 was over too quickly.
Primary wave 1 is a short impulse lasting five months. Primary wave 2 is a very deep 0.94 zigzag lasting 22 months. Primary wave 3 is a complete impulse with no Fibonacci ratio to primary wave 1. It lasted 30 months.
Primary wave 4 is likely to exhibit alternation with primary wave 2. Primary wave 4 is most likely to be a flat, combination or triangle. Within all of these types of structures, the first movement subdivides as a three. The least likely structure for primary wave 4 is a zigzag.
Primary wave 4 is likely to end within the price territory of the fourth wave of one lesser degree; intermediate wave (4) has its range from 42.03 to 62.58.
If primary wave 4 is incomplete, then it looks like it may not remain contained within the channel. Sometimes fourth waves overshoot channels and this is why Elliott developed a second technique to redraw the channel when it does not contain a fourth wave.
Primary wave 4 is most likely to be shallow to exhibit alternation in depth with primary wave 2. So far it has passed the 0.382 Fibonacci ratio at 45.52. It may now continue to move mostly sideways in a large range.
Primary wave 4 may not move into primary wave 1 price territory above 74.96.
At this stage, primary wave 4 has completed intermediate wave (A) only. Intermediate wave (B) is incomplete.
WEEKLY ELLIOTT WAVE COUNT
Click chart to enlarge.
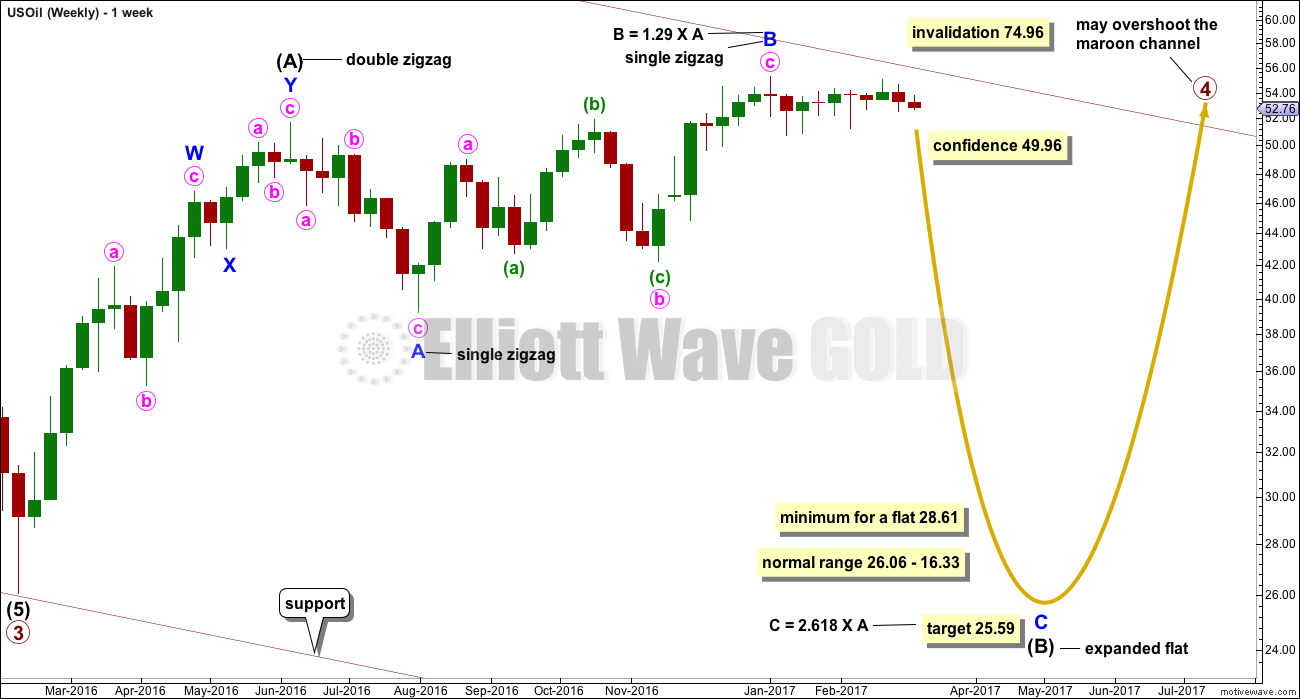
The whole structure of primary wave 4 is seen here in more detail.
The first wave labelled intermediate wave (A) is seen as a double zigzag, which is classified as a three.
Intermediate wave (B) is also a three. This means primary wave 4 is most likely unfolding as a flat correction if my analysis of intermediate wave (A) is correct. Flats are very common structures.
Intermediate wave (B) began with a zigzag downwards. This indicates it too is unfolding most likely as a flat correction.
Within intermediate wave (B), the zigzag upwards for minor wave B is a 1.29 correction of minor wave A. This indicates intermediate wave (B) may be unfolding as an expanded flat, the most common type.
The normal range for intermediate wave (B) within a flat correction for primary wave 4 is from 1 to 1.38 the length of intermediate wave (A) giving a range from 26.06 to 16.33.
Primary wave 4 may not move into primary wave 1 price territory above 74.96.
Within the larger expanded flat correction of primary wave 4, intermediate wave (B) must retrace a minimum 0.9 length of intermediate wave (A) at 28.61 or below.
DAILY ELLIOTT WAVE COUNT
Click chart to enlarge.
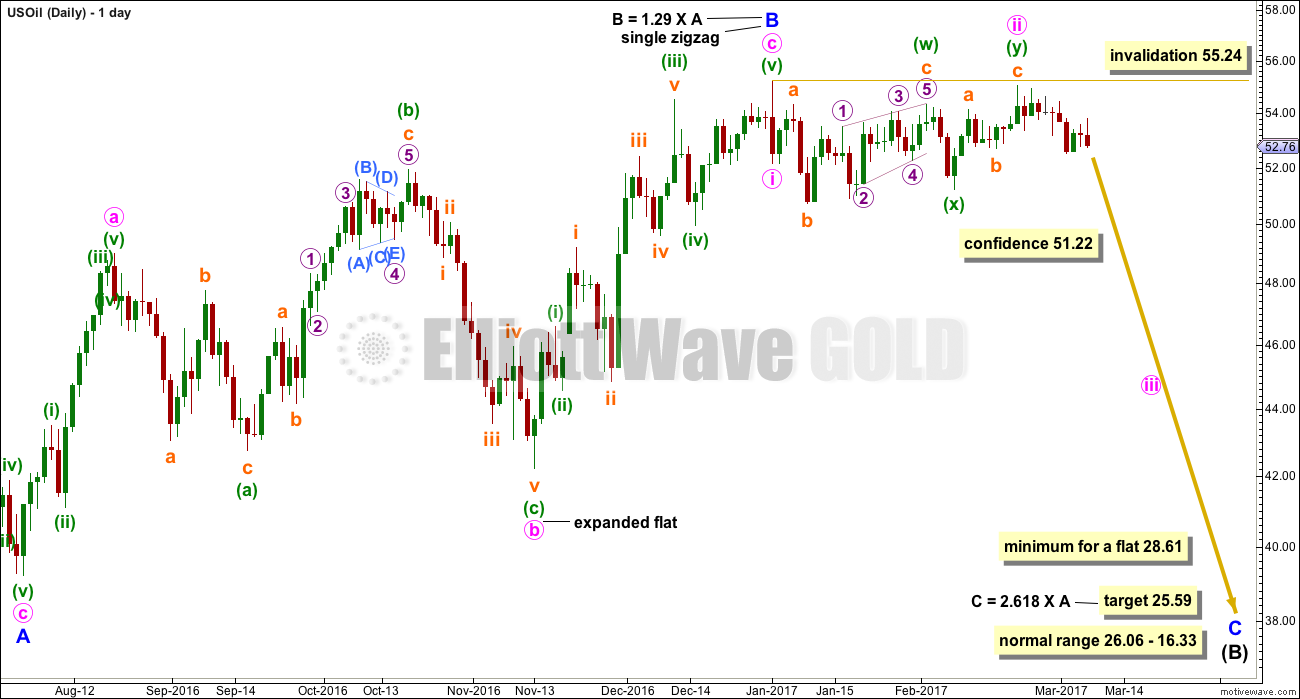
Minor wave B is seen in this main wave count as a complete single zigzag. The upwards wave labelled minute wave a is seen as a five wave impulse.
Minor wave C downwards should have begun. Within minor wave C, minute wave ii may not move beyond the start of minute wave i above 55.24.
Minor wave C downwards must subdivide as a five wave structure.
Minute wave ii is relabelled as a combination: expanded flat – X – zigzag. Combinations are common structures.
A new low below 51.22 would invalidate the alternate wave count below and provide some confidence in this main wave count.
ALTERNATE DAILY ELLIOTT WAVE COUNT
Click chart to enlarge.
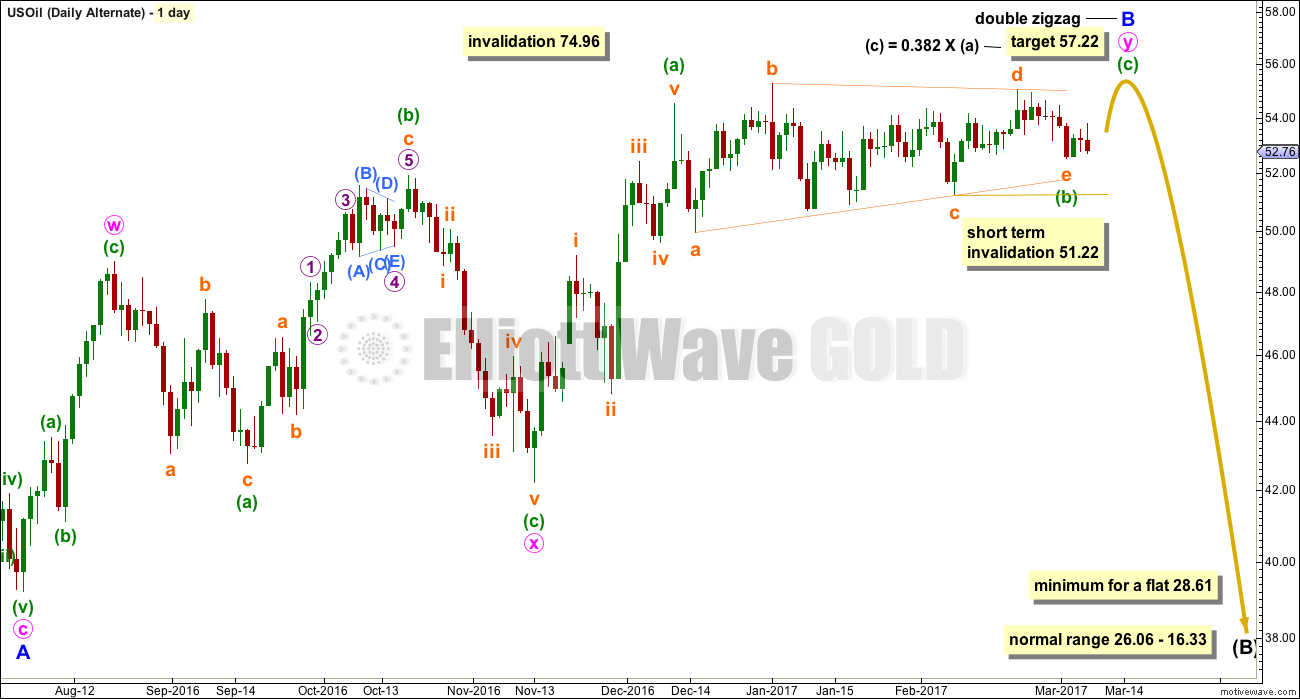
Minor wave B is seen as an incomplete double zigzag. The first wave up labelled minute wave w is seen as a zigzag. This is the main difference between the two wave counts.
Minute wave y must subdivide as a zigzag. Sideways movement over the last few weeks may be a triangle within it for minuette wave (b). This wave count is adjusted slightly this week. The triangle may have continued further.
Minuette wave (c) would be very likely to make at least a slight new high above the end of minuette wave (a) at 54.50 to avoid a truncation.
The normal range for minor wave B within the larger flat correction of intermediate wave (B) is from 1 to 1.38 the length of minor wave A, giving a range from 51.67 to 56.41. The target for minuette wave (c) is this week recalculated to be not too much further than the normal range.
In the short term, within the triangle, subminuette wave e may not move beyond the end of subminuette wave c below 51.22. The invalidation point for this alternate does not change this week.
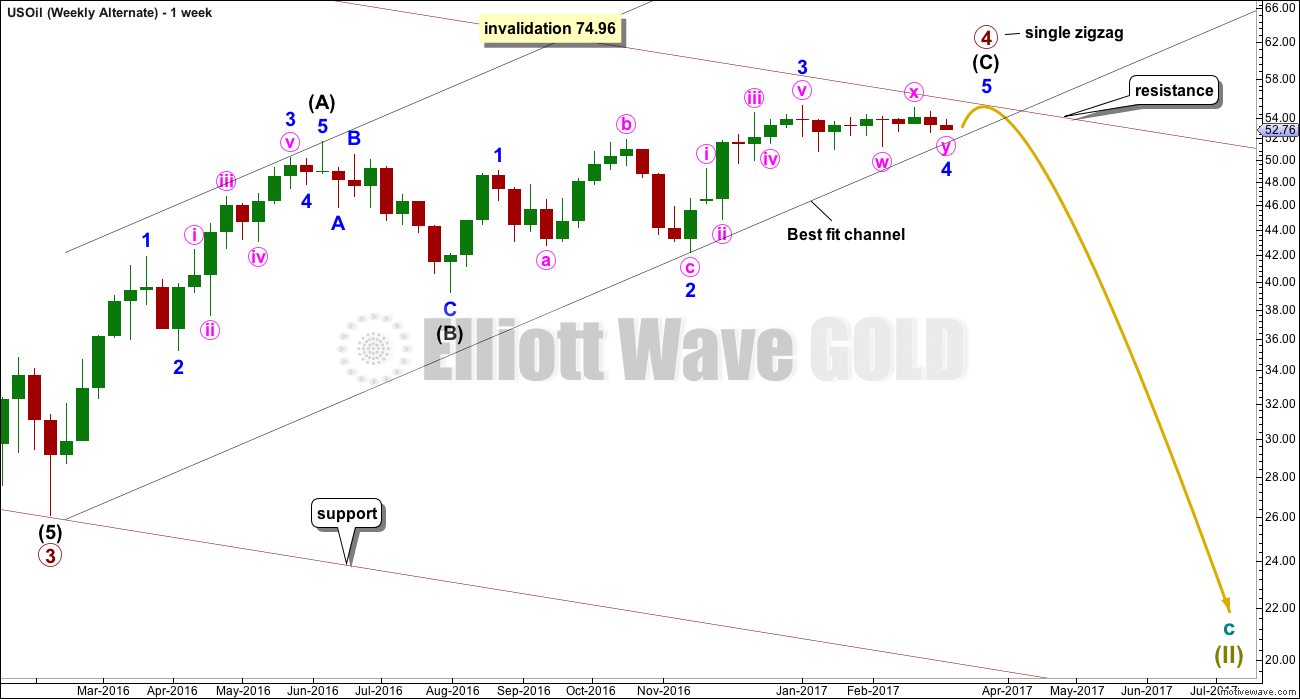
ALTERNATE WEEKLY ELLIOTT WAVE COUNT
Click chart to enlarge.
The upper edge of the maroon channel, copied over from the monthly chart, may provide strong resistance. An upwards breakout may be short lived.
Primary wave 4 may be very close to completion. This wave count is an alternate because it sees no alternation between the structures of primary waves 2 and 4; they are both zigzags.
However, there is alternation within the zigzags: intermediate wave (B) was a very time consuming triangle within primary wave 2 zigzag and intermediate wave (B) may have been a brief zigzag within primary wave 4 zigzag. This gives primary waves 2 and 4 overall different looks.
Also, there is alternation in depth: primary wave 2 at 0.93 was very deep and so far primary wave 4 is just 0.34, so it is shallow.
A final fifth wave may be all that is required to complete the structure at primary degree.
TECHNICAL ANALYSIS
DAILY CHART
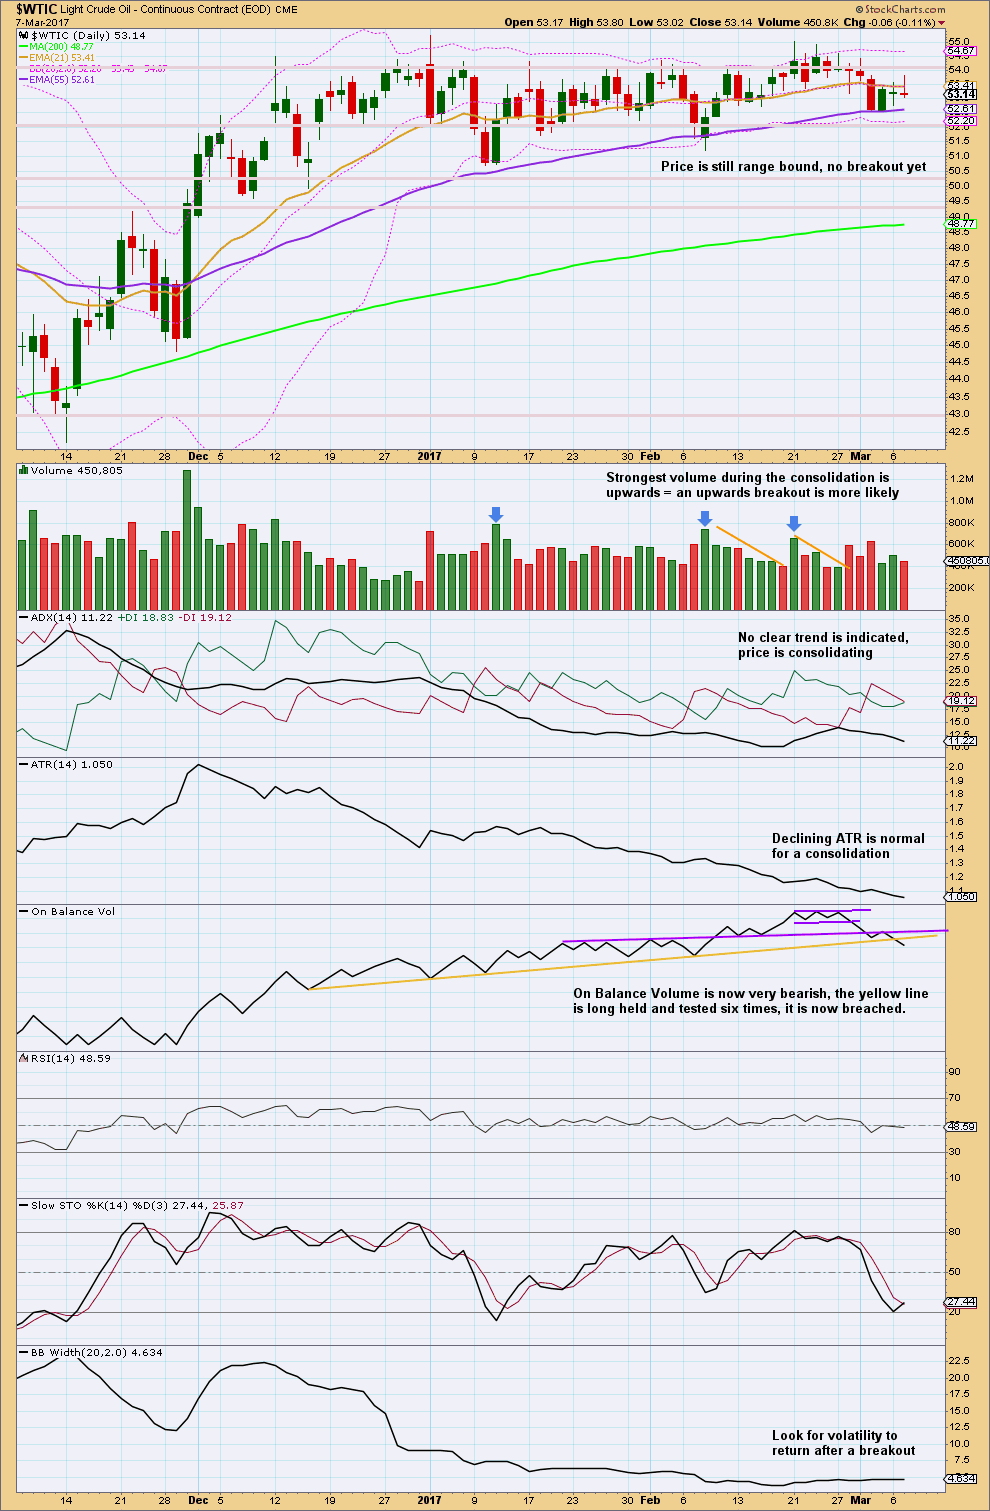
Click chart to enlarge. Chart courtesy of StockCharts.com.
Oil is still range bound. Resistance is about 55.00 to 55.20. Support is about 51.2 to 50.7.
The longer this consolidation continues, the closer and more violent the breakout may be.
A classic breakout is a day that closes comfortably above resistance or below support, preferably with strong volume. Strong volume is more important for a reliable upwards breakout than downwards.
One possible approach to this market at this time may be to open a hedge where stops for each direction may be set just below support and just above resistance. Upon a breakout the losing direction should be automatically closed and the winning position held until the target is met. For the long side (the Elliott wave targets may be too close), a measured rule would add the width of the consolidation to the breakout point, so allow for a movement of about 4 to 4.05 above the breakout point.
This week On Balance Volume gives a strong bearish signal. The yellow trend line is long held, not too steep, and has been tested five times. A break below support of this line by OBV should be taken very seriously and this will be given more weight than volume during upwards days. The breakout now looks more likely to be downwards.
Another option which should be taken by less experienced members would be to sit aside and join the trend after price breaks out. Trading consolidating markets is best left to experienced professionals only.
Always remember my two Golden Rules:
1. Always use a stop.
2. Never invest more than 1-5% of equity on any one trade.
VOLATILITY INDEX
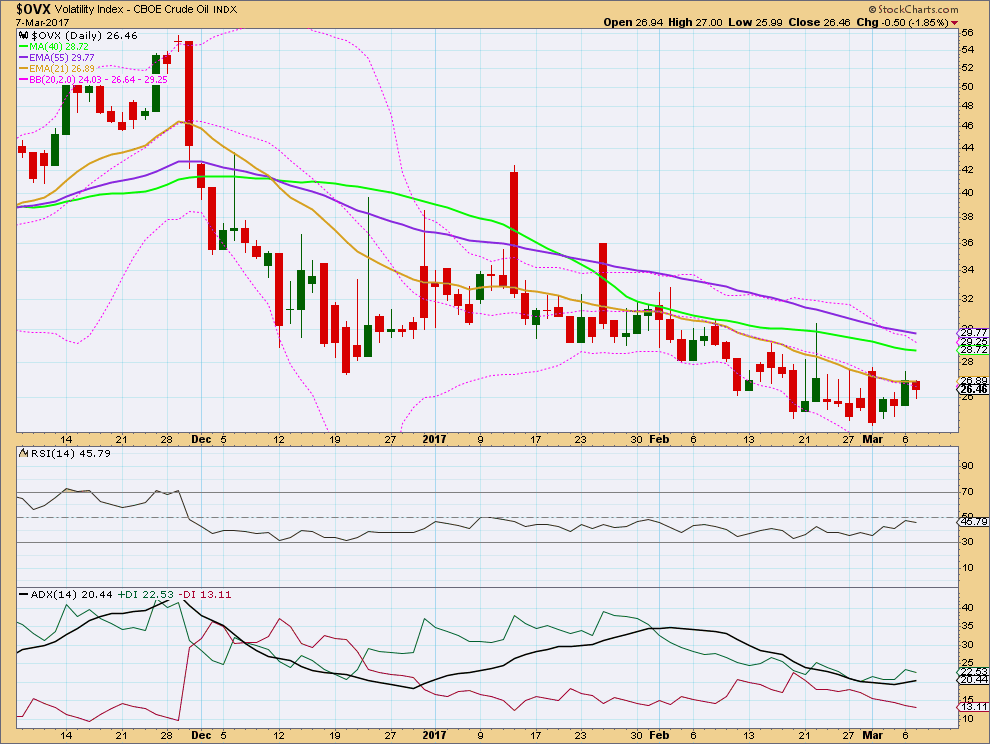
Click chart to enlarge. Chart courtesy of StockCharts.com.
Normally, volatility should decline as price rises and volatility should increase as price falls. Divergence from this normal can provide a bullish or bearish signal for Oil.
Price is still moving sideways and volatility is slightly increasing. While volatility has made new lows for the 1st of March, price has made a lower high. Although volatility declined to a new low on the 1st of March, it was not matched by a corresponding increase in price. This divergence indicates weakness in price and is bearish. This supports the Elliott wave counts and classic analysis, which now expect a downwards breakout for oil.
This analysis is published @ 06:12 p.m. EST.
Great Elliott analysis, as usual Lara. Will you consider adding natural gas to this weekly oil update? It’s traded by many of the same traders that also trade oil. Thanks
Oil COT article
http://www.mcoscillator.com/learning_center/weekly_chart/huge_imbalance_in_crude_oil_positions/
Given that today oil will close under its BB for 3rd straight session and RSI way oversold at 25, I closed 80% of my short position.
Waiting for a small bounce on next Monday/Tuesday to short again… but a legitimate bounce may not come as the force of this wave down may be overwhelming.
Anyone else has a strategy to trade this?
I am in for a modest position. Looks like it’s making a beeline for the weekly trendline – will add more on the bounce or a convincing break.
It is a lot of confirmation for one day and enough for the daily ! Let see the rest of todays session …
Lara, for my future reference, when you say, “A new low below 51.22 would indicate a downwards breakout, and the target would be 28.61, minimum, with a next target possibly at 25.59.”, would the new low be at any time intra-day (like right now at 51.04), or, does this only apply to closing prices?
Thanks for the great research!
Any amount at any time frame for the EW count is confirmation / confidence.
For a classic breakout it should be a close.
So it’s up to you; will you have confidence in the EW price points / wave counts or would you rather wait for the classic breakout, it depends on your risk appetite.
Sorry, not a clear cut answer is it.
Thanks! The first sentence was exactly what I was looking for. I’m very junior to EW. Only enough experience with it the last couple of years to realize it has merit, and it would, most likely, benefit me to start learning more about. I’m also starting to realize that there are times that classical analysis is more accurate, and at other times, with the same instrument, EW analysis is more reliable…and then other methods at other times. The real challenge to me is going to be figuring out which environments favor which techniques and being able to identify when the environments are changing. Then again…I may still be trying to figure these out 40 years from now. Thanks again!
Hi Mark
” The real challenge to me is going to be figuring out which environments favor which techniques and being able to identify when the environments are changing”.
You nailed the challenge for us all there. In my case 17 years and counting. I would recommend that you develop your own system that you can have some confidence in without the assistance of any professional help. That, of course, is not easy, and you will burn a lot of midnight oil in the process with many disappointments along the way. However, once you have it, that is your grounding and the high quality inputs of Lara and possibly others will enhance the quality of your judgements if you use them correctly.
Thanks Lara for this timely analysis…
It’s been a loooong wait for this break out downwards. The commercial net short position is at its all time high, so this also gives some more weight to the down ward break out…
Excellent *rubs hands together*
I’m looking forward to Oil to start trending again. It’s a great market to trade when it trends!
Boom! Here we go Lara. Can’t wait for this to bounce back a little and take the ride down…