
The breakout from a consolidation zone has still not happened. The longer price coils between support and resistance, the more violent the breakout will be.
Summary: On Balance Volume at the daily and possibly also weekly chart levels gives bullish signals for Gold. This should be given reasonable weight. The main wave count is still favoured for this reason. It expects upwards movement towards 1,333 in the first instance, with the next target at 1,392.
If price breaks below 1,247.40, then a new alternate may be unfolding. It expects downwards movement to end about 1,237 to 1,235 on Thursday.
With the low today possibly taking out some long positions, new trading advice is given today under the classic Technical Analysis section.
New updates to this analysis are in bold.
Last weekly charts are here and the last video on weekly wave counts is here.
Grand SuperCycle analysis is here.
MAIN ELLIOTT WAVE COUNT
DAILY CHART

Click chart to enlarge.
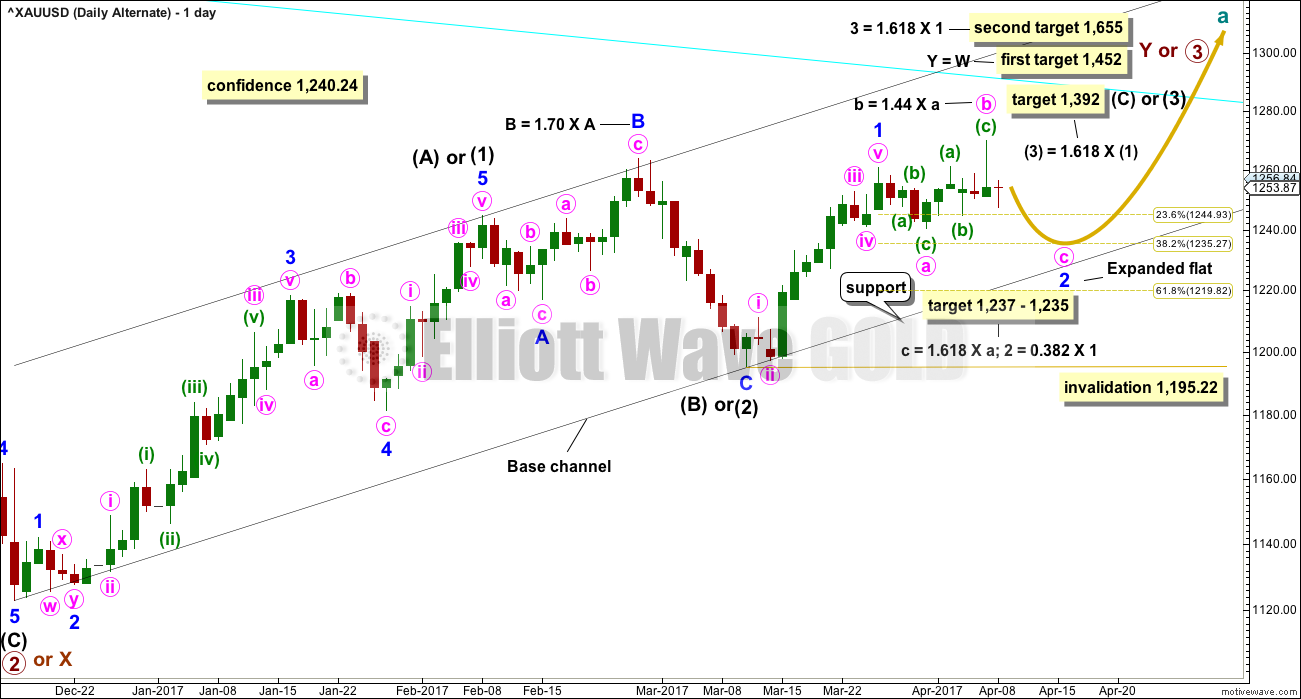
This daily chart will suffice for both weekly charts.
Upwards movement at primary degree is either a third wave (first weekly chart) to unfold as an impulse, or a Y wave (second weekly chart) to unfold as a zigzag. If upwards movement is a zigzag for primary wave Y, then it would be labelled intermediate waves (A) – (B) and now (C) to unfold.
Intermediate wave (1) or (A) is a complete five wave impulse lasting 39 days. Intermediate wave (2) or (B) looks like an expanded flat, which is a very common structure.
So far, within intermediate wave (3) or (C), the first wave up for minor wave 1 looks complete.
If minor wave 2 is over, then within minor wave 3 no second wave correction may move beyond the start of its first wave below 1,240.24.
HOURLY CHART
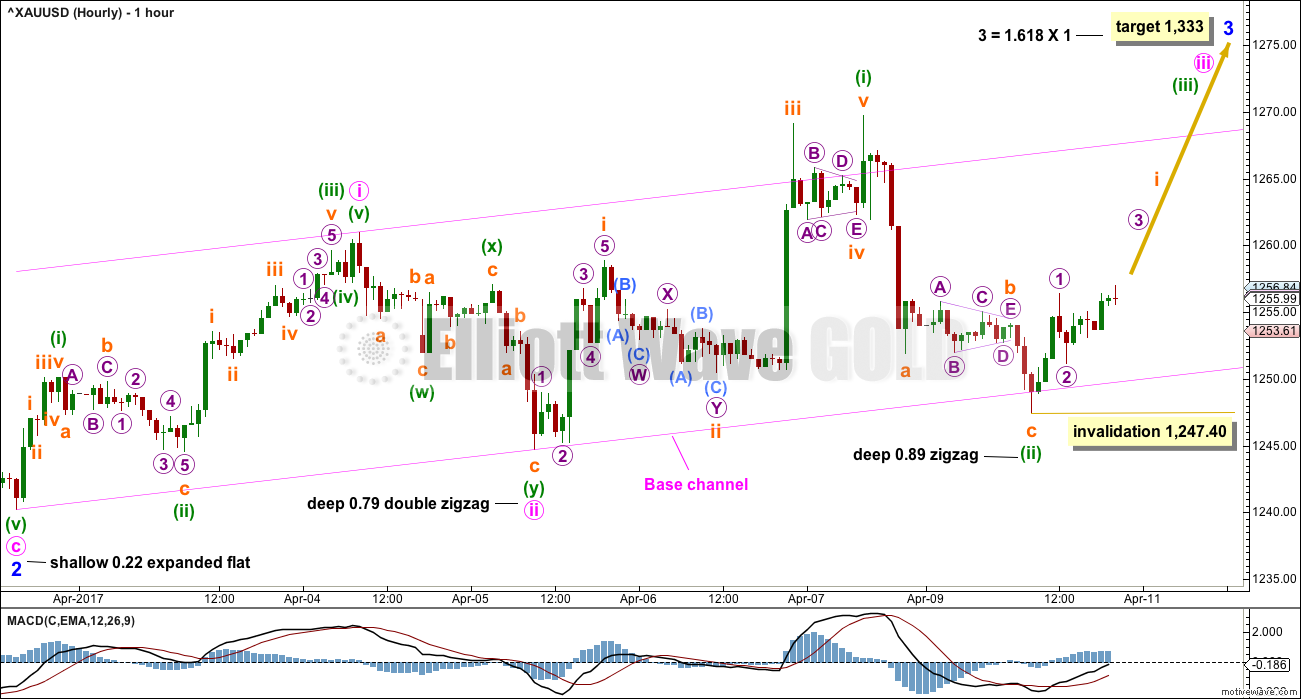
Click chart to enlarge.
There would now be five overlapping first and second waves for this main wave count: minuette, minute, minor, intermediate, and primary. When third waves extend in their middle (which is very common), then this is how they necessarily begin, with a series of first and second waves. At this point in the wave count, there is a winding up of potential energy that may be released in explosive upwards movement when the middle of the third wave arrives.
Gold has a tendency, typical of commodities, to exhibit very strong fifth waves. This tendency is most commonly seen for the fifth waves that end its third wave impulses. One or more of minor wave 3, intermediate wave (3), and primary wave 3 may exhibit blow off tops.
Gold often exhibits strong extended third waves and even stronger fifth waves.
No target is given for minute wave iii to end because the following correction for minute wave iv may be very brief and shallow. As the middle of the third wave unfolds corrections along the way up may be increasingly brief and shallow, offering only the briefest of opportunities to join the trend.
It is concerning for this wave count that after the shallow correction of minor wave 2 the next two second wave corrections for minute and minuette degree second waves are both deep. Minuette wave (ii) has continued lower for this wave count and is now very deep. However, price looks to have again found support at the lower edge of the pink base channel, which would be expected for this wave count.
Minuette wave (ii) should be over and should not breach the lower edge of the pink base channel. Within minuette wave (iii), the first wave of the impulse labelled subminuette wave i may be incomplete. Subminuette wave ii may not move beyond the start of subminuette wave i below 1,247.40.
ALTERNATE ELLIOTT WAVE COUNT
DAILY CHART
Click chart to enlarge.
This alternate daily wave count sees minor wave 1 ending two days later than the main wave count. Thereafter, minor wave 2 may be unfolding as another expanded flat correction. Expanded flats are very common structures.
This wave count fits in terms of all subdivisions on the hourly chart. Within minor wave 2, the correction for minute wave b at 1.44 times the length of minute wave a is only a little longer than the common range of up to 1.38, but well within the allowable convention of up to 2.
This alternate wave count would expect it is very likely that downwards movement this week should continue and end at least below 1,240.24, so that minute wave c moves below the end of minute wave a in order to avoid a truncation and a very rare expanded flat correction.
The target expects the most common Fibonacci ratio for minute wave c, which coincides with a reasonably common Fibonacci ratio for minor wave 2. The target for this wave count has a good probability.
A new low below 1,240.24 would see any variation of the main wave count invalidated and provide reasonable confidence in this alternate wave count.
Minor wave 2 may not move beyond the start of minor wave 1 below 1,195.22. Downwards movement, if it continues below the target, should find very strong support at the lower edge of the black base channel. That trend line should not be breached for this wave count.
HOURLY CHART
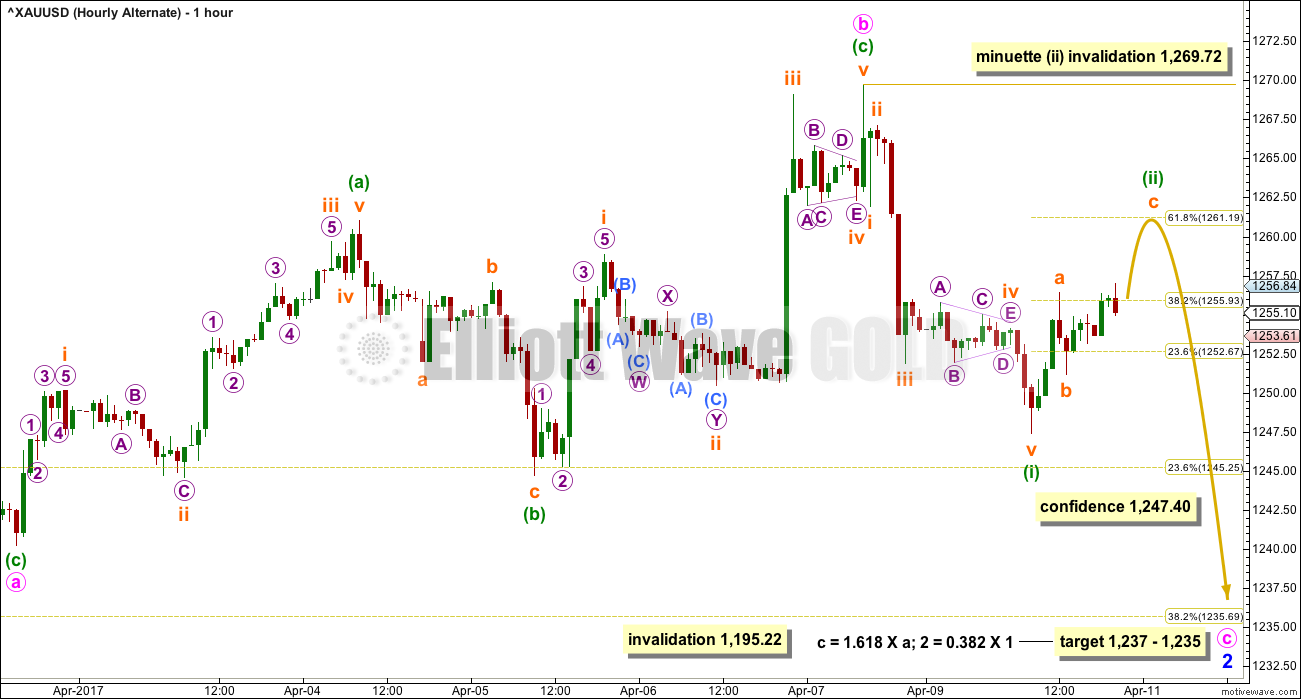
Click chart to enlarge.
This alternate wave count must see recent upwards movement as the completion of minute wave b, subdividing as a zigzag.
Minute wave c must subdivide as a five wave structure, either an ending diagonal or an impulse. An impulse is the more common structure, so more likely, and at this stage that is what it looks like.
Within the impulse, minuette wave (i) may be complete and minuette wave (ii) may now move higher to complete as a zigzag. Close to the 0.618 Fibonacci ratio at 1,261 is where subminuette wave c would reach equality in length with subminuette wave a, so this looks like a reasonable target.
Minuette wave (ii) may not move beyond the start of minuette wave (i) above 1,269.72.
If downwards movement continues to Thursday the 13th of April, then minor wave 2 may complete in a Fibonacci 13 sessions total.
TECHNICAL ANALYSIS
WEEKLY CHART
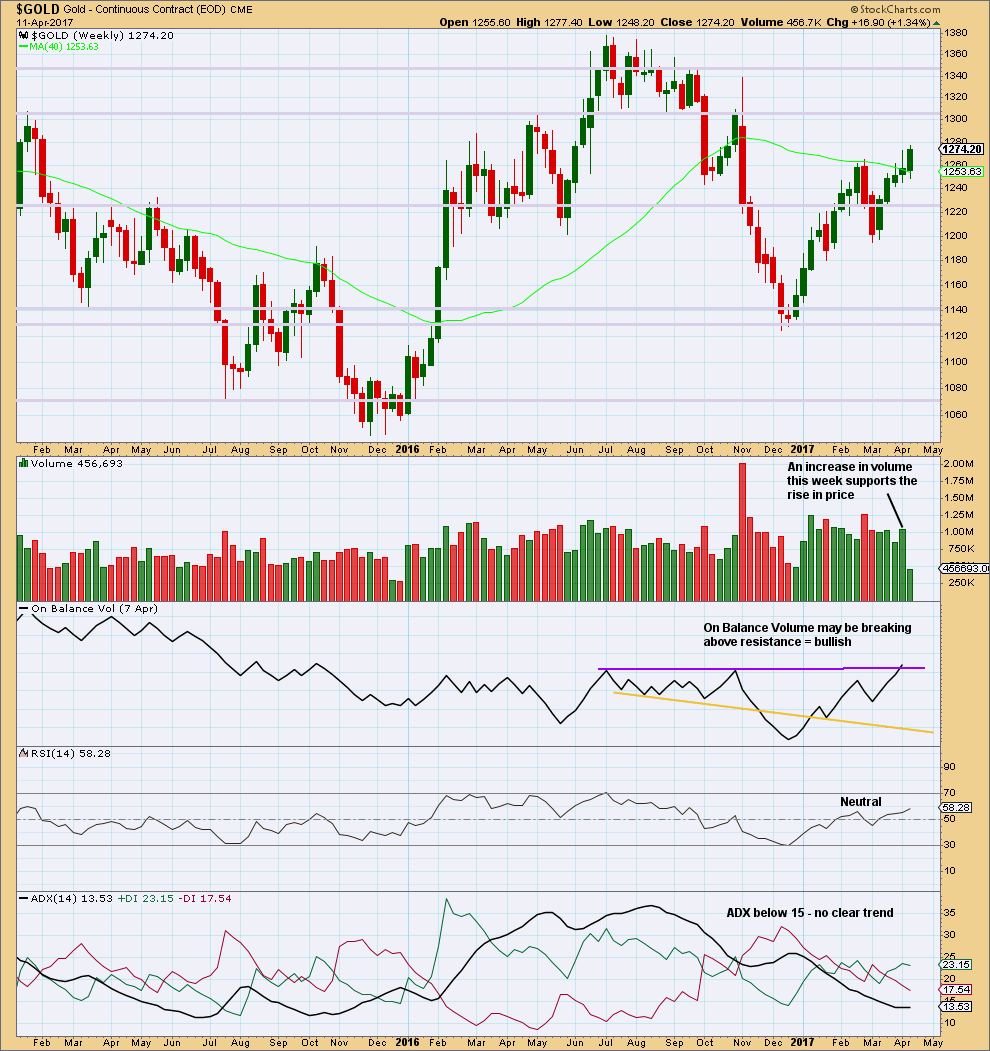
Click chart to enlarge. Chart courtesy of StockCharts.com.
The relatively long upper wicks of the last two weekly candlesticks are a little bearish. The increase in volume last week is bullish.
The purple trend line on On Balance Volume has been carefully drawn to be as conservative as possible, sitting along the prior two highs. This trend line has a very shallow slope and is reasonably long held. It has only been tested twice before. It has some reasonable technical significance. Last week it is slightly breached offering a reasonable bullish signal. However, for the signal to have more weight it needs a clearer breach.
DAILY CHART
Click chart to enlarge. Chart courtesy of StockCharts.com.
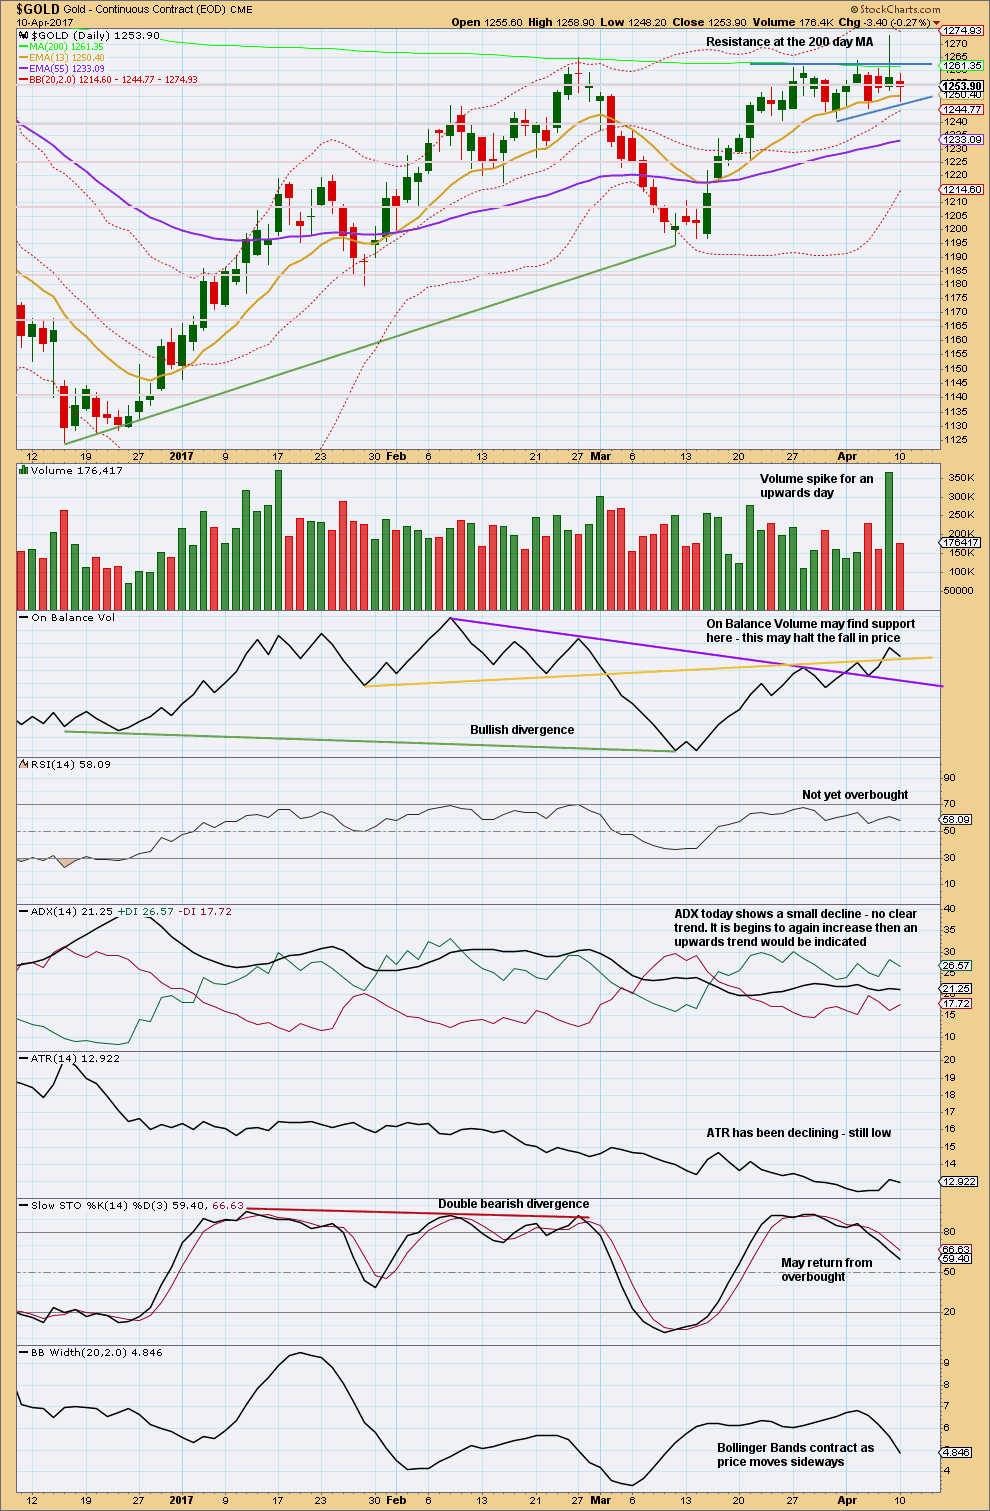
Gold is still range bound. During this range, it is the upwards day of the 7th of April that clearly has strongest volume suggesting an upwards breakout is more likely than downwards.
On Balance Volume is bullish.
All other indicators today are read as neutral.
Overall, this chart is neutral to bullish. An upwards breakout does look more likely.
The support line for the small consolidation zone is redrawn today. It looks like it may have an upwards slope. This gives a bullish bias.
TRADING ADVICE
The longer price coils sideways, the closer and more violent the breakout may be. My advice would be to either enter a hedge, or just a long position.
A long position at this stage may have stops set just below 1,240.24, or more ideally about 1,221. The lower point would allow for the alternate to unfold and then price to turn back up; this point allows for strong support at the lower edge of the black base channel on daily charts.
A hedge may have the short with a stop just above 1,269.72 and profit target at 1,237. The long portion of a hedge may have a stop just below 1,247.40 and a profit target at 1,333.
Always use a stop. Trading without stops exposes the entire equity in your account to risk; you could lose it all.
Do not invest more than 1-5% of equity on any one trade. Adjust position size to meet this rule.
GDX
DAILY CHART
Click chart to enlarge. Chart courtesy of StockCharts.com.
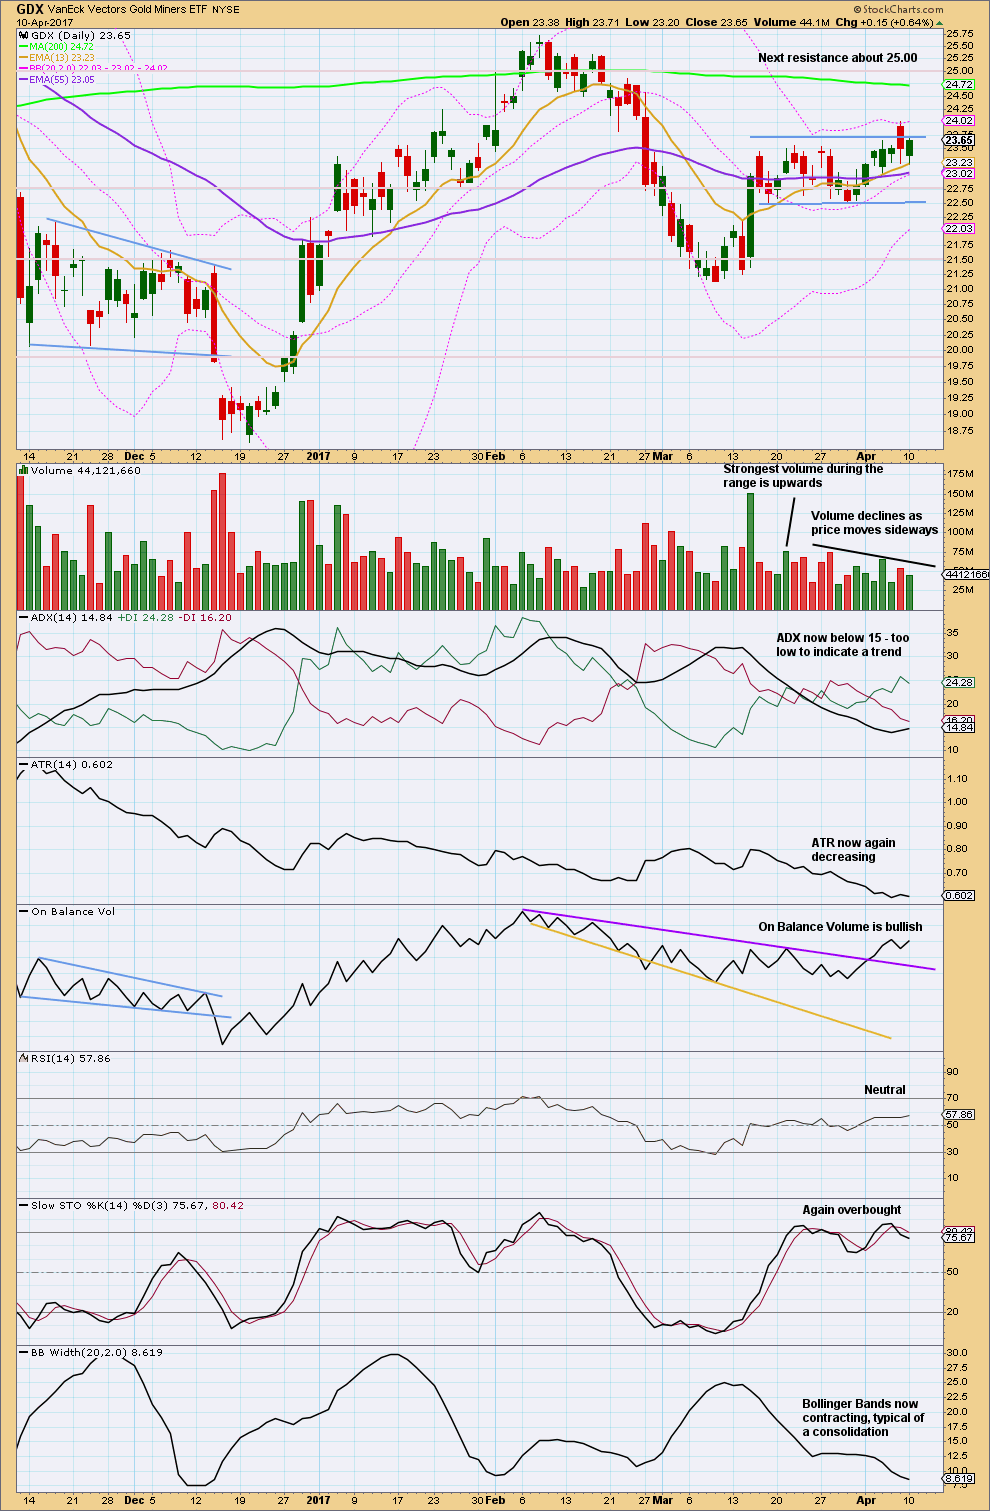
The upper edge of the consolidation zone is today slightly adjusted higher to sit about 23.75.
Volume is slightly bullish. On Balance Volume is bullish. Give this indicator reasonable weight.
Overall, the picture from GDX is neutral to bullish.
This analysis is published @ 09:47 p.m. EST.
Lara I’m sooooo sorry to hear you’ve not been well. Please do not delay.
I had a good friend who sufferred from migranes and did not find relief; however, she ate microwaved food and nutrient defunked foods, and despite her neck/head posture refused to try massage therapies or chiropractic or non-mainstream medicine. Its really frustrating to watch someone rely on drugs only as a solution. (She was a registered nurse) I do hope you are interested in more hollistic approaches, but by a-l-l means, please do see a doctor or two or nutritionalist, etc.. The symptoms scared me when I saw that combination. I liked seeing the nutritional suggestions as I read through and laughed when I read Alan’s comment…. we eat the same things! But I’m getting off topi c.
I can’t help but wonder if that surfing incident with your shoulder(?) a while back is having residual effects. I know my trapezius muscles cause me horrid neck and head pain at times because -I’ve been told- one side is shortened. (crappy injuries followed by insufficient care on my part) The body is an amazing thing though. It does respond. (and I still have work to do on mine) There are so many intricate tiny parts, maybe one of them is screaming at your for attention !
Please get well 🙂
Ps. ever thought about too much caffeine not a good thing?? I mean I don’t know how many coffees your actually consume. 🙂
LOL
I’m super healthy actually and I do see a holistic doctor. She does a full blood test six monthly, and I have a bunch of supplements I take.
I eat an extremely healthy diet with lots of fresh fruit and veggies, no sugar and very little wheat.
I exercise a lot.
Yeah, maybe it’s something to do with a surfing injury.
But I think it’s maybe more likely a bit of stress and not enough sleep. I’ve suffered from insomnia all my life.
Anyway, I’ve got a small dark chocolate treat today, and I saw a doctor. Early to bed again for another good nights sleep.
I’m sure I’ll be fine. Thanks for your concern.
John, this comparison chart since the 2015 lows in HMY may be of value. HMY seems to be an outperformer as it had a huge run in 2016. Maybe it will have another big run now?
The other 2 seem to be in the same range as GDX and GDXJ.
If you want to research and invest in individual stocks, I don’t see an issue. It may be a great strategy.
For me, I am focusing on GDX and GDXJ analysis to help guide my trading in NUGT, JNUG.
Good luck.
https://www.tradingview.com/x/4Cxn9coV/
Sorry to learn Lara has not been keeping well. Best to see a doctor. Have known folks suffering from migraines; controlling blood pressure helped. Get well soon Lara, stay well!
Thank you very much Syed 🙂
Okay, so the comment I made before was wrong hence deleted.
Looking at COT data it’s not as simple as many seem to think it is. It’s actually more confusing. We can’t just look at large speculators (who go with the trend) nor commercials (hedging, against the trend) and say that when they’ve changed their positions then that’s what price should do.
Every time I look back at COT data this is what I see. Commercials are against the trend, because they’re hedging. Large speculators are with the trend, making money from price movement. So far so good.
The assumption is that commercials will change their position BEFORE price, but that’s not what I see.
Look back at the December 2016 low for price. Commercials (red line on this chart) decreased their short positions even as price moved higher for a few weeks. That’s not what we’re told they should do.
So a cursory glance doesn’t bear out the common assumptions.
I think using COT data properly is going to be more nuanced and complicated than that assumption. I think we should be looking at the movement index. And I haven’t gotten through this portion of my textbook yet. Then I have to read it again. It’s a lot to digest.
I used to be a subscriber to Steve Briese’s service. It didn’t help an awful lot with my trading, except when there were some unusual extreme setups. However, there is no question that he is the expert on the COT data.
The main lesson I took from him was that the idea of ‘smart money’and ‘dumb money’, so popular amongst gold bugs, is completely misguided. It’s the speculators that make the trends not the commercials. The commercials are only ‘right’ at the turns, but they are in the market for different reasons than we would be.
Exactly. That’s what I gather too, so far. That the common assumptions about COT data aren’t really what we should be following.
I’m finding it reasonably complicated, and I like to be thorough so I’ll take my time to get it right and be confident before I add it to my analysis.
Does anyone know why the Silver ETF SLV, has not recently mirrored the new highs in the metal? I know Silver has not matched Gold’s highs but the ETF should closely track the metal price action. The ETF did print a huge bearish engulfing candle last Friday FWIW…
I don’t know Verne. It should. It has a very strong positive correlation with $SILVER.
Is this SLV (the symbol that StockCharts are using)?
Hi Lara,
I noticed you did not update US Dollar (DXY) in the Trading Room. When appropriate, I would appreciate an update, particularly for short and intermediate term.
Thanks….
I’ve been quite unwell this last week.
I’ll do it when I have the energy and time.
Do take care.
Will do Alan, thank you 🙂
Hope you feel better soon 🤒
Thanks Dreamer. I’m having problems with my head. Migraines, nose bleeds and fainting. So that’s making it rather difficult to concentrate for long periods.
I let you know this so you’ll understand if I’m keeping my workload to a minimum. I’m needing more sleep. Think maybe I should see a doctor 🙁
I used to have migraine and frequent tension headaches in my younger days. They would surely happen once I had less than 5 hours of sleep. Ever since I took Vitamin B and D supplements and did more stretching exercises daily, they were mysteriously gone. Even lack of sleep doesn’t bother me anymore. Lara, I don’t know if it might also work for you.
Thanks Alan. Yeah, I think you’re onto something there. I do take a bunch of supplements but lately I’ve been slack on remembering. I have a multi vitamin, Biotin and vitamin D in there.
I’m asking Cesar to help me remember 🙂
I agree with supplements. When my migraines are in full, I have to resort to my Sumatriptans but otherwise, B2, BComplex, but the biggest difference was adding Trace Minerals. Sleep… when I can. I surf every morning. It too is critical. Maybe it’s why my body craves/needs the Trace minerals.
Yes. Joseph. Magnesium and selenium in particular. These are vital for brain health. I get mine from dark leafy greens, yogurt, dark chocolate, tuna, spinach and asparagus.
Lara, could you please update how the daily would fit into your weekly alt (posted March 9th) and subsequently monthly alternate (jan 9th)?
Regarding comments below, you and so many others know way more than me about COT data.
I’m simply observing that everyone calls it the “smart money” and it is right more
often than not. Love Dreamer’s “no bears allowed”‘ pic. But do the bears know that? Would love to have atleast alink to only the current bearish charts which have not been invalidated, on second thought, what I am thinking would be a design set up which is a different thing where bear charts are on their own page so I don’t think you can do a link to only the current viable alternatives. Scrap that.
NGAS is breaking below it’s support line. I’m taking that one off the table for Trading Room ATM until it’s next direction becomes clearer.
Copper moved lower and has bounced, positions may be slightly underwater there. Holding on for now.
Gold positions should be very profitable, for now I’m moving my stop up to breakeven. After analysis will calculate a higher point for it. You may like to now use a trailing stop.
Nicely done John 🙂
Very deep retrace in GBP:USD, but still well below invalidation and looking like a corrective move to me atm.
May be a very good entry point near here albeit price has broken above the upper base channel which is a little concerning.
Looks like we may be finishing a 4th wave triangle atm. A final 5th wave up should end the move.
Thank you Olga
I have it exactly at the base channel. Now would be the time to take a punt on a short for GBPUSD.
One of the hardest things to do as traders is enter in the opposite direction. That’s what you have to do when you sell the rallies or buy the dips. At the end of this rally, entering short feels wrong. You want to go in the direction of price.
But it’s got some resistance here, and if that trend line works then that should be it for GBPUSD today.
Thanks Lara! 🙂
Here is the data of silver from 4-4-17 showing Large Speculators, money managers and hedge funds, are at a 52 week high in longs, blue arrow.
The red arrow shows the smart money, net short and trending shorter…from the previous post.
Hi David,
Though I am Long at the moment, and I know Dreamer would say we need to
climb a wall of worry’, I appreciate your showing this chart. EWI is currently overall bullish, but they are still waiting for a mild pullback before we go higher, similar to what Lara describes in her Alt.
Here is another source….Ike Iossif interviewed by Mike Swanson…4/9/17 podcast. Take a look @ his charts. He uses some interesting Proprietory tools.
http://www.wallstreetwindow.com/post/podcast
I have been toying w/Ike’s idea before seeing his interview…. that we pullback at the July Trendline and decline for awhile into a final Season Low (also suggested by Tim Wood– Cyclesman.com)…then go up strongly.
Are you the trader who commented on Tim Wood…or was it Dermot?
I am not familiar with Tim Wood, Melanie. Thanks for the post.
I too looked at COT data earlier. Very concerned.
Perhaps they (commercials) are of the view which Lara outlines
in her monthly alt (jan 9th) and weekly alt (mar 9th) which indicates
the big picutre is cycle wave c down. Good info here David and Melanie.
We have two opposing forces, the commercials who continue to go short when gold goes up and the world stage which is bubbling like a volcano ready to erupt. Eruption will cause a spike in gold to continue. If the Korean and Syrian situation calm down and there is no russian trump connection we will probably have our last surge in the stock market at which time gold will fall along with silver. Our latest jobs creation of 98k was a dud and if this continues it will pull the stock market down and push the metals up. So there are a lot of cross currents, expect a big down day in the metals and a spike in the stock market if things smooth over and the republicans pass health care and tax reform.
Commercials, often referred to as the smart money, are hedgers that deal the underlying commodity as part of doing business. They are the large operators with very deep pockets, and this snapshot from the close on April 4th shows they are the largest short they have every been since 1993.
The current commercial short position of 112,346 short contracts is a record short position. Does this make any of you metals bulls nervous? The reason I ask is, I am bullish but history shows, the commercials are usually right and silver, which generally leads gold in metals bull markets, is extremely bearish.
Thoughts? Lara?
I’m just not comfortable enough with COT data to give a comment here. It’s actually not as simple as it looks, I’m still digesting “The Commitments of Traders Bible” by Stephen Briese. So far my conclusion, is I really don’t know enough yet.
But, having said that, my initial thoughts would be exactly the same as yours David. This is concerning for bulls.
I would have expected the commercials to have turned before price, to have lightened shorts not increased.
appears to be in final Micro 5 of Subminiuette i,
peaking soon? Or it was at 11 AM already?
GLD punching through 200 dma. What would be picture perfect would be a return to smooch topside followed by a sonic blast higher….
Metal & mining ETF confirming metals going higher.
Inv HnS or cup andhandle and BT on weekly chart of XME
I’ll get back to you later
Yep, looking like today is breakout day! 🚀🌝 😍
We just need to see a strong close on good volume and I think we will!
If I am right, price has moved through two 1-2s. Just finishing up the 3. If 3 does not extend, then I’m afraid it will be two 4-5s followed by a larger drop in subminuette 2. It’s going to be a grind today.
The only good thing is that the Alternate is hanging there just. A couple more bucks and it will bite the dust.
The Alternate has been invalidated. It’s now up up and away.
Gold stuck at resistance also. Could breakout at any time or may pullback first. If it keeps testing resistance it should break soon.
If the gap fails to close today, that will be very bullish
John, I guess I consider myself a deep thinker. I’m into numbers and analysis. Math has always been a favorite subject from school. Beyond that, I like to plan ahead and look at the possibilities. I’m a very visual person too, hence I like charting.
I guess dreamer just seems to “feel” like a good description. I’m always thinking (dreaming) of new ideas.
Gold is a most powerful wave 3 of 3rd of int 3 of pm wave 3. Gold can rise more than $100 from here.
Lara’s target will be met soon.
Thanks Lara.
Lara. Same problem with posting. Once I include my own charts, it is “under moderation”.
Folks, can anyone view my Ichimoku post which I put up only just. Do give me a holler if you do. Thanks.
nope
Thanks. It is “under moderation”. Always happen to me when I post a chart.
Alan, did you by chance edit the post after first posting it? That’s what will cause a post with a chart to go into moderation for me.
Dreamer. I think you’re right. I did a refresh. Mystery solved. Thanks.
Happens to me too Alan. If I post a comment with a chart, then I edit that comment, it goes into moderation.
Just post again and it’ll be there. Otherwise you have to wait for me to get up and notice it in moderation.
Same happen to me yesterday with uploaded chart with comment.
System quirk. Now we know what not to do.
Only StockCharts give an Ichimoku overlay on the price chart. Unfortunately, it is on a daily basis, data from yesterday’s close. Also, StockChart prices are slightly different from BarChart data that we all use.
There is not much difference from last week. The indicated trend is still bullish.
(1) The cloud is currently green, implying bullish.
(2) Prices lie above the cloud, implying strongly bullish.
(3) The tenkan-sen (blue) crosses the kijun-sen (red) from below while above the cloud. This action is similar to a bullish MACD cross. This is the textbook Ichimoku signal for a trend change.
First resistance is at 1257.40 (the blue number in the legend).
It can be observed that price is trying very hard to break the resistance.
Base support is at 1233.90 (the red number in the legend).
The point to watch is the upper edge of the cloud 26 days into the future. This is given by the first green number in the legend, 1245.65. Once the price breaks below it, we should see a deeper pullback towards the 38% and 50% Fibonacci retracements. (This price is pretty close to Lara’s 1247.40, but bear in mind price figures differ slightly).
Dreamer et al, I’ll try to give a brief writeup on the use of the Ichimoku chart over the Easter weekend. I’ll have some time then.
Alan, thanks for the post and explanation. Look forward to your Easter post!
Thank you Alan! Very helpful.
Possible update for Alternate hourly
https://www.tradingview.com/x/XOdoYw5R/
Invalidated
Lara, $Cocoa, our beloved chocolate, has a Daily Sentiment Index of 6%. I gotta think this must be near a bottom with such a low #.
Thought you might want to take a look at it for the Trading Room. It can also be traded with the NIB etf.
Oh goodness, I’m so partial to chocolate. We have a chocolatier here in Mangawhai that’s very good, and I get to eat chocolate this Sunday because Easter 🙂
Thanks for the tip Dreamer. Will take a look, and yeah, that looks good.
Watching NGAS…. it’s coming down again to that trend line. If it gets a bit lower then I may enter long there.
As for GBPUSD…. it may yet go a little higher. I’m waiting.
The bearish signal today from On Balance Volume for Copper is now really strong. I’m opening a short, stop just above resistance at 2.700. Target 1.937.
If it gets a bit lower in coming days and shows any weakness I may open a long hedge. But not yet.
For the GDX short term bear count to be correct, we need to see a breach of the green channel in the next couple of days, preferably tomorrow. The target would then be 22.35.
A move above 24.01 would give confidence to the bulls.
https://www.tradingview.com/x/NLPQ4SIF/
Gold, Silver, and GDX all produced false breakouts and are back within their symmetrical triangles.
GDXJ is weaker than GDX and both went up slightly today on low volume.
I think there is a good chance that the alternate plays out before we have a strong breakout to the upside.
https://www.tradingview.com/x/CsktmK73/