
Downwards movement was expected to continue. Overall, Friday’s session did move price lower with a lower low and a lower high, but the session closed green with a strong upwards push. This was not expected.
Members are offered some trading strategies for how to approach this market early next week.
Summary: The correction may be complete; confidence may be had if price makes a new high above 1,253.21. The short term target is now at 1,333 and a longer term target is initially at 1,392. There is a possibility still though that the pullback is not yet done and price may still move lower to the target at 1,230. Trading advice on how to approach this market next week is given under the classic technical analysis section.
New updates to this analysis are in bold.
Last weekly charts are here and the last video on weekly wave counts is here.
Grand SuperCycle analysis is here.
MAIN ELLIOTT WAVE COUNT
DAILY CHART
Click chart to enlarge.
This daily chart will suffice for both weekly charts.
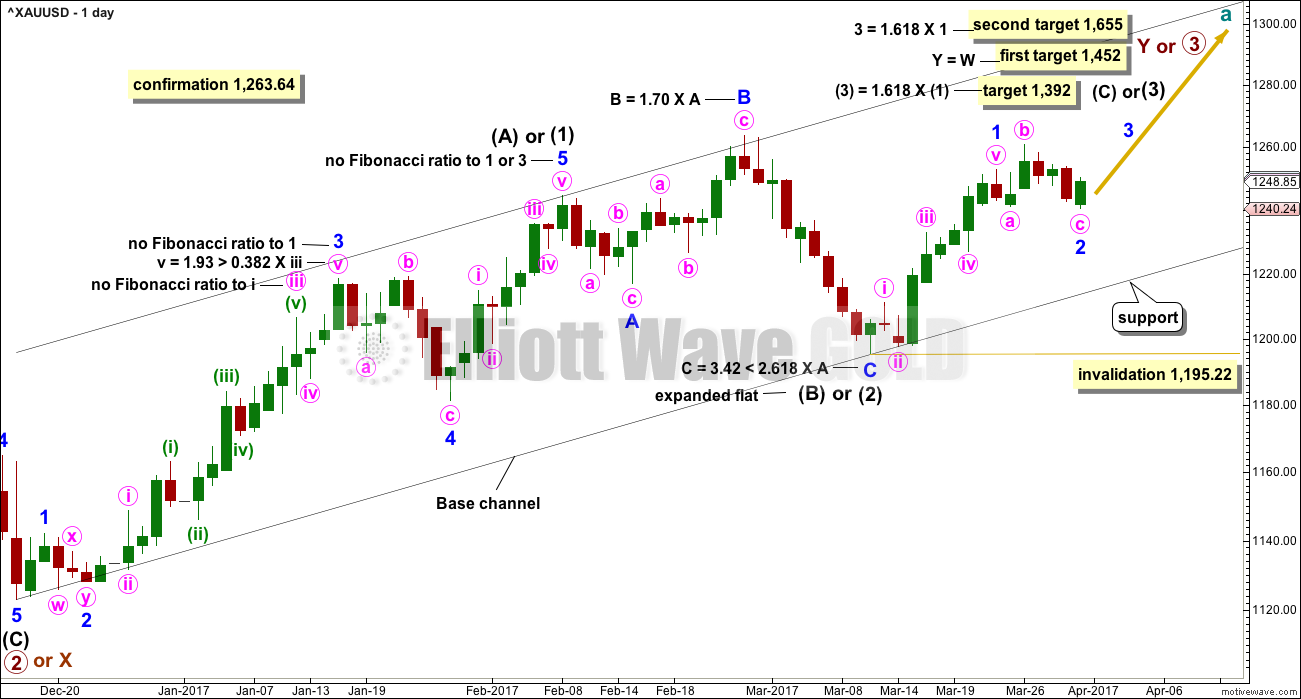
Upwards movement at primary degree is either a third wave (first weekly chart) to unfold as an impulse, or a Y wave (second weekly chart) to unfold as a zigzag. If upwards movement is a zigzag for primary wave Y, then it would be labelled intermediate waves (A) – (B) and now (C) to unfold.
Intermediate wave (1) or (A) is a complete five wave impulse lasting 39 days. Intermediate wave (2) or (B) looks like an expanded flat, which is a very common structure.
So far, within intermediate wave (3) or (C), the first wave up for minor wave 1 looks complete.
There are two hourly Elliott wave counts to end the week. It is possible that minor wave 2 is complete as an expanded flat correction, with minute wave c moving only just very slightly below the end of minute wave a at 1,241.03 to avoid a truncation. Minor wave 2 would have lasted only six days and may be a relatively brief shallow correction. This is entirely possible now; the strong pull upwards from intermediate wave (3) within primary wave 3 may force surprises to the upside.
The alternate below looks at the possibility that minor wave 2 is not over and may yet move lower to reach the target, which we had this week at 1,230.
Minor wave 2 may not move beyond the start of minor wave 1 below 1,195.22.
HOURLY CHART
Click chart to enlarge.
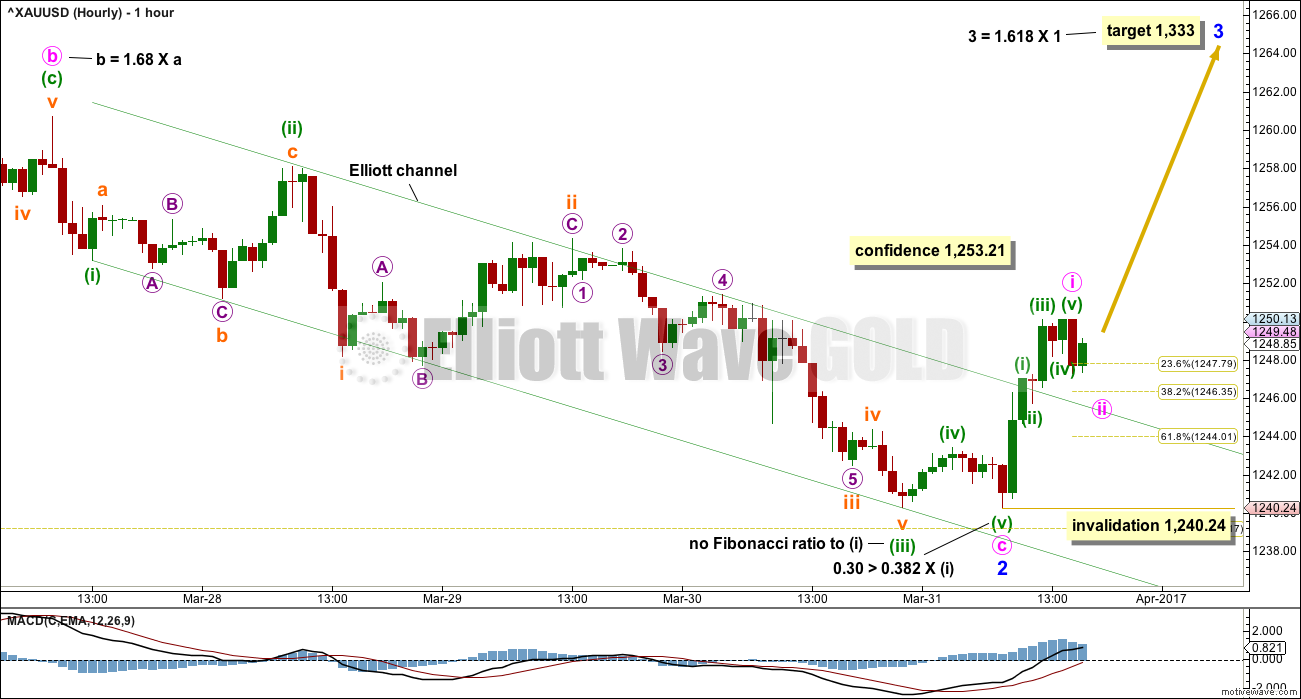
It is possible today that minor wave 2 is over as a completed expanded flat correction. Minute wave c would be 1.51 longer than 1.618 the length of minute wave a. Minute wave c ends slightly below minute wave a, so a truncation is avoided.
The Elliott channel for this first wave count is drawn using the first technique. The clear and strong breach at the end of the session suggests the downwards wave is over and the next wave up is underway.
The last downwards wave here labelled minuette wave (v) will fit neatly as an ending expanding diagonal on the five minute chart.
Upwards movement at the end of the session subdivides neatly as a five wave structure.
Minute wave ii may offer a good entry point to join a strong upwards trend. It may end with a little more downwards movement close to the 0.382 Fibonacci ratio.
A new high above 1,253.21 would invalidate the alternate hourly chart below and provide some reasonable confidence in this main wave count.
ALTERNATE HOURLY CHART
Click chart to enlarge.
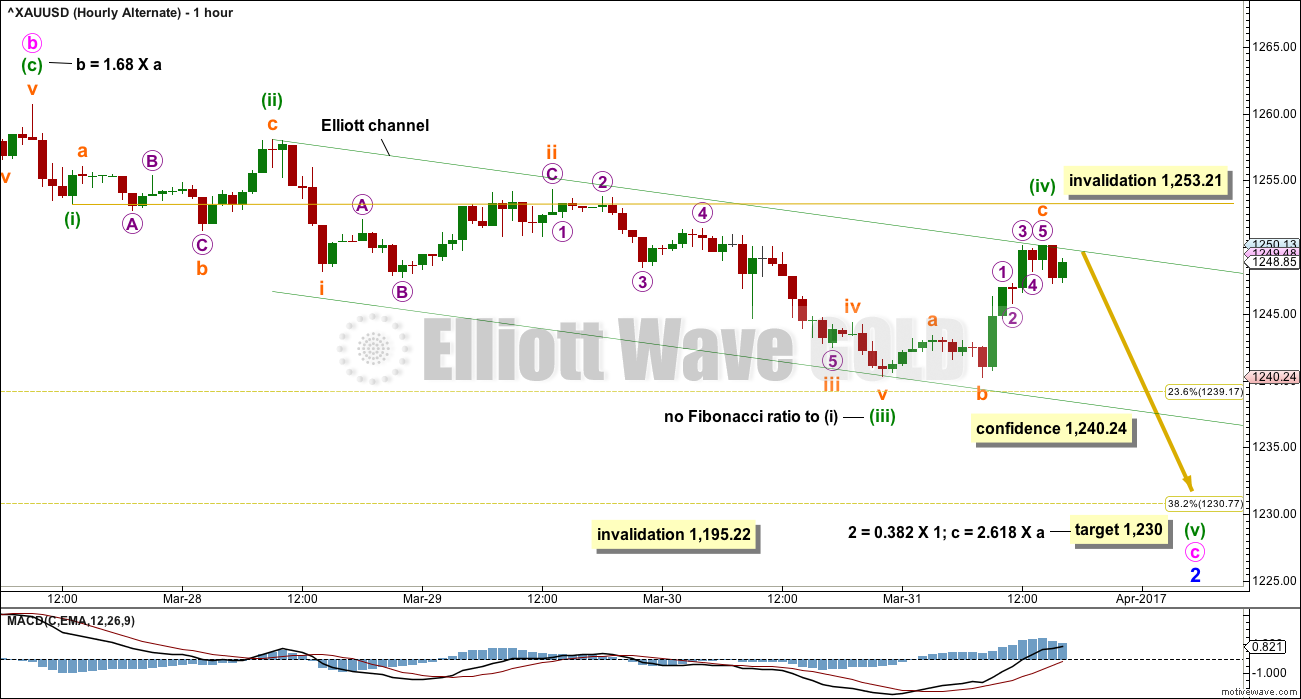
Alternatively, it is possible that the strong upwards movement at the end of Friday’s session is minuette wave (iv). Fourth waves are not always neatly contained within the Elliott channel, which is why Elliott developed a second technique to redraw the channel when the fourth wave breached it. This channel is redrawn.
The last downwards wave labelled here subminuette wave b may fit as a double zigzag on the five minute chart.
Minuette wave (iv) may not move into minuette wave (i) price territory.
Minuette wave (iv) is technically a regular flat correction, because within it subminuette wave b is a 1.02 length to subminuette wave a. Subminuette wave c is much longer than C waves within regular flats are, so this correction does not have the right look. Normally, regular flats have C waves that are close to even in length with their A waves, and they normally fit within a small channel.
ALTERNATE ELLIOTT WAVE COUNT
DAILY CHART
Click chart to enlarge.
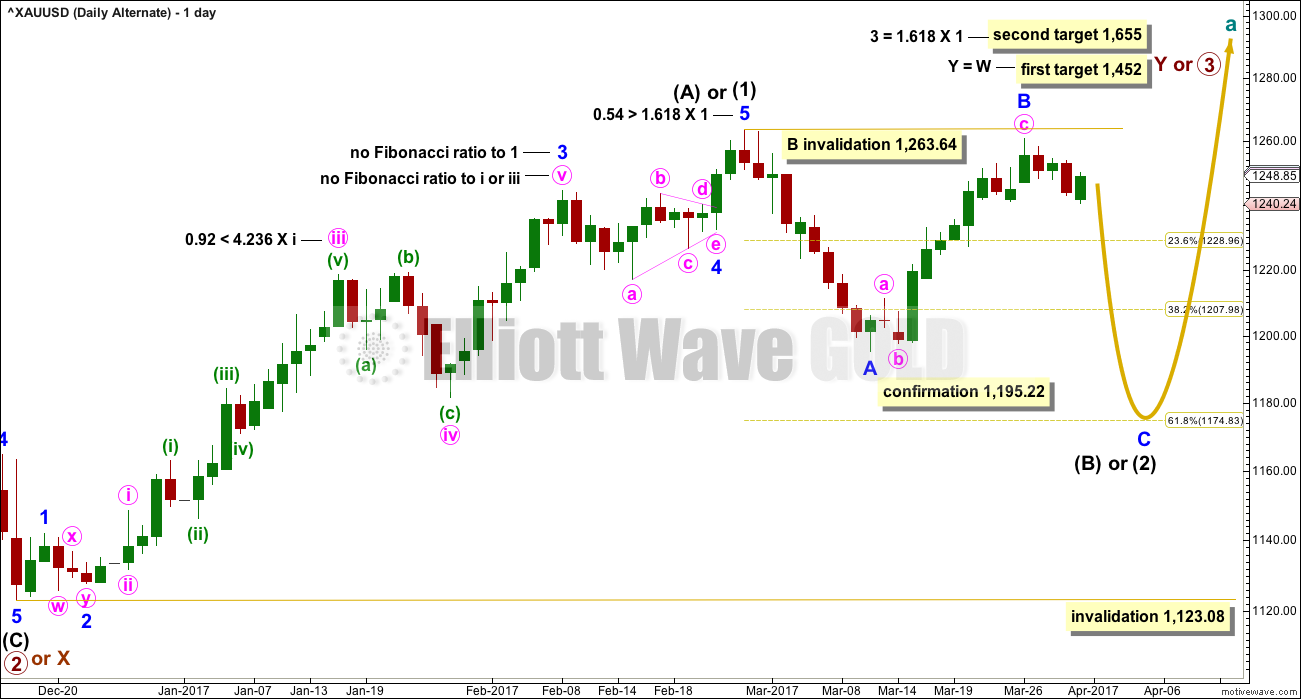
This alternate wave count is in response to queries from members.
Fibonacci ratios are noted on both daily charts, so that members may compare the main and alternate wave counts. This alternate wave count has slightly better Fibonacci ratios. This gives this wave count a reasonable probability. Due mostly to volume, this wave count is judged to have a lower probability than the main wave count.
At this stage, this wave count would be considered confirmed if price makes a new low below 1,195.22. At that stage, the target for intermediate wave (2) or (B) to end would be the 0.618 Fibonacci ratio of intermediate wave (1) or (A) at 1,175.
At the hourly chart level, this wave count would see minute wave c of minor wave B as a five wave structure. This would now have a reasonably good fit.
TECHNICAL ANALYSIS
WEEKLY CHART
Click chart to enlarge. Chart courtesy of StockCharts.com.
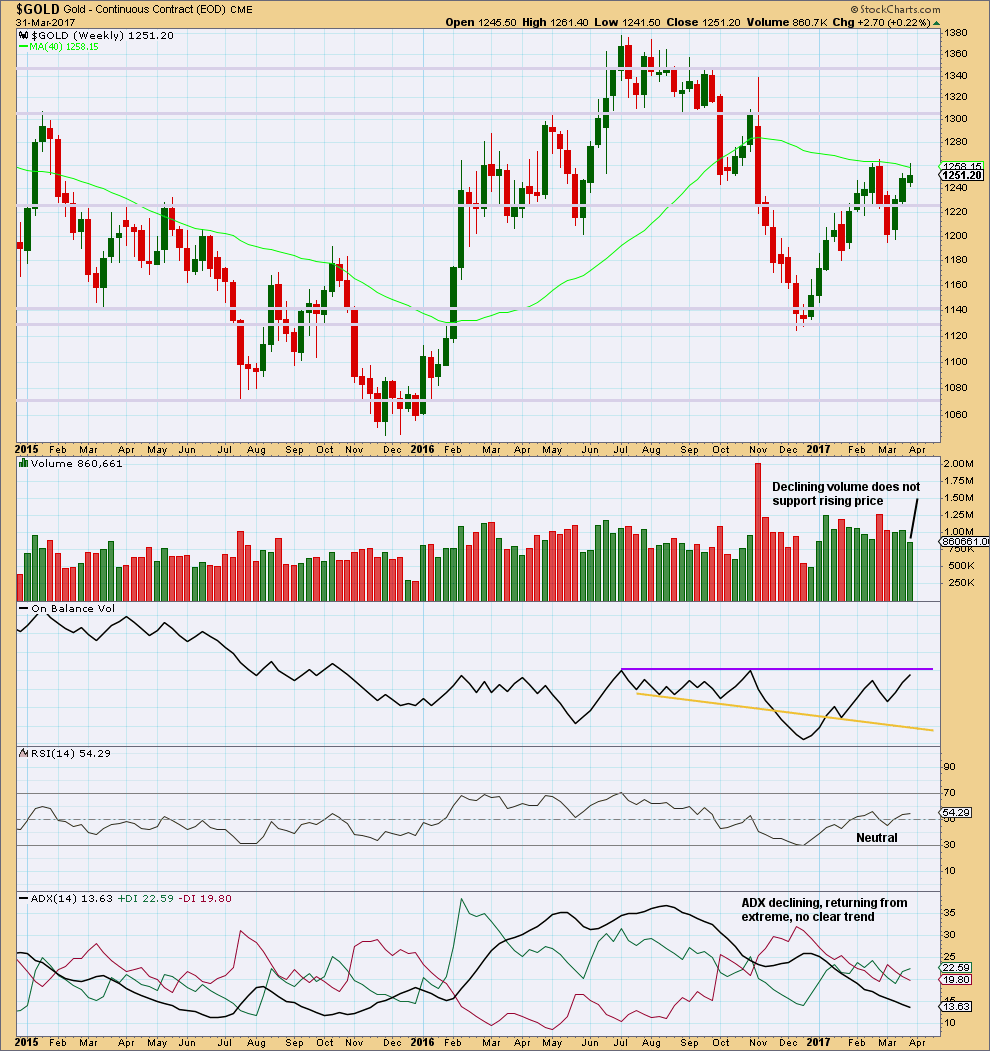
The small real body and long upper wick for the third weekly candlestick completes a stalled candlestick pattern. “It indicates bulls strength has been at least temporarily exhausted. A stalled candlestick pattern should be used to liquidate or protect longs, but usually not to short. It is generally more consequential at higher price levels.” (Nison, “Japanese Candlestick Charting Techniques”, page 100).
Lighter volume for this upwards week is also concerning for bulls.
On Balance Volume is very close to resistance, but not quite there yet.
This weekly chart offers slightly more support to the alternate hourly Elliott wave count than the main hourly Elliott wave count.
DAILY CHART
Click chart to enlarge. Chart courtesy of StockCharts.com.
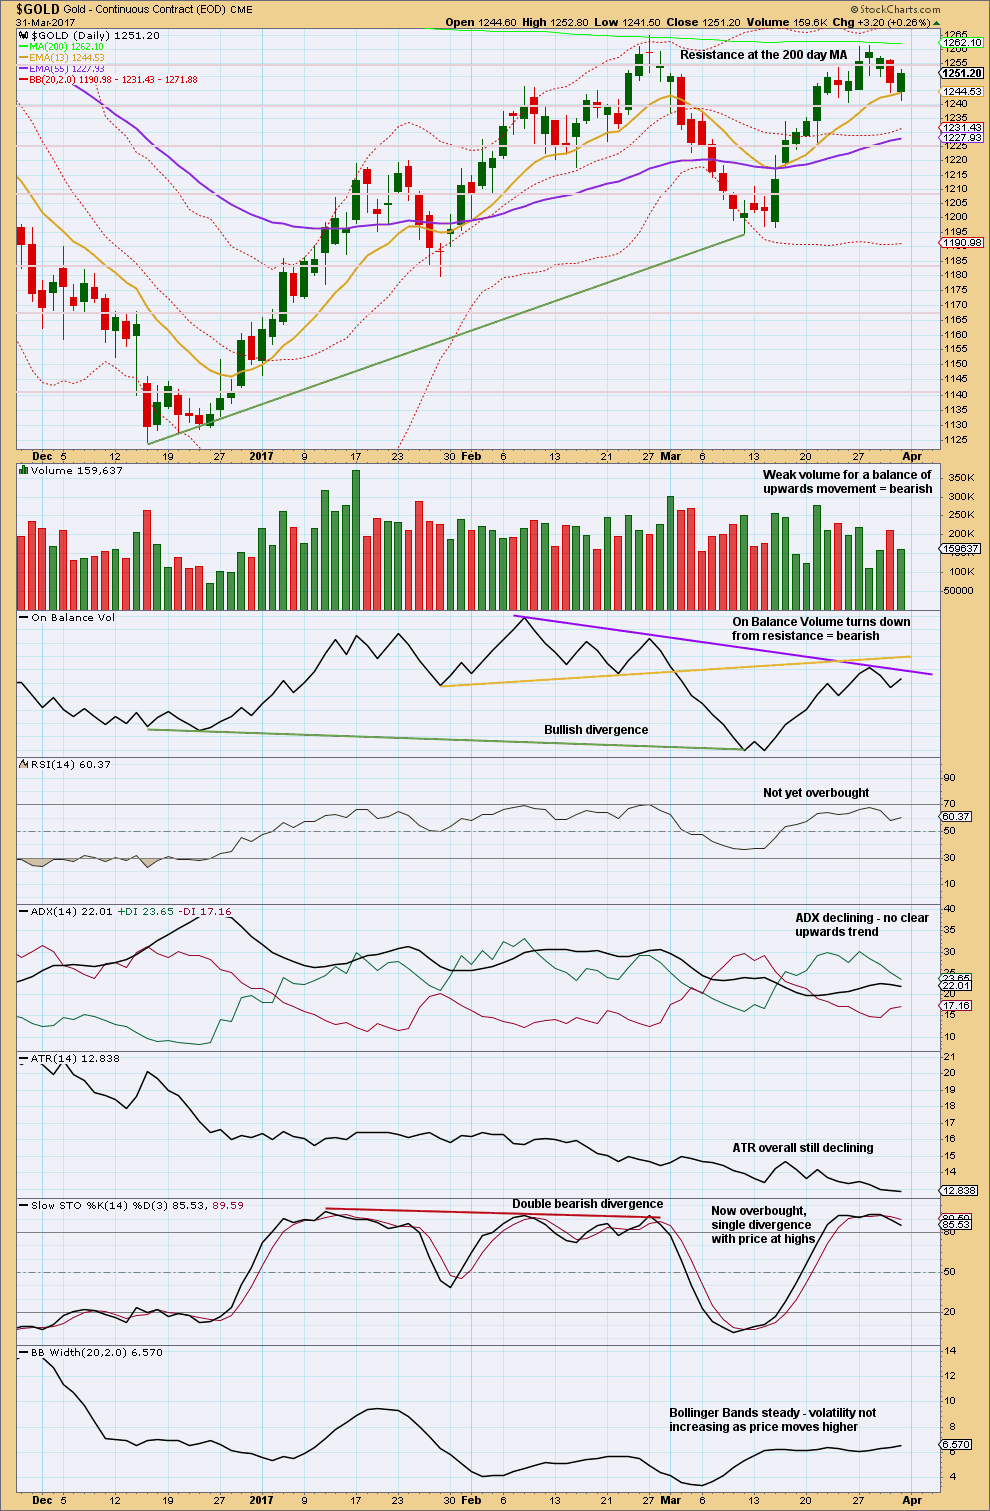
Friday completed a downwards day with a lower low and a lower high, but the candlestick closed green and the balance of volume during the session was upwards.
The longer lower wick and green colour of this candlestick is bullish. However, the decline in volume does not support upwards movement during the session, so this is bearish.
On Balance Volume is very close to resistance at the daily chart level as well as the weekly chart level. This should be taken as a bearish warning; there is strong resistance here for bulls to overcome.
RSI is not overbought, so there is room for price to rise. Stochastics is overbought, but this may remain extreme for reasonable periods of time during a strong trend from Gold. Members may like to look back at how price and Stochastics behaved from the 27th of January to the 11th of February, 2016: a powerful third wave within a third wave moved price higher while Stochastics remained overbought for the entire movement.
The bottom line is: look out for a possible strong upwards movement, but only have confidence that it has begun if price moves above 1,253.21 and / or On Balance Volume breaks above resistance.
There are a few possible approaches to trading this market next week.
More cautious and inexperienced members may like to wait patiently for clarity. An order may be set to open a long position if price makes a new high above 1,253.21. Or if members are able to watch the market, enter on a small correction after that price point is passed.
Another approach may be to open a hedge. The long position must have a stop just below 1,240.24 with a profit target at either 1,333 or 1,392. The short position must have a stop just above 1,253.21 and a profit target at 1,230. As soon as price breaks out of this zone, the losing position should be automatically closed and the winning position held with a good entry point.
GDX
DAILY CHART
Click chart to enlarge. Chart courtesy of StockCharts.com.
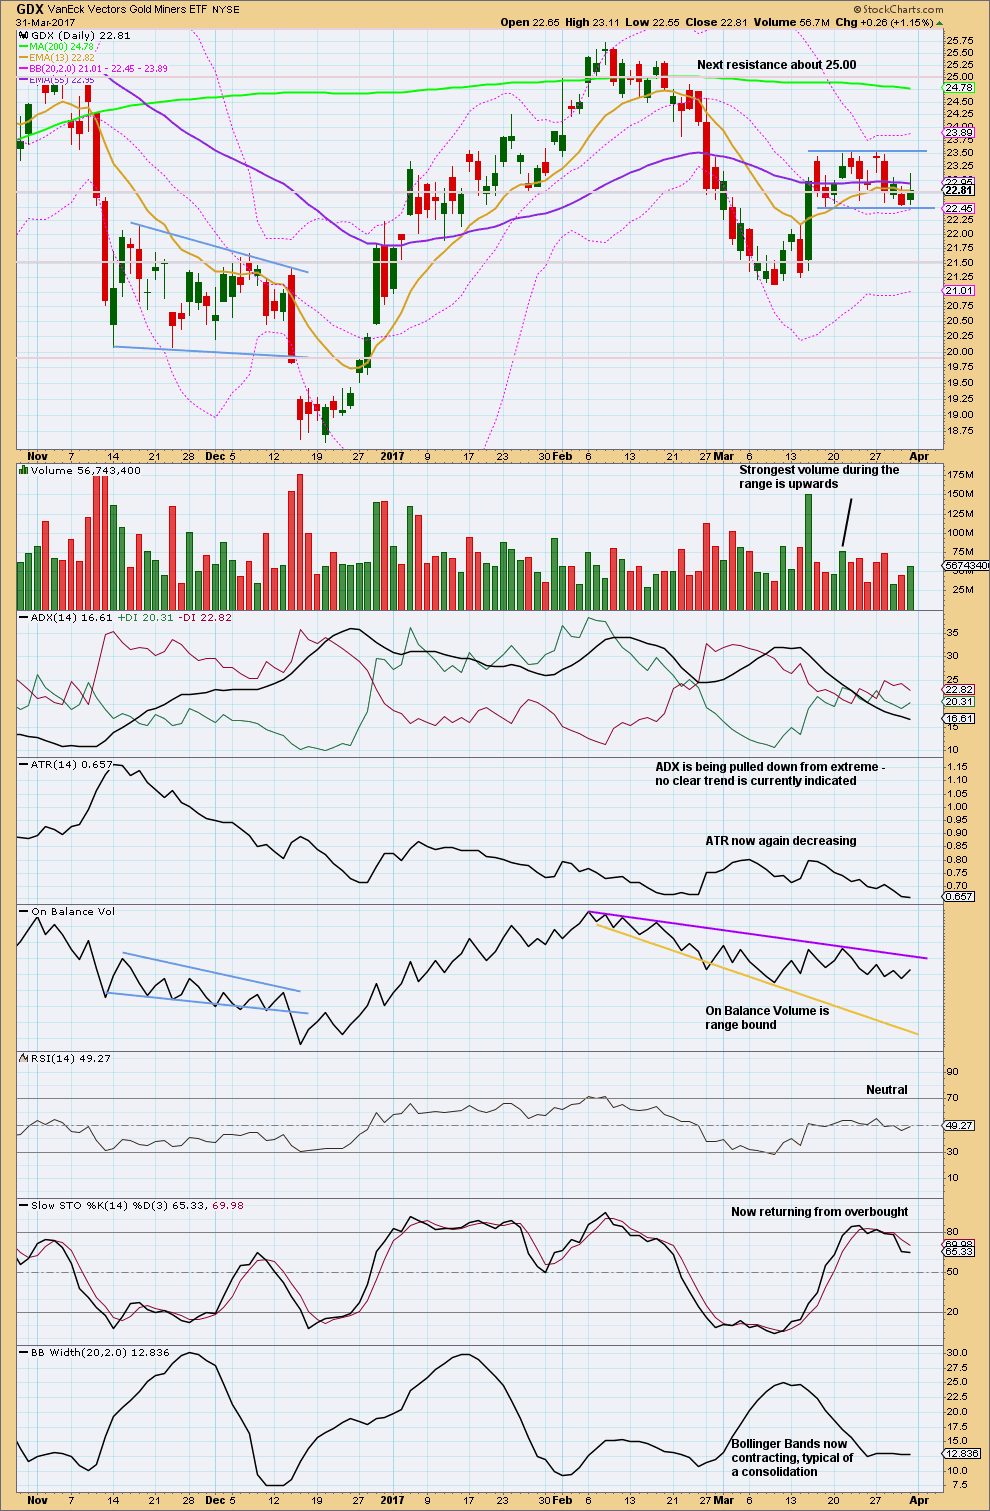
The bottom line for GDX is that it remains range bound. Volume suggests an upwards breakout is still more likely than downwards, but not by much. While this technique works more often than it fails, it is not certain.
This analysis is published @ 09:10 p.m. EST on 1st April, 2017.
Any members who took the last Trading Room recommendation for a short on Copper should have profitable positions today. Move stops to breakeven to eliminate risk.
The session is now closed and volume is looking very weak.
I’m writing up the analysis now, it’s not actually looking that good for bulls today.
FWIW (not very much, lol) I still favour a further low before the PM rocket ship finally blasts off 🚀
A new high above 1,253.21 has invalidated the hourly alternate wave count. This tells us that the prior downwards wave is over and the next wave up should now be underway.
This is either minor 3 of intermediate (3) of primary 3. Or it could possibly be a second wave correction within minute c of minor 2 down. That alternate idea will only be invalidated with a new high above 1,260.70. So that is our next confidence point.
My alternate hourly chart today will see minor 2 continuing lower, this will be a second wave correction.
Roopa – for the alternate daily chart the subdivisions at the hourly chart level are essentially the same. I’ll add an explanation in the text today. So to provide an hourly chart for that alternate daily count will be duplication of work anyway. That’s not really very efficient. I like efficiency.
Another day another count. That is what we get 🙂
A small and kind request lara.
Please post an alternate hourly chart for bears untill the alternate daily count gets invalidated and bulls gets confirmation. I know you dont prefer alternates untill its necessary but gold is on a intresting juncture. So its better to be aware of the other side of the coin i feel.
I’m not going to do that.
The probability of that wave count is too low.
If I publish an alternate at the hourly chart level it will be for the main wave count.
NP Thank you 🙂
Im long in gold @1253.5
Was thinking that as soon as 1253 get crossed will see party in gold but its calm n stable. Hope to see some fireworks tommorow. Reason for me getting bullish on gold is
1. Wave Queen Lara is pretty confident this time.
2. On daily chart i can see a bull flag formation.
3. 200dma is been tested frequently in recent times and many analysts believe that more and more its tested in short period of time than it looses its significant support or resistance intensity.
Lets see what gold does.
Happy trading.
Good luck
A friend who follows the COT data, which I do not, thinks it shows the smart money is betting against precious metals. Any thoughts anyone on this?
Looking like an attempt on Silver underway. I expect it will be stuffed…
Watching the 21 and 50 day simple moving averages closely. Even if we do get a bankster bear raid 21 should stay above. I am all in if it does. Next confirmation is 200 dma…
Hi Dreamer,
Again….Dreamer…I want to thank you for taking the time to explain how you figure targets on the leveraged etfs. I am in the midst of taxes after which I want to practice some examples using your calculations to see how it might be incorporated into my trading.
I also wanted to bring the following to your attention in reference to JDST/JNUG. I have never found being in an instrument that is executing a reverse split to be advantageous to the trader. Do you agree or disagree? Here is the info att:
Hi Melanie,
Taxes…..Ugggg. I used to do mine, but I now pay someone. So much easier….. just use some of those hard earned profits from this site!
Anyway, I agree and I disagree…
Generally, 3x leveraged ETF’s are dangerous instruments and are clearly not for “investing”. They are for experienced traders only. And yes, over the long haul if you hold, you will lose money and these ETF’s will reverse split.
Here’s where I disagree. They can make you a tremendous amount of money in a short to mid time frame, think days to weeks. You’re timing must be spot on with a trending market! Remember the JNUG chart I shared a long time ago showing the 2016 1,500% gain?
If GDXJ hits my optimistic but very possible 85 target by this summer, a buy and hold of JNUG now would be about a 400%+ gain. And yes, you can hold through a reverse split. Quantities divisible by 4 are best (the reverse split #). Good luck!
Hi Dreamer,
In this case the reverse split will be 1 to 4. In reference to ‘quantities’, do you mean to, ie: purchase a quantity of shares that is divisible by 4? If so, why?
You are obviously familiar with taxes as a trader? Based on the times of day you seem most active, I did not think you resided in the U.S. If you do, I am curious:
– Futures in the U.S. are treated as ‘mark-to-market’ another words gains
against losses are Not capped @ $3000 annually.
– If a trader resides in the U.S., one can elect to ‘mark to market’ their stock,
etf (Some etfs qualify for MTM treatment w/o applying for this elective.) and option trades for the Next tax year by requesting the elective via a letter and #3115 Tax form to IRS by the current years deadline (Apr 18, 2016 for 2017. One can always decline the elective the next year. ). Is this something you do….or are familiar with?
I am newer to this and am trying to figure the best way to go. I think ‘mark-to-market’ for most instruments traded makes sense unless you have practically no losses and much gain.
Not every tax accountant is schooled in tax returns for traders. So far I have found Jim Crimmons – tradersaccounting.com and Greentaxtrader.com. Trying to derive what I can from these sites at the moment to make sure my current LLC will suffice, etc. Luckily I am filing for extension, so will have a bit of time.
Any thoughts…welcome…
Hey Melanie,
Let’s say you own 100 shares of JNUG @ $6.00 [$600.00]. If you hold through a reverse split of 1 for 4, you then have 25 shares for JNUG @ $24.00 [$600.00]. It all divides without a remainder.
2nd example. You own 75 shares of JNUG at $6.00 [$450.00]. If you hold through a reverse split of 1 for 4, you then have 18 shares of JNUG @ $24.00 [$432.00] plus $18.00 cash in your account because they redeemed (sold) your fractional share.
So you see, when you plan ahead, you have a “clean” transaction when a stock reverse splits. You don’t lose money either way, but you could end up with less invested because they sell your fractional share. Much easier to keep it clean for taxes too.
As far as trading and taxes go, I keep it simple. I don’t trade futures or options at this time. My taxable accounts are set-up as FIFO (first in first out). Other than that, my tax accountant handles it, so not much help on all your tax questions.
I live in a suburb of Los Angeles, CA
Hope this help a little…
Dreamer,
Futures are the simplest for tax returns all you get is a 1099 B by your broker at the end of the year showing net gains or net loss for the year, commissions are taken out. Just one number .
Also net gains are treated under Section 1256 IRS its 60% of net gains or loss is treated as LT rates(lower) and 40% treated as ST gains or loss.
Hope it helps you all
https://www.law.cornell.edu/uscode/text/26/1256
Be careful about 3Xetf’s. These instruments have inherent price decay in them. Longer one keeps them faster price will go against your trade.
There is no way one can figure price target of any 3xetf with daily adjustment of 3x performance of the underline security.
The best way to use these is to short the bear 3xetf if the sector is in long term bull trend. The price decay of short 3xetf will be to your advantage.
In this case If you think Miners are in bull rend long term then short the DUST on a spike. Dust will go towards 0.
https://goldtadise.com/?p=376451
Here is a warning from Rambus for long trade in 3xetf:
https://goldtadise.com/?p=376440
Options and 3Xetf’s are like a dead fish. Longer you keep more they smell.
Enjoy!
Current Avi Gilburt article based on Silver:
https://seekingalpha.com/article/4059624-sentiment-speaks-gold-silver-woods-yet?app=1&uprof=51&isDirectRoadblock=false
Weekend listening Andrew Maguire:
Leverage 500:1 in gold market. What can go wrong?
https://soundcloud.com/kingworldnews/andrew-maguire-412017/s-rZbtT
Most interesting. if those persistent long futures contracts are indeed serving as some kind of hedge against a global stock bubble, it would explain why they refuse to be shaken out.
Here’s GDXJ
https://www.tradingview.com/x/CwIksO5h/
I published a version of this 2 weeks ago. This one has more detail. I think we are on the cusp of a big move up. We have time and price targets plus Elliott Wave to guide us.
I also think the top target has a good probability as it’s near the top of the channel!
https://www.tradingview.com/x/3sileVBv/
Here is the GDX lower probability alternate count
https://www.tradingview.com/x/8iyA79kS/
Friday was an up day for GDX on increased volume with an upwards breakout of the Elliott Channel on the hourly chart.
In my opinion, the risk/reward has now shifted to the bulls.
That said, there is a lower probability count that the correction is incomplete.
https://www.tradingview.com/x/PgQpAymI/
Lara.
The portion of the graph of the Main Count from Minuette 2 upwards looks rather cramped. I wonder whether it is possible that instead of the point labelled Minuette 3 (price 1250.10), it is in fact only subminuette 1 of Minuette 3. Subminuette 2 is an expanded flat ending at the low of 1247.31.
Hi Alan, I’ve asked for Cesar’s help and we just cannot decipher your comment.
Are you referring to the daily or hourly chart?
On the hourly minuette (iii) does not end at 1,250.10. Are you referring to data points on BarChart data or a different feed?
I just cannot follow your comment.
My apologies, Lara. I’ve not made myself clear.
I’m referring to the Hourly Chart in the Main Count, using BarChart data.
I append a modified chart for your perusal. As I made changes on your original chart using Word, I cannot cover up the label “minuette iv”.
Hopefully, this makes things clearer.
Lara. Scrap the comment above.
With the current price movement, I submit that you are right. Price appears to be now in a 4th wave triangle. The 5th wave ought to make a new high nearer to 1260, the area of huge resistance, before dropping.
Just replied. But it went into moderation.
I think he means could minuette iii (at the top of the 31/03 12.00pm hourly candlestick of the main count) be relabelled as minuette i, or even moved down a degree as well to subminuette i. Then followed by an expanded flat for minuette/subminuette ii.