
Upwards movement was expected for the main Elliott wave count.
A new alternate is provided today at the hourly chart level in response to volume analysis for Monday’s session.
Summary: It is very concerning that volume today and for Friday does not support upwards movement. Gold is consolidating. The main hourly wave count expects an imminent upwards breakout. The alternate hourly wave count expects a downwards breakout. If price breaks above 1,260.70, then use the target at 1,333. If price breaks below 1,244.59 now, then expect about a week of downwards movement to the original target at 1,230.
New updates to this analysis are in bold.
Last weekly charts are here and the last video on weekly wave counts is here.
Grand SuperCycle analysis is here.
MAIN ELLIOTT WAVE COUNT
DAILY CHART
Click chart to enlarge.
This daily chart will suffice for both weekly charts.
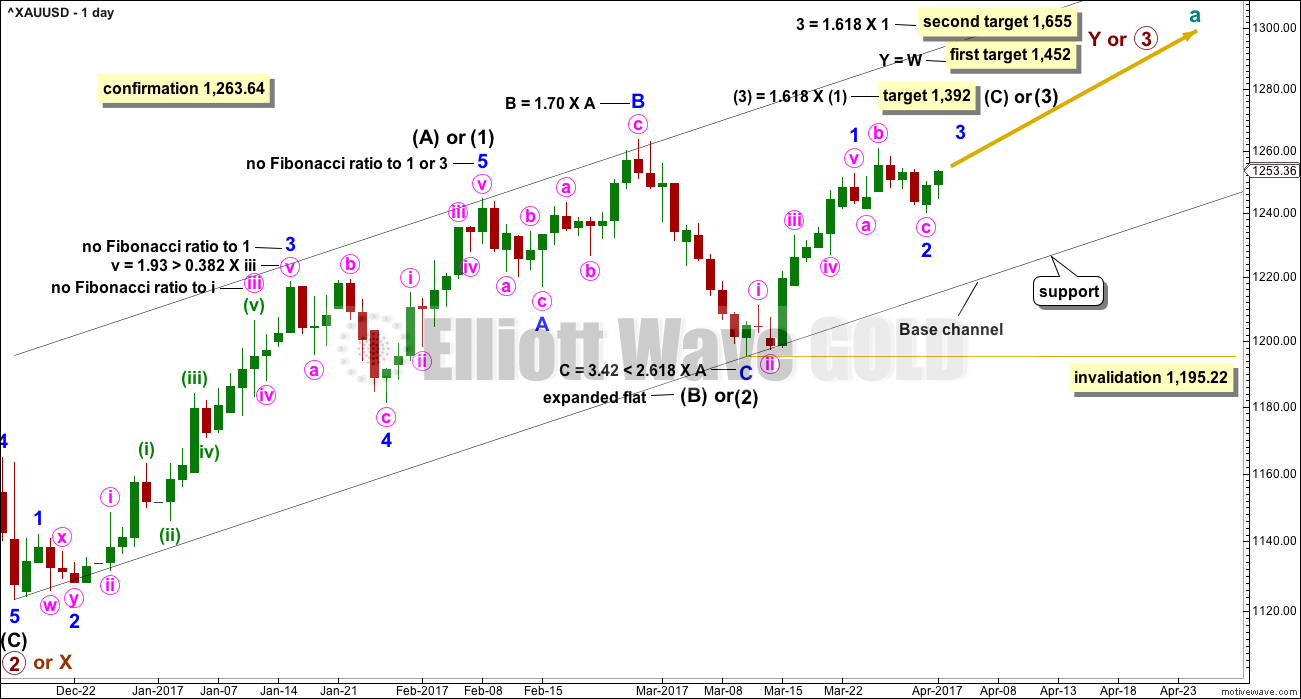
Upwards movement at primary degree is either a third wave (first weekly chart) to unfold as an impulse, or a Y wave (second weekly chart) to unfold as a zigzag. If upwards movement is a zigzag for primary wave Y, then it would be labelled intermediate waves (A) – (B) and now (C) to unfold.
Intermediate wave (1) or (A) is a complete five wave impulse lasting 39 days. Intermediate wave (2) or (B) looks like an expanded flat, which is a very common structure.
So far, within intermediate wave (3) or (C), the first wave up for minor wave 1 looks complete.
Two wave counts are again provided today at the hourly chart level.
The first wave count expects that today’s upwards movement was the second day of minor wave 3 within intermediate wave (3) within primary wave 3. However, volume does not support this view.
The alternate wave count looks at the possibility that minor wave 2 is not yet over and my continue for a few days yet to the original target at 1,230. The alternate hourly wave count today illustrates the risk here to any long positions. It is essential that any members who have entered long use stops and manage risk carefully. Do not invest more than 1-5% of equity on any one trade.
Minor wave 2 may not move beyond the start of minor wave 1 below 1,195.22.
HOURLY CHART
Click chart to enlarge.
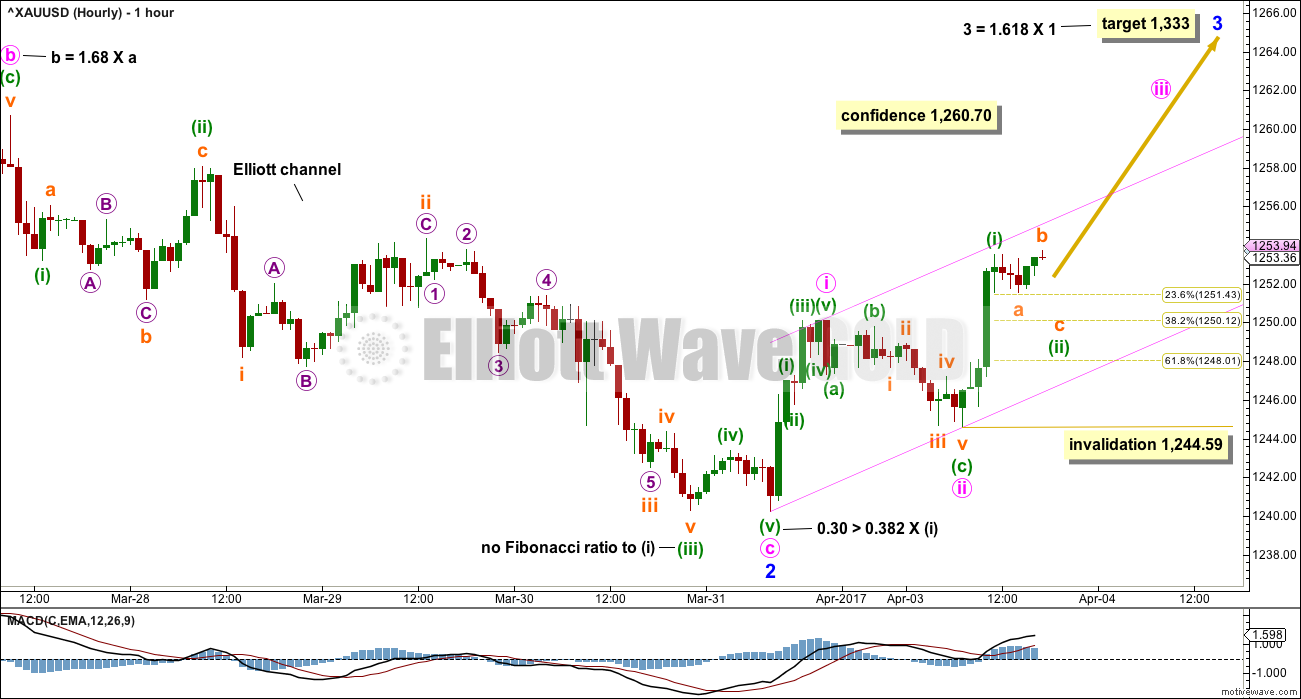
It is possible that minor wave 2 is over as a completed expanded flat correction. Minute wave c would be 1.51 longer than 1.618 the length of minute wave a. Minute wave c ends slightly below minute wave a, so a truncation is avoided.
The last downwards wave here labelled minuette wave (v) will fit neatly as an ending expanding diagonal on the five minute chart.
Minute wave ii is a deep zigzag. If this hourly wave count is correct, this is where minute wave iii should have begun.
This wave count now expects that Gold is just beginning the middle of a large and powerful third wave up. It should have support from volume, it should exhibit an increase in upwards momentum, and it should begin to move price very strongly higher within the next 24 hours.
Some further confidence may be had in this first hourly wave count with a new high above 1,260.70.
Minuette wave (ii) may not move beyond the start of minuette wave (i) below 1,244.59.
A target is provided for minor wave 3 to end. No target is provided for minute wave iii because minute wave iv should be expected to be very brief and shallow.
ALTERNATE HOURLY CHART
Click chart to enlarge.
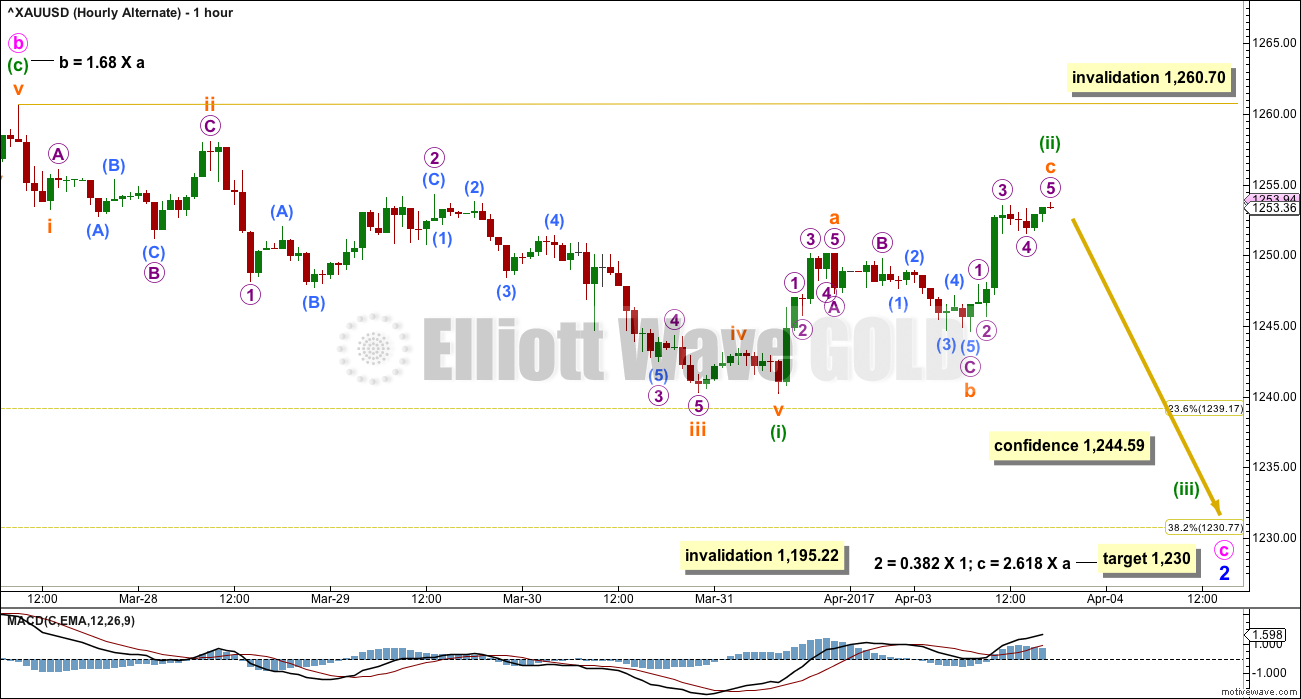
This wave count is identical to the first hourly wave count, except here the degree of labelling within minute wave c of minor wave 2 is just moved down one degree.
The five wave structure downwards may have only been minuette wave (i) within minute wave c. Current upwards movement so far looks like a three wave structure and may be minuette wave (ii) within minute wave c.
Minute wave c must subdivide as a five wave structure. Within minute wave c, minuette wave (ii) may not move beyond the start of minuette wave (i) above 1,260.70.
So far minor wave 2 would have lasted seven days for this alternate wave count. If it continues for another six, it may end in a total Fibonacci thirteen days. This wave count expects overall downwards movement for this week and into next week.
With volume not supporting upwards movement for last Friday and now Monday’s session, this upwards movement does look corrective. Volume analysis favours this alternate wave count.
This wave count illustrates the very real risk today to any long positions.
ALTERNATE ELLIOTT WAVE COUNT
DAILY CHART
Click chart to enlarge.
This alternate wave count is in response to queries from members.
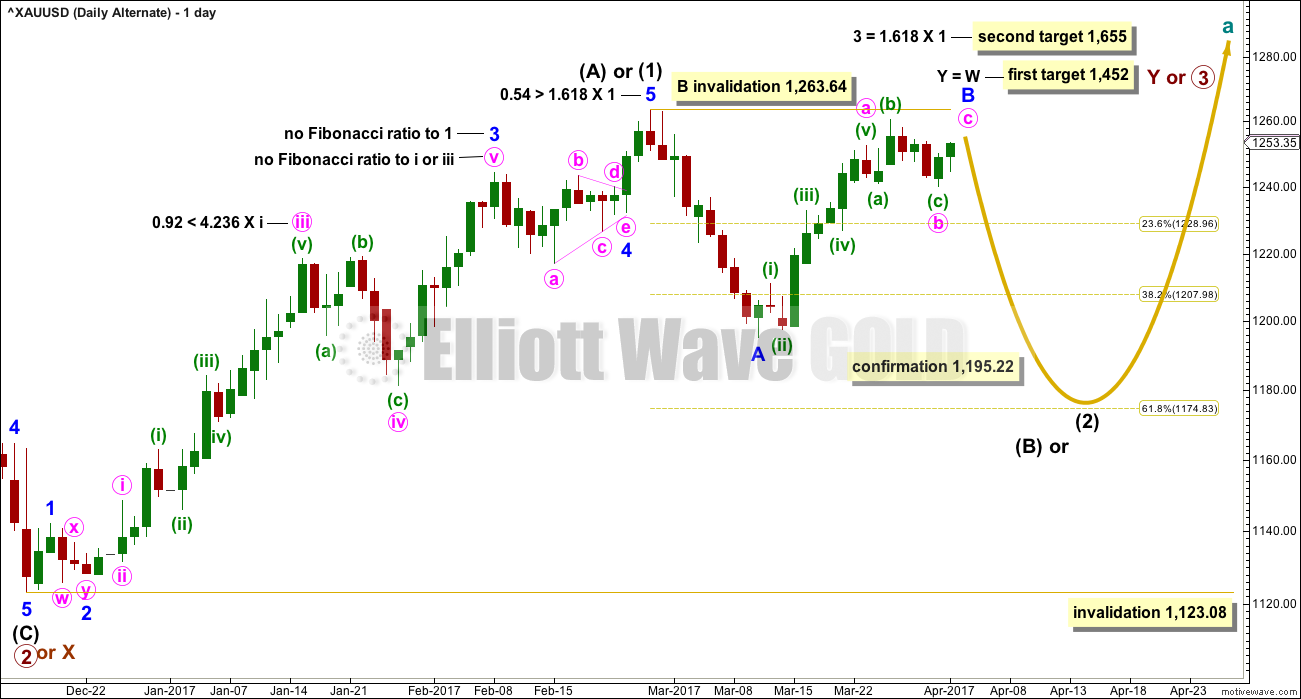
Fibonacci ratios are noted on both daily charts, so that members may compare the main and alternate wave counts. This alternate wave count has slightly better Fibonacci ratios. This gives this wave count a reasonable probability. Due mostly to volume, this wave count is judged to have a lower probability than the main wave count.
At this stage, this wave count would be considered confirmed if price makes a new low below 1,195.22. At that stage, the target for intermediate wave (2) or (B) to end would be the 0.618 Fibonacci ratio of intermediate wave (1) or (A) at 1,175.
Labelling today within minor wave B is changed. This alternate now needs to see a five wave structure upwards complete for minute wave c. Minor wave B may not move beyond the start of minor wave A above 1,263.64.
TECHNICAL ANALYSIS
WEEKLY CHART
Click chart to enlarge. Chart courtesy of StockCharts.com.
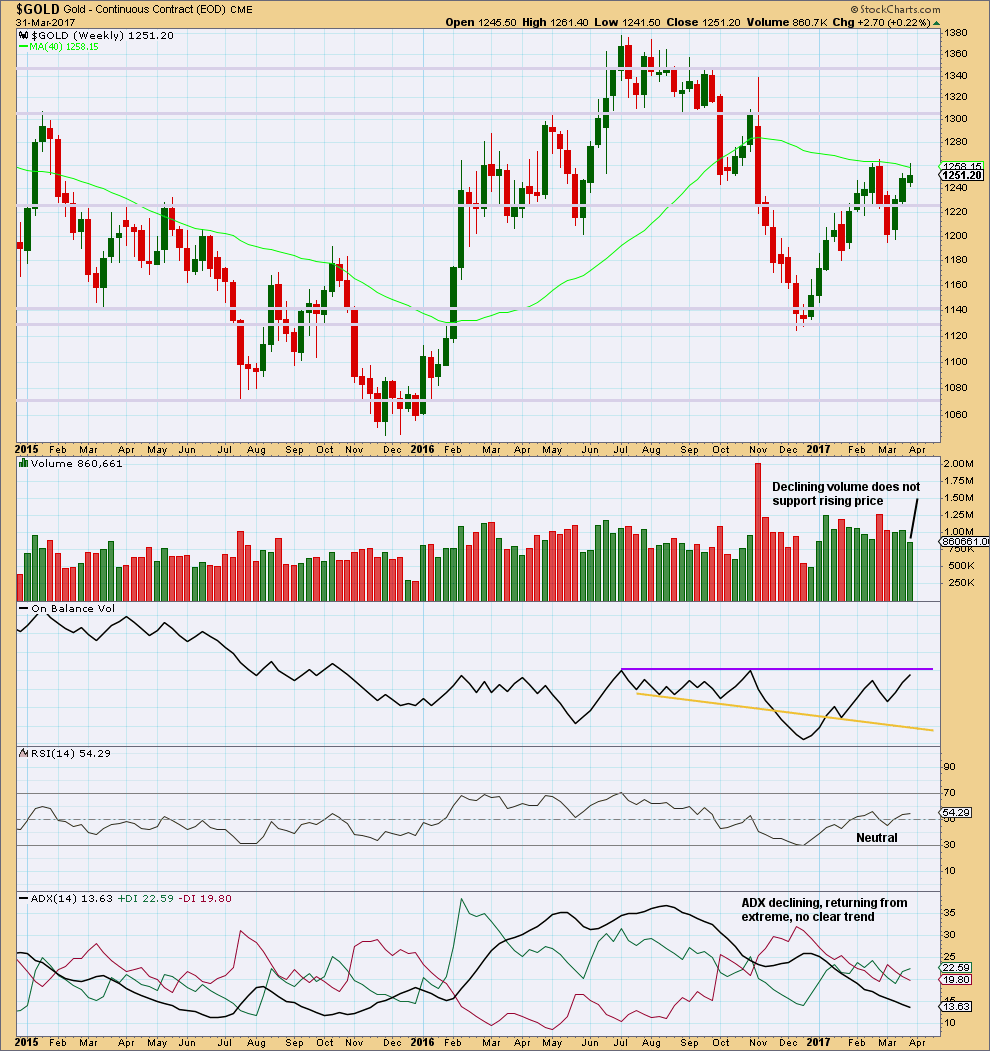
The small real body and long upper wick for the third weekly candlestick completes a stalled candlestick pattern. “It indicates bulls strength has been at least temporarily exhausted. A stalled candlestick pattern should be used to liquidate or protect longs, but usually not to short. It is generally more consequential at higher price levels.” (Nison, “Japanese Candlestick Charting Techniques”, page 100).
Lighter volume for the last upwards week is also concerning for bulls.
On Balance Volume is very close to resistance, but not quite there yet.
This weekly chart offers slightly more support to the alternate hourly Elliott wave count than the main hourly Elliott wave count.
DAILY CHART
Click chart to enlarge. Chart courtesy of StockCharts.com.
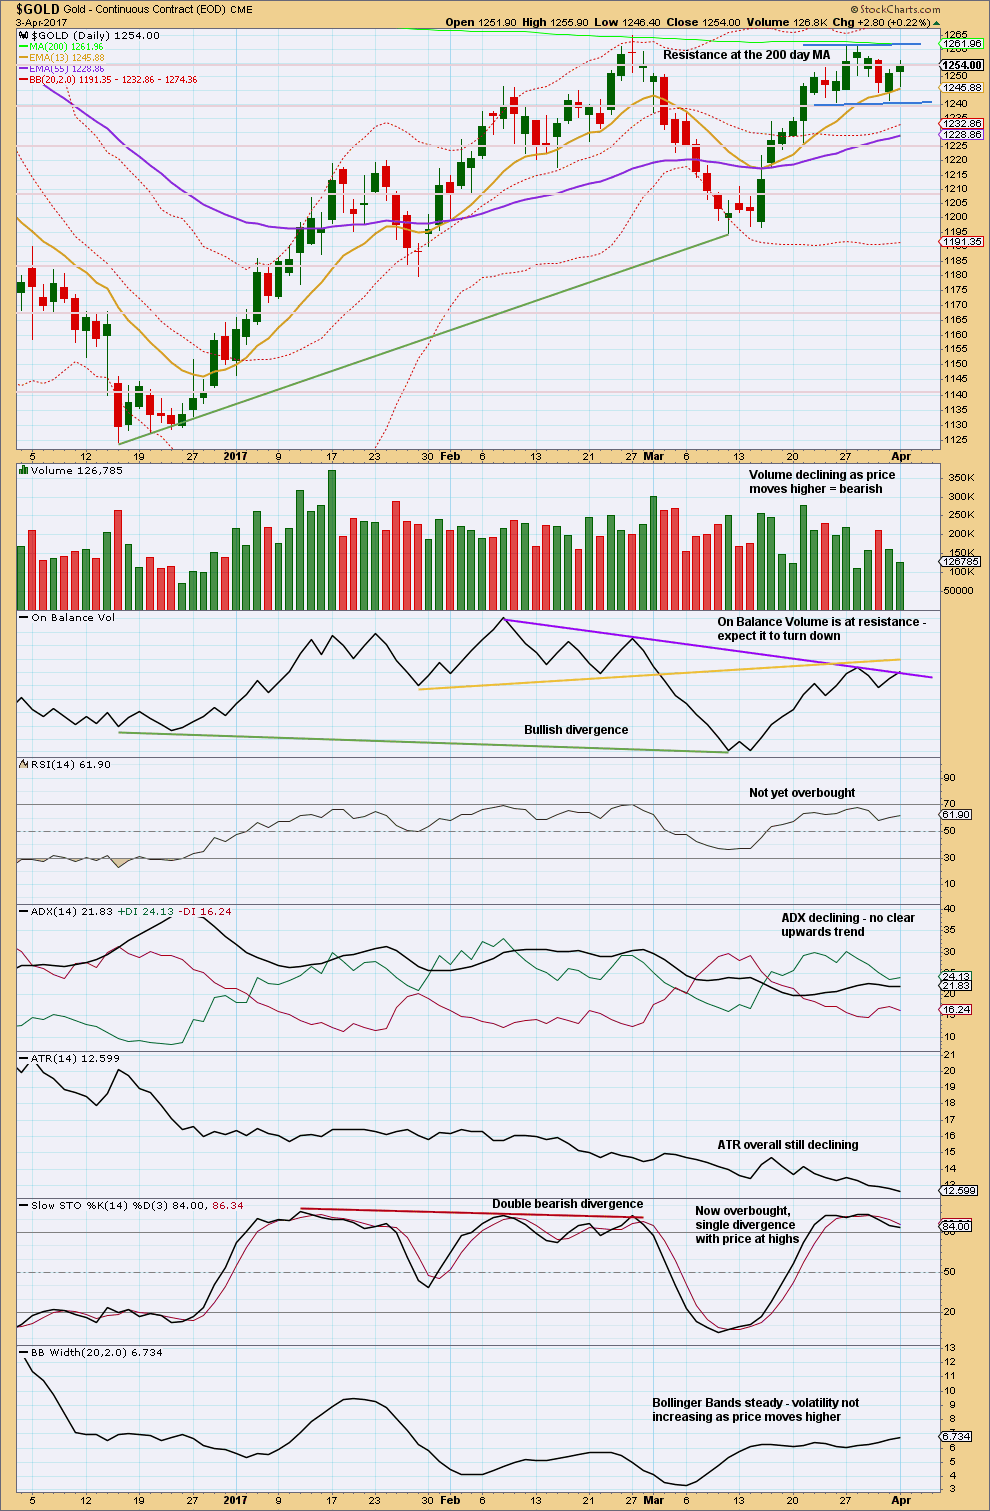
Volume for the last two upwards days does not support the rise in price. This is very concerning now for bulls.
Price is range bound. It looks like a small flag pattern may be moving sideways. Flags are more reliable when they have a slope against the prior trend; this one is not sloped.
Volume declines as price moves sideways and this supports the flag pattern.
Flags are one of the most reliable continuation patterns. The breakout when the consolidation is done is expected to be upwards. In the mid term, this supports the main daily wave count but makes no comment on exactly when the breakout will come.
It is the downwards session of the 23rd of March that has strongest volume during the consolidation suggesting the breakout may be downwards. This conflicts with the expectation of the flag pattern.
On Balance Volume supports the alternate hourly wave count as it expects a red daily candlestick for Tuesday.
ADX, ATR and Bollinger Bands all are in agreement that this market is most likely consolidating.
At this stage, the lack of support from volume is very concerning for long positions. If members have open long positions, it is essential that stops are used to protect your account. If members have not yet entered this market, they would best be advised to wait patiently for a classic breakout and then enter in the direction of the next trend.
GDX
DAILY CHART
Click chart to enlarge. Chart courtesy of StockCharts.com.
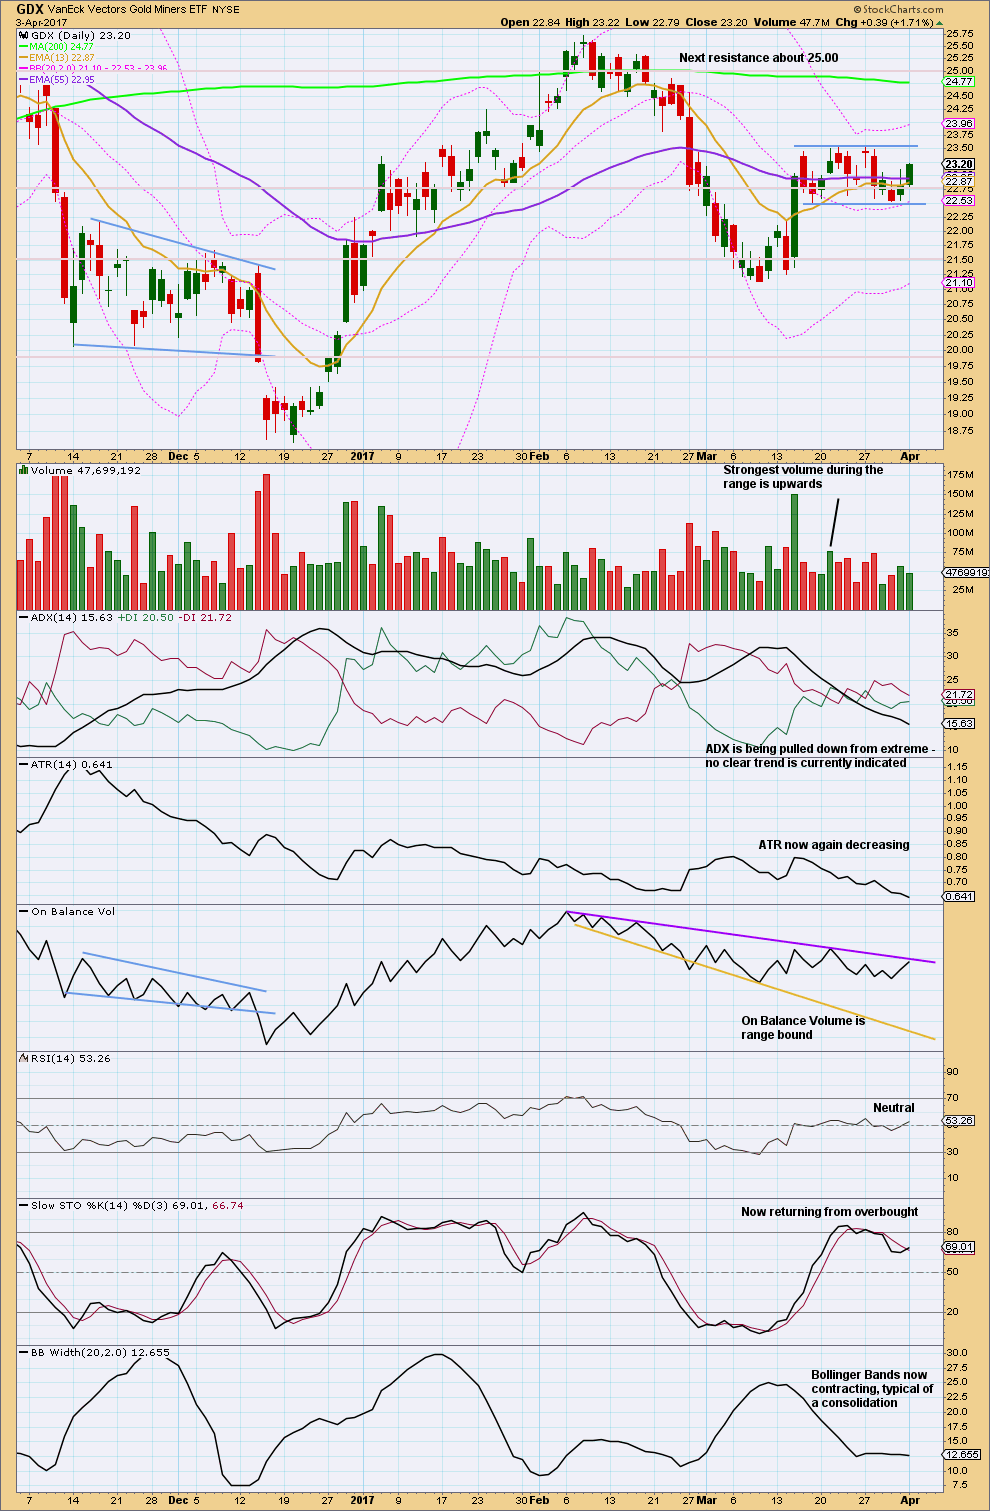
The bottom line for GDX is that it remains range bound. Volume suggests an upwards breakout is still more likely than downwards, but not by much. While this technique works more often than it fails, it is not certain.
This analysis is published @ 06:56 p.m. EST.
Finally, price had made a new low as the whole or part of the C wave for minuette 4.
Been waiting up all day for it (see my posts below), and it had to happen after market close.
Yes, GDX still is range bound. Volume today for it is very light. It’s quite pathetic really.
The session is closed now. I’m sorry everybody I wasn’t here in time to give my normal updated before close.
On Balance Volume gives us a bullish signal today. The line has been tested only 3 times before and has a reasonable slope, but it is fairly long held so it has some small technical significance. So this signal today is not a strong one, but we should still heed it.
Price made a slight new high above 1,260.70 so that’s another slight bullish signal.
Volume today shows a slight increase, but is still light. Another small bullish signal.
Things today are looking a little more bullish than the last two days.
But price is still range bound. Today’s candlestick has a long upper wick, that’s a bit bearish. Volume is still light.
While this chart expects a fifth wave up to complete minute i, and minute ii should then move price lower, don’t expect minute ii to be deep or to last long. If anyone wants to use that as an opportunity to join the upwards trend you’ll have to either set an order and get it right, jump in and hold an underwater position for a couple of days (possibly, it may be less) or sit and watch the market closely.
Look out for an explosive upwards movement folks. Be alert. We need more Lerts 🙂
Can I be 2 Lerts??! 🙂
Another bullish sign is 21 DMA starting to curl away from 50 DMA….bullish!!
Yep. I think you’re definitely a Lert Verne. And that’s a good thing 🙂
Doji may not be a worry if OBV has given a bullish signal. Wait and watch.
Lara what price point must be a stoploss for longs now?
Technically it should be at 1,240.24 now. But I think at breakeven would be better if your position is profitable.
GLD and SLV look to be printing dojis today….maybe we get that last leg down overnight…
Are the PM naked shorts in trouble?
We may be about to get a clue.
If price rockets higher from these levels, and I am starting to get a sneaking suspicion…fasten your seatbelts people! 😉
(They will have to attempt an escape by long futures trades, but they are still going to feel pain!)
Silver, the ETFs and miners ignoring Gold’s decline…curious….!
how does this forecast rise in gold sit with the rise in USD which I believe Lara was forecasting?
My USD wave count is changed substantially. I’m expecting it to decline.
1263.7. From Lara: “Some further confidence may be had in this first hourly wave count with a new high above 1,260.70.”
Lara, your counts and directional calls for gold recently have been spot on. Keep up the great work of being a “Neutral observer” of the markets.
Thank you very much David 🙂
It has been quite fascinating to obseve the almost universal caution on the part of many anslysts normally quite bullish. Everyone it seems, including me, is expecting a pullback…wall of worry?! 😫
Gold is struggling to break resistance around $1,260. Once that breaks, a quick move to the next downtrend resistance around $1,280 should occur. I think the pullback here will be shallow.
That’s absolutely true. I’m targeting a pullback at most to 1255. It should then be followed by a strong wave up, the third in 6 degrees.
Alan… expecting your wave up now?
I’m not too sure yet. The drop should be in 3 waves. This looks more like a 5. What this means is that the low could be the A in an ABC. The correction is deeper than I had thought.
The limit is 1251.55. If it falls lower than that we have an expanded flat at one degree higher.
Does it now look like b is almost finished of the abc down?
Yes, 3 waves. Perfect.
So it will be 5-3-5 double zigzag.
Does it look like c of abc down is now over? Or just half over?
If over, there seems to be truncation. I may just have to wait.
But a little truncation would not be unexpected with the strong pull in a wave 3 up.
Great analysis lara.
And thanks for trading advice you give. Its really helpfull 🙂
Gold is higher right now. What is the current OBV status?
For OBV we will not have data until the session is closed.
Ohh!! Dint knew. Sorry
Here’s a Gold chart similar to the GDX and GDXJ charts previously posted. Looks pretty bullish to me.
https://www.tradingview.com/x/YGZIJY8r/
Yep! 🙂