
The main Elliott wave count expected upwards movement for Tuesday’s session, which is what has happened.
Summary: Look out for strong upwards movement from both Gold and GDX, which may happen within the next 24 hours. The target is at 1,333 in the first instance. If this is wrong, it may not be high enough.
A new low below 1,240.24 would indicate more downwards movement to the original target for this pullback at 1,230.
Trading advice is given under the classic analysis section.
New updates to this analysis are in bold.
Last weekly charts are here and the last video on weekly wave counts is here.
Grand SuperCycle analysis is here.
MAIN ELLIOTT WAVE COUNT
DAILY CHART
Click chart to enlarge.
This daily chart will suffice for both weekly charts.
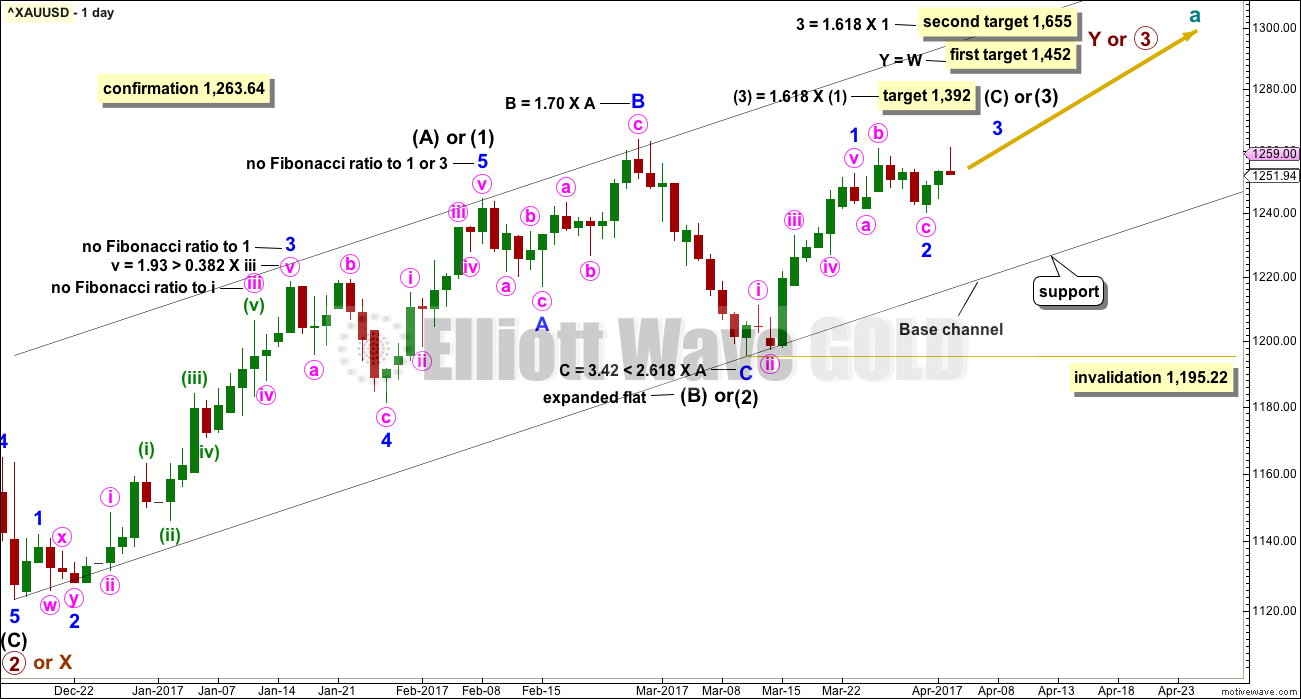
Upwards movement at primary degree is either a third wave (first weekly chart) to unfold as an impulse, or a Y wave (second weekly chart) to unfold as a zigzag. If upwards movement is a zigzag for primary wave Y, then it would be labelled intermediate waves (A) – (B) and now (C) to unfold.
Intermediate wave (1) or (A) is a complete five wave impulse lasting 39 days. Intermediate wave (2) or (B) looks like an expanded flat, which is a very common structure.
So far, within intermediate wave (3) or (C), the first wave up for minor wave 1 looks complete.
Two wave counts are again provided today at the hourly chart level.
The first wave count expects that today’s upwards movement was the third day of minor wave 3 within intermediate wave (3) within primary wave 3. A slight increase in volume for today’s upwards session gives some support to this wave count, but volume is still light overall.
A new alternate wave count looks at the possibility that minor wave 2 is not yet over and my continue for a few days yet to the original target at 1,230. The alternate hourly wave count today illustrates the risk here to any long positions. It is essential that any members who have entered long use stops and manage risk carefully. Do not invest more than 1-5% of equity on any one trade.
Minor wave 2 may not move beyond the start of minor wave 1 below 1,195.22.
HOURLY CHART
Click chart to enlarge.
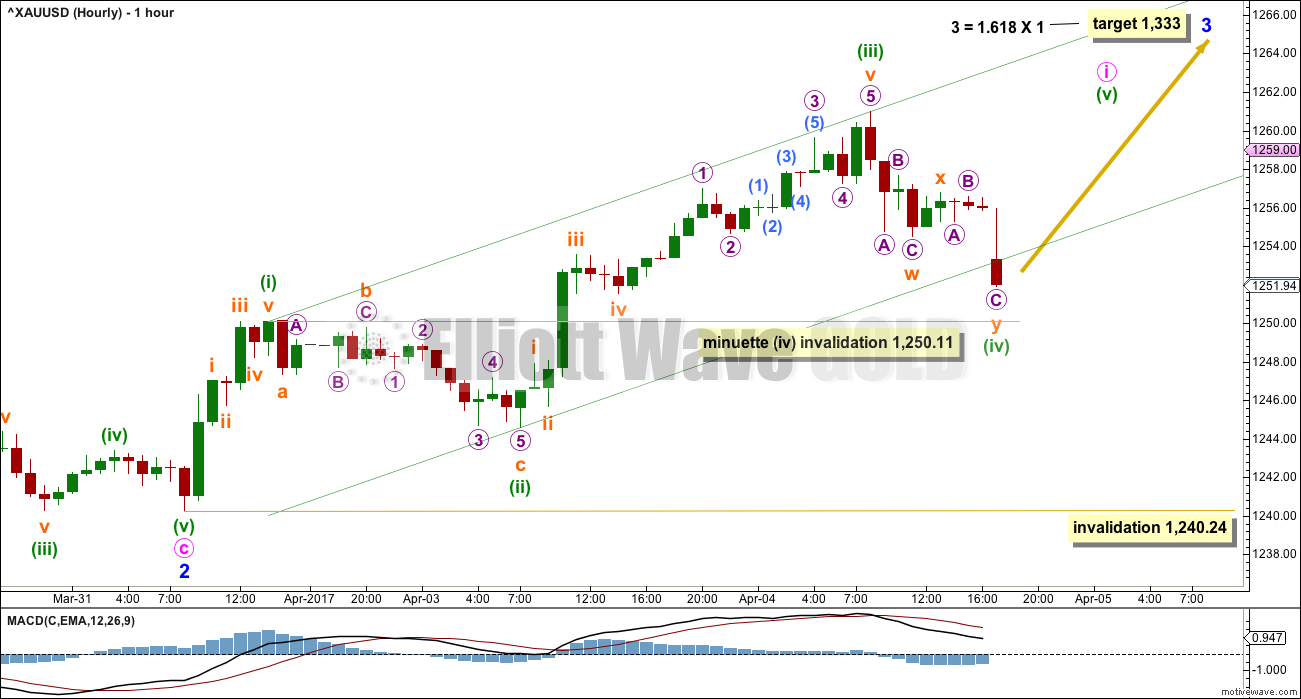
It is possible that minor wave 2 is over as a completed expanded flat correction. Minute wave c would be 1.51 longer than 1.618 the length of minute wave a. Minute wave c ends slightly below minute wave a, so a truncation is avoided.
Minor wave 3 may only subdivide as an impulse. Gold’s third waves often exhibit swift and strong fifth wave extensions. Minor wave 3 may end with a blowoff top.
Within minor wave 3, minute wave i may be incomplete. Within minute wave i, minuette wave (iii) is 0.44 longer than 1.618 the length of minuette wave (i).
Minuette wave (iv) may not move into minuette wave (i) price territory below 1,250.11. If a new low below 1,250.11 is seen before a new high, then this analysis of minute wave i would be wrong. At that stage, minute wave i would be labeled as complete and downwards movement would be labeled as minute wave ii.
When minute wave i is complete, then minute wave ii may be a quick shallow correction. It may not move beyond the start of minute wave i below 1,240.24.
The next wave up for Gold should exhibit a strong increase in upwards momentum and should have strong support from volume if this main hourly wave count is correct.
A target is provided for minor wave 3 to end. No target is provided for minute wave iii because minute wave iv should be expected to be very brief and shallow.
ALTERNATE HOURLY CHART
Click chart to enlarge.
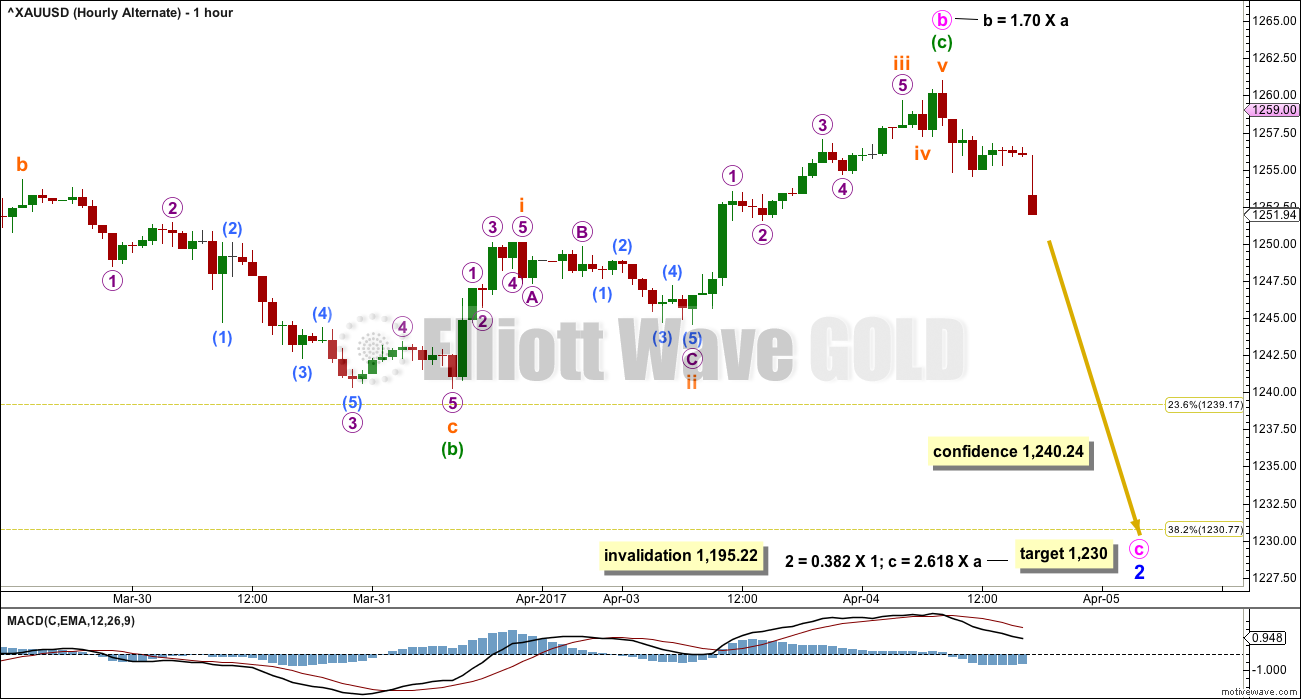
This idea is new today.
Within minor wave 2, it is possible that only minute wave b ended today.
Minute wave b is longer than the common length of up to 1.38 times the length of minute wave a, but still within the allowable convention of up to 2 times the length of minute wave a.
If minute wave b has ended today, it would subdivide as a regular flat correction.
If price makes a new low below 1,240.24, the main hourly wave count would be invalidated and this alternate hourly wave count would be confirmed. At that stage, expect more downwards movement to the original target for minor wave 2 at 1,230.
ALTERNATE ELLIOTT WAVE COUNT
DAILY CHART
Click chart to enlarge.
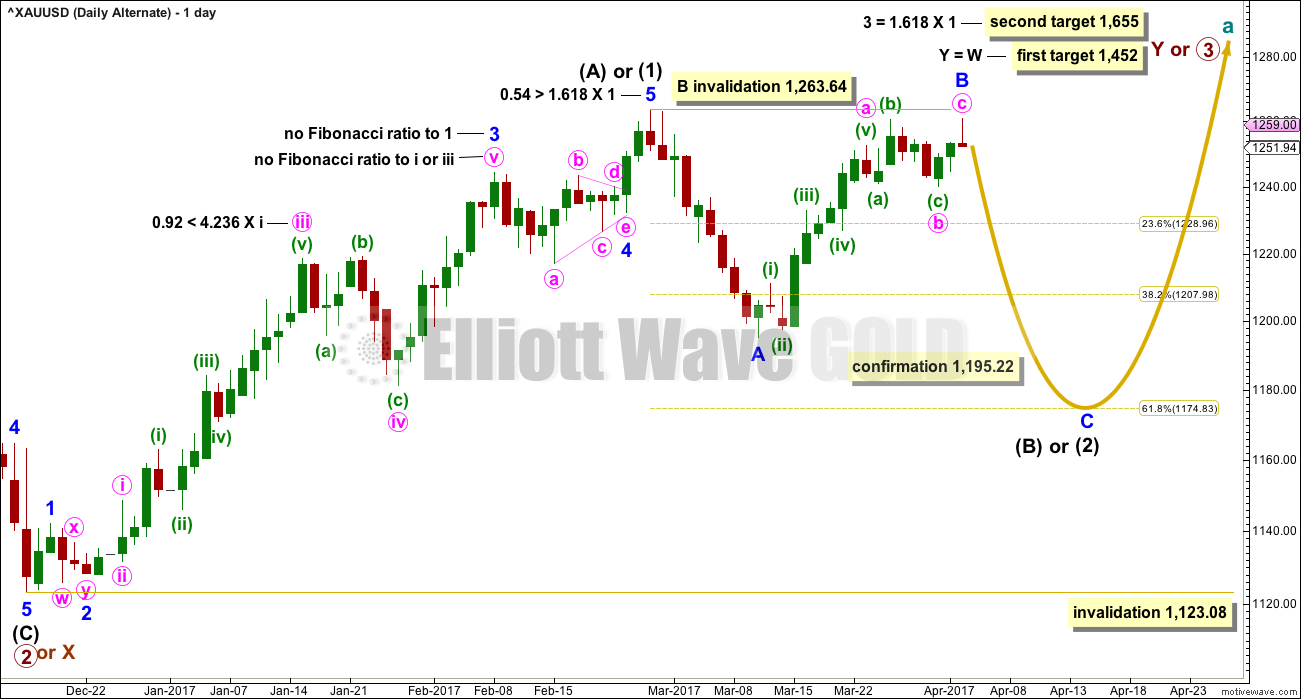
This alternate wave count is in response to queries from members.
Fibonacci ratios are noted on both daily charts, so that members may compare the main and alternate wave counts. This alternate wave count has slightly better Fibonacci ratios. This gives this wave count a reasonable probability. Due mostly to volume, this wave count is judged to have a lower probability than the main wave count.
At this stage, this wave count would be considered confirmed if price makes a new low below 1,195.22. At that stage, the target for intermediate wave (2) or (B) to end would be the 0.618 Fibonacci ratio of intermediate wave (1) or (A) at 1,175.
Minor wave B may not move beyond the start of minor wave A above 1,263.64.
TECHNICAL ANALYSIS
WEEKLY CHART
Click chart to enlarge. Chart courtesy of StockCharts.com.
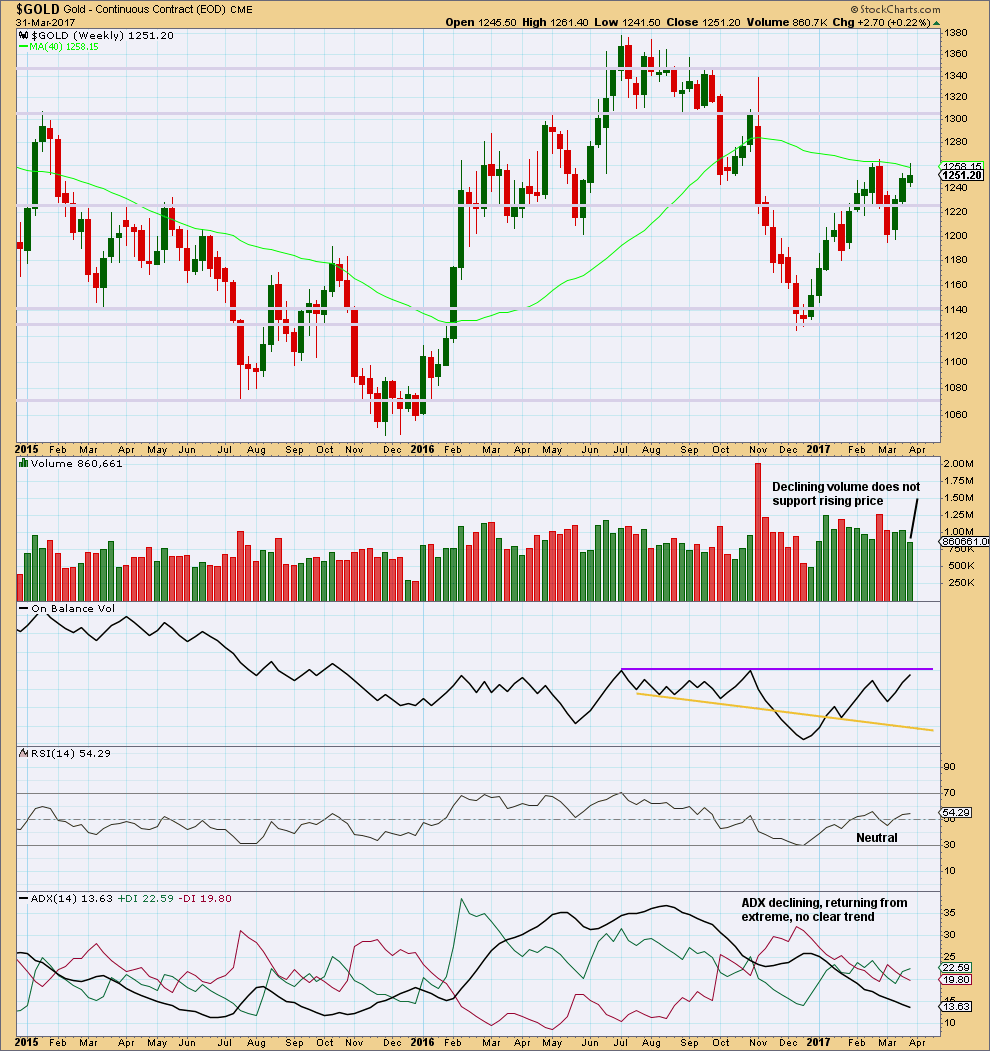
The small real body and long upper wick for the third weekly candlestick completes a stalled candlestick pattern. “It indicates bulls strength has been at least temporarily exhausted. A stalled candlestick pattern should be used to liquidate or protect longs, but usually not to short. It is generally more consequential at higher price levels.” (Nison, “Japanese Candlestick Charting Techniques”, page 100).
Lighter volume for the last upwards week is also concerning for bulls.
On Balance Volume is very close to resistance, but not quite there yet.
This weekly chart offers slightly more support to the alternate hourly Elliott wave count than the main hourly Elliott wave count.
DAILY CHART
Click chart to enlarge. Chart courtesy of StockCharts.com.
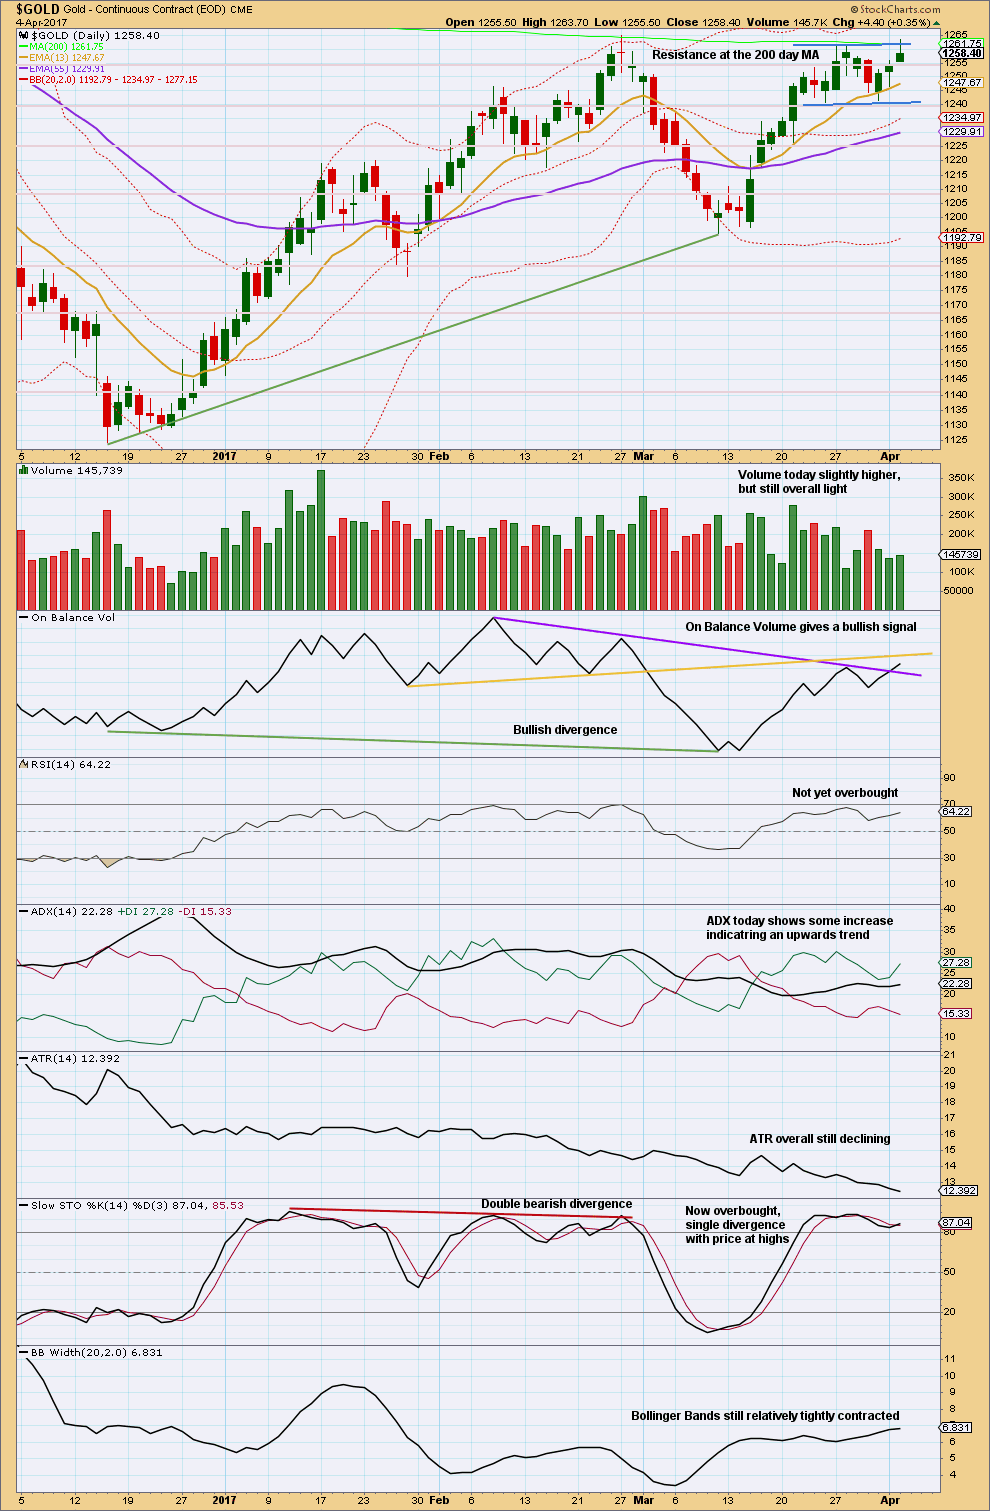
Another upwards day has some small support from volume, but volume remains relatively light. The bottom line is Gold is still range bound.
This looks like a flag pattern. Flags are reliable continuation patterns, and here the breakout would be expected to be upwards. Flags are normally accompanied by declining volume as price moves sideways.
On Balance Volume today gives an important bullish signal with a break above the purple trend line. This line has only been tested three times before and has a reasonable slope, so these two aspects reduce its technical significance. It has been reasonably long held though, which gives it some significance. The signal today offers good support to the main daily Elliott wave count.
Overall, this chart today is more bullish than yesterday but not strongly bullish.
The longer price continues to move sideways the closer the breakout will be, and the more explosive it may be. Stay alert now for a very strong upwards movement.
Trading advice:
Do not expect the next correction to offer a leisurely entry to this market; it may be over quickly and may be more shallow than expected. Long positions should now be profitable. Move stops to breakeven or just below 1,240.24.
For members still waiting to enter this market use corrections as an opportunity to enter long. Use the channel on the hourly chart. Each time price touches the lower edge presents an opportunity to enter. Stops must technically be set just below 1,240.24. Reduce position size so that only 1-5% of equity is risked.
Alternatively, more cautious members may like to wait for the breakout and then enter in the new trend direction, which is expected to be upwards. This approach requires vigilance.
GDX
DAILY CHART
Click chart to enlarge. Chart courtesy of StockCharts.com.
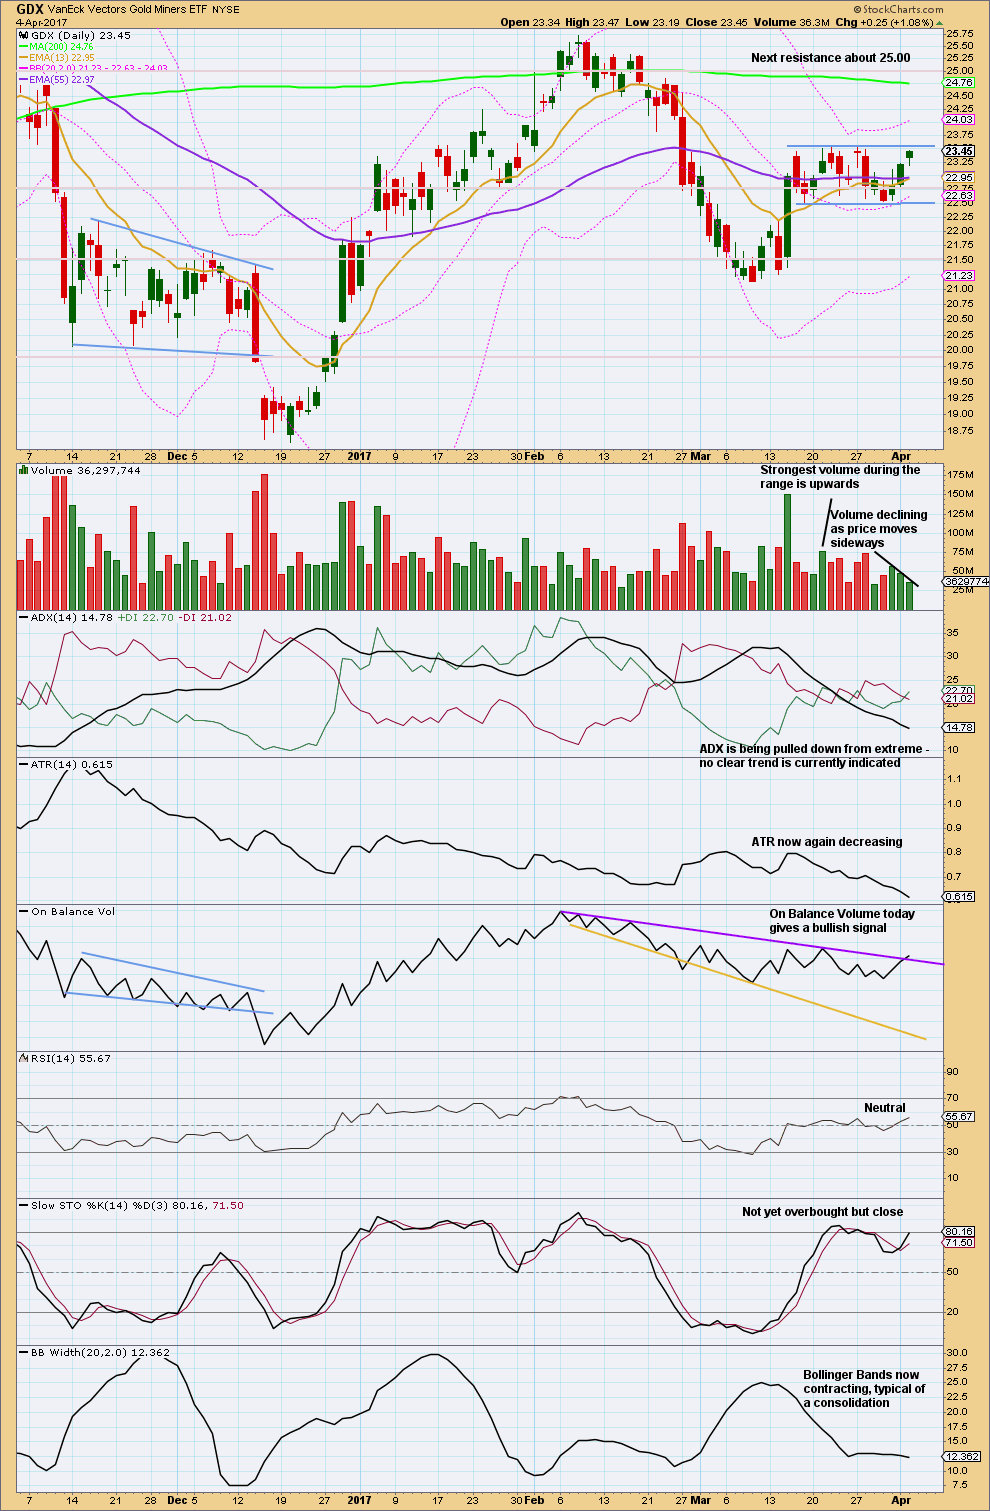
The bottom line for GDX is that it remains range bound. Volume suggests an upwards breakout is still more likely than downwards, but not by much. While this technique works more often than it fails, it is not certain.
On Balance Volume for GDX also gives a bullish signal today. The purple trend line on On Balance Volume is long held, not too steeply sloped, and has been tested five times before. It has good technical significance. This signal should be given reasonable weight. Expect it is now very likely that GDX will break out upwards.
Look out for a strong upwards movement from GDX.
This analysis is published @ 07:02 p.m. EST.
I have had to take a relative for surgery today, and we had a long detour on our route thanks to the tail end of ex Tropical Cyclone Debbie.
That’s why analysis is later than usual. So please accept my apologies.
Home now and analysis will be published shortly.
Thank you all for your patience.
Take your time. Hakuna matata.
If subminuette was complete at 1258.8 wouldn’t wave 2 pull us back to .50 or .62 at 1251.3 and 1249.6 respectively. Personally will be watching .24 first at 1255
Not too sure if Gold price is ready to fly just yet; again facing resistance at 1259-1260. Imo a pullback for break below 1252 to look out for…..
Can someone tell me what Lara means by…. “a third wave up at four degrees”? It sounds powerful, but what does it mean?
Observations for today…. powerful daily candle for gold.
The 10 Year Treasury looks like it’s breaking below support… supports gold’s strength should the 10 Year drop further.
Overall market weakness at the end of today’s trading session suggesting more downside to come possibly?
Third waves should have support from volume and they should have strong momentum.
A third wave at four degrees (minute, minor, intermediate and primary) is the middle portion of a long and strong wave. The trend should be unmistakeable, clear and very profitable.
My labelling yesterday of minute i was wrong, it was all over. This pullback is minute ii for this main wave count.
Now for a third wave up at four degrees….
A move above 23.56 with volume would be nice!!!
Gold holding up good after Fed minutes release.
I’m a bit worried at the miners performance today, GDXJ in particular. Maybe a sign that this correction down is not yet over?
Still waiting…
Dreamer do you think today’s move down in the miners is minute ii of minor 3rd wave up?
Not an easy decision..Ari. I unloaded my short hedge at bottom of this last move down for a very small loss and purchased more longs.
This could still be Lara’s ALT count…minute (b) forming, , but the bigger picture is long. Can always pick up a hedge again.
Almost back to 1251.
Also current upswing looking strong.
Yes very strong turn around! It happened as I was typing my message 🙂 LOL!
It seems like the bottom today was minute ii of minor 3 for the miners. If that’s the case the miners should be rocketing higher from here…
As I said I may be underwater for a bit but this is EXACTLY what I was hoping for.
I am SO glad I waited and kept some dry powder. I’m all in! Like Flynn! Oh…wait, he is out now isn’t he? One of the biggest mistakes Trump ever made. Now the neo-cons are completing the isolation of Trump by forcing out Bannon?? Trump has completely lost his mind….poor man! 🙂
Something is cooking in gold.
We were expecting a strong momentum upside but adp data reversed it. So nonfarm data is also expected to be strong. Markets will remain negative to calm untill friday eve. This means next 48 hrs no upside?
1240 is not too far. Hope to see a good bounce before close. That will give bulls a big relief. I dont want to see a red candle with increased volume. Bull flag intact
Copper rallied more than expectation. 3 wave ABC is visible on charts.
Agreed. I did open a short position on that today 🙂 It should be heading lower after today… 3rd wave down set up at least at 2 degrees.
If the alternate is correct I am going to be underwater on this trade for a bit but this pullback is all I think we are going to get. Commercials are record short Silver but I think they are going to be that way for awhile… 🙂
Verne, do you see the 1230 target or are you suggesting the 1243.5 is the deepest we should see? I’m underwater here too.
I think that while 1230 is a possibility, that it is an improbability… 🙂
I think this is a wave 2 though just finished so it does not fit any of the above scenarios
Previous channel test. Held for now. Added to long position. Closed short hedge at 1hour channel BO. Nice work Lara on the 1240 SL!
Thanks 🙂
I think the Daily alternate is now in play
As is the Main with Minute 1 being completed at yesterday’s high, although I personally prefer that to be minuette 1 instead.
The Main would be invalidated with a low below 1240.24, and the Alternate Hourly confirmed.
Lara. I posted an Ichimoku analysis, but the post is “awaiting moderation”. I find that this almost always happens whenever I post a chart that I annotate. I have no problem with posting charts verbatim from the Internet. Strange?
One of my favourite indicators, the Ichimoku Cloud, shows gold to be in a bullish trend. (I love this method of analysis as it identifies the trend direction, gauges momentum, defines support and resistance, and provides clear trading signal — good for lazy people like me).
Why is the gold trend considered bullish?
(1) The cloud is currently green, implying bullish.
(2) Prices lie above the cloud, implying strongly bullish.
(3) The tenkan-sen (blue) crosses the kijun-sen (red) from below while above the cloud. This action is similar to a bullish MACD cross. This is the textbook Ichimoku signal for a trend change.
Cloud support is at the top boundary of the green cloud.
Lara
Hourly red candle shown in your chart with a low of 1250.11 is not shown on the platform im using. Neither on investing.com too..
Roopa, gold is a world market with many different data feeds. Similar, but with small differences. It’s not something that we can solve. Lara imports Barchart data into Motivewave. If you want to follow the same data to verify her confirmation and invalidation points, you can use this link
https://www.barchart.com/forex/quotes/%5EXAUUSD/technical-chart#/technical-chart?plot=CANDLE&volume=0&data=I:30&density=X&pricesOn=1&asPctChange=0&logscale=0&im=30&sym=%5EXAUUSD&grid=1&height=500&studyheight=100
Thank you dreamer
not looking too good for the bulls!
Thanks Lara
Thank you Dreamer, very interesting!
Hi Lara, I have a bit of trouble squaring the potential rise in gold to the predicted fall in the other commodities like oil and copper? What would you say to this?
Nick, Lara may have a better answer, but here’s a comparison of Oil and Gold. There appears to be periods of time, weeks to months where they don’t track each other that well. This could be one of those times.
https://www.tradingview.com/x/YTjGZ3dd/
Exactly right, thanks Dreamer.
Don’t assume they’re correlated, they may not be.
Should really calculate the correlation co-efficient of each market to each other. That would give an accurate mathematical answer.
So, turns out it’s super easy to calculate the correlation co-efficient in StockCharts. Thanks StockCharts! Darn, I really love that resource.
Turns out Gold and Copper aren’t correlated. Not at all.
For them to be positively correlated the correlation co-efficient should sit between 0.5 to 1, for a negative correlation it should sit between -0.5 – -1.
As you can see, it fluctuates between 1 and -1 with plenty of time spent between 0.5 to -0.5. No correlation.
I just looked at $GOLD to $WTIC on stock charts.
No correlation.
GDX is moving up as expected. It can be difficult to get all the small waves correct until the pattern fully unfolds, so I don’t recommend trying to trade them. Just stay long. Best wishes to all.
https://www.tradingview.com/x/8Kmm0UDw/
For members holding profitable Copper positions:
Copper looks like it has competed a five down. Now expect a bounce for a small three up. It should not make a new high above 2.717, and it should find strong resistance at the blue base channel here.
This may present an opportunity to add to short positions.
The bounce may be brief, hold on for a third wave down at two degrees.
Profitable positions should have stops moved to breakeven by now.
Traders who prefer a much shorter time frame may like to take profits.
My reference to a five down is at the hourly chart level, not the daily.
Hi Lara, do you have any suggestions for Oil? Its upward movement seems unstoppable.
Why yes, I do. Just published 🙂
thank you! 🙂