
A strong upwards movement was expected on Friday. This is what happened, but then price reversed and retraced almost all of the upwards movement.
Summary: On Balance Volume at the daily and possibly also weekly chart levels gives bullish signals for Gold. This should be given reasonable weight. The main wave count is still favoured for this reason. It expects upwards movement towards 1,333 in the first instance, with the next target at 1,392.
If price breaks below 1,244.72 on Monday, then a new alternate may be unfolding. It expects downwards movement to end about 1,237 to 1,235 on Thursday.
New updates to this analysis are in bold.
Last weekly charts are here and the last video on weekly wave counts is here.
Grand SuperCycle analysis is here.
MAIN ELLIOTT WAVE COUNT
DAILY CHART

Click chart to enlarge.
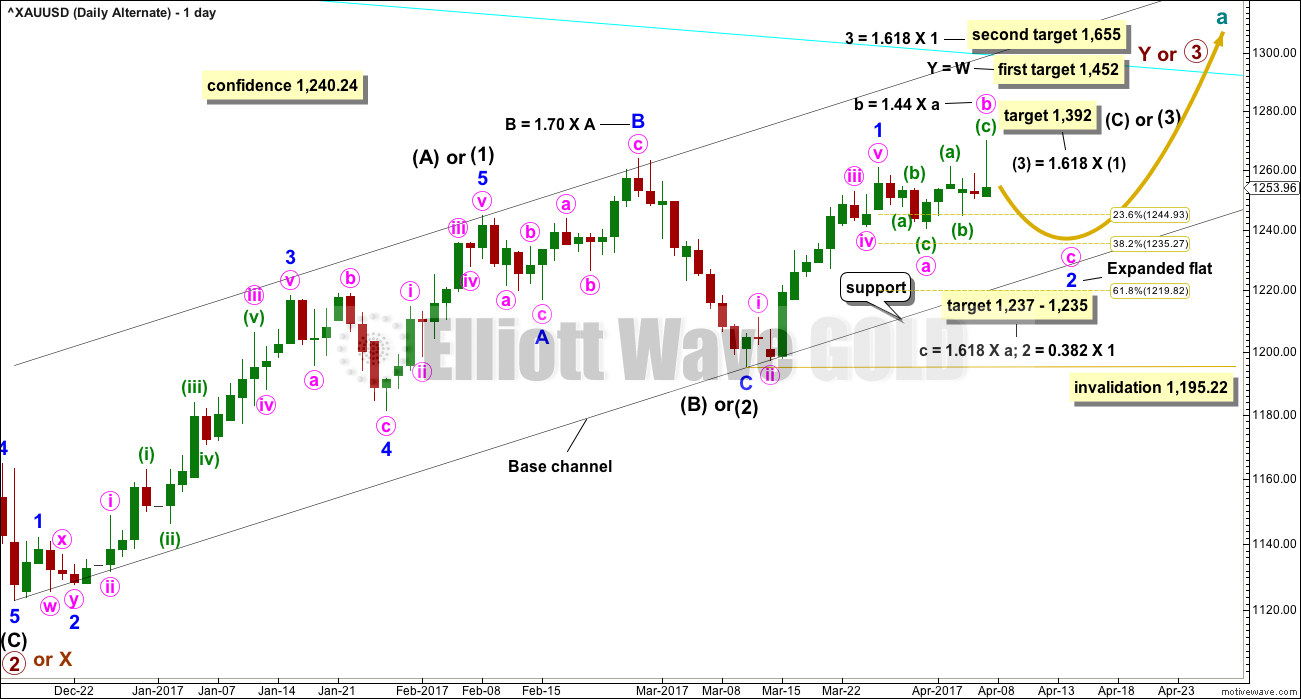
This daily chart will suffice for both weekly charts.
Upwards movement at primary degree is either a third wave (first weekly chart) to unfold as an impulse, or a Y wave (second weekly chart) to unfold as a zigzag. If upwards movement is a zigzag for primary wave Y, then it would be labelled intermediate waves (A) – (B) and now (C) to unfold.
Intermediate wave (1) or (A) is a complete five wave impulse lasting 39 days. Intermediate wave (2) or (B) looks like an expanded flat, which is a very common structure.
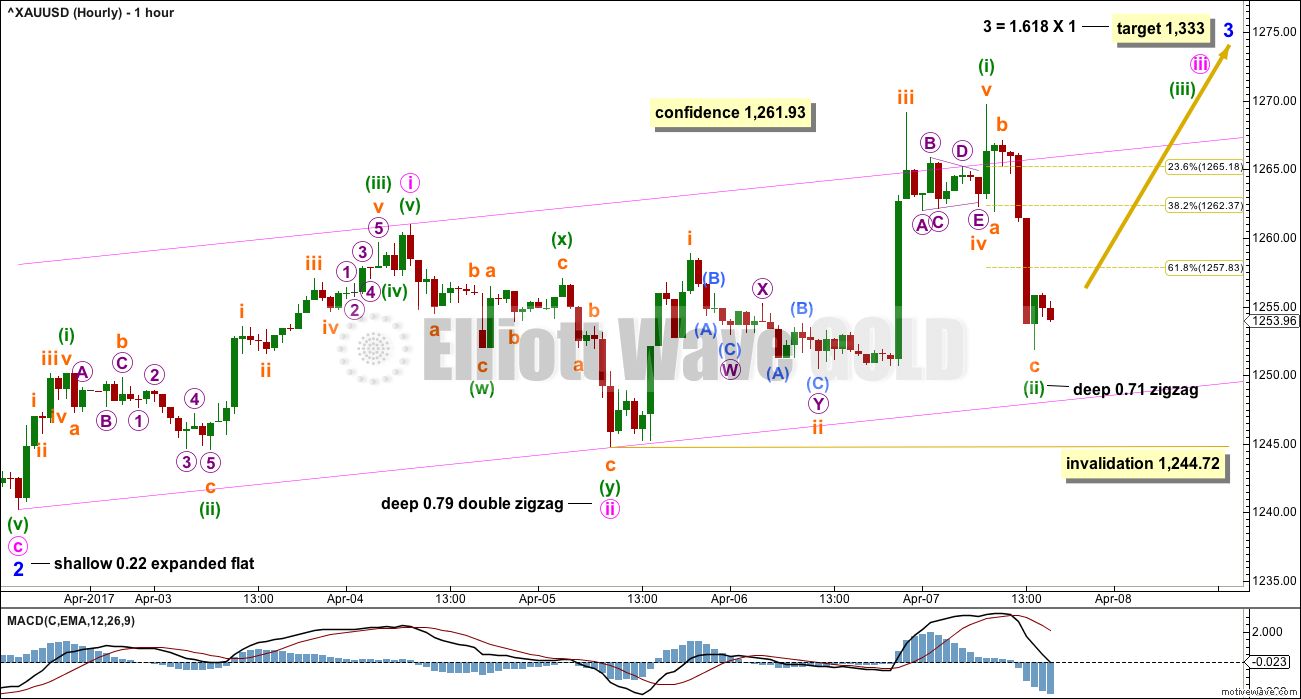
So far, within intermediate wave (3) or (C), the first wave up for minor wave 1 looks complete.
If minor wave 2 is over, then within minor wave 3 no second wave correction may move beyond the start of its first wave below 1,240.24.
HOURLY CHART
Click chart to enlarge.
There would now be five overlapping first and second waves for this main wave count: minuette, minute, minor, intermediate, and primary. When third waves extend in their middle (which is very common), then this is how they necessarily begin, with a series of first and second waves. At this point in the wave count, there is a winding up of potential energy that may be released in explosive upwards movement when the middle of the third wave arrives.
Gold has a tendency, typical of commodities, to exhibit very strong fifth waves. This tendency is most commonly seen for the fifth waves that end its third wave impulses. One or more of minor wave 3, intermediate wave (3), and primary wave 3 may exhibit blow off tops.
Gold often exhibits strong extended third waves and even stronger fifth waves.
No target is given for minute wave iii to end because the following correction for minute wave iv may be very brief and shallow. As the middle of the third wave unfolds corrections along the way up may be increasingly brief and shallow, offering only the briefest of opportunities to join the trend.
It is concerning for this wave count that after the shallow correction of minor wave 2 the next two second wave corrections for minute and minuette degree second waves are both deep.
Some confidence may be had in this wave count if a new high above 1,261.93 occurs on Monday. If this wave count is correct, then that price point should be passed easily on Monday.
Minuette wave (ii) may not move beyond the start of minuette wave (i) below 1,244.72. If that price point is passed on Monday, then the alternate below may be favoured. However, before invalidation, this wave count would substantially reduce in probability if price breaks below the pink base channel drawn here about minute waves i and ii. If this wave count is correct, that trend line should offer very strong support.
ALTERNATE ELLIOTT WAVE COUNT
DAILY CHART
Click chart to enlarge.
The prior alternate daily wave count was invalidated on Friday with a new high above 1,263.64.
This alternate daily wave count is new and sees minor wave 1 ending two days later than the main wave count. Thereafter, minor wave 2 may be unfolding as another expanded flat correction. Expanded flats are very common structures.
This wave count fits in terms of all subdivisions on the hourly chart. Within minor wave 2, the correction for minute wave b at 1.44 times the length of minute wave a is only a little longer than the common range of up to 1.38, but well within the allowable convention of up to 2.
This alternate wave count would expect it is very likely that downwards movement next week should continue and end at least below 1,240.24, so that minute wave c moves below the end of minute wave a in order to avoid a truncation and a very rare expanded flat correction.
The target expects the most common Fibonacci ratio for minute wave c, which coincides with a reasonably common Fibonacci ratio for minor wave 2. The target for this wave count has a good probability.
A new low below 1,240.24 would see any variation of the main wave count invalidated and provide reasonable confidence in this alternate wave count.
Minor wave 2 may not move beyond the start of minor wave 1 below 1,195.22. Downwards movement, if it continues below the target, should find very strong support at the lower edge of the black base channel. That trend line should not be breached for this wave count.
HOURLY CHART
Click chart to enlarge.
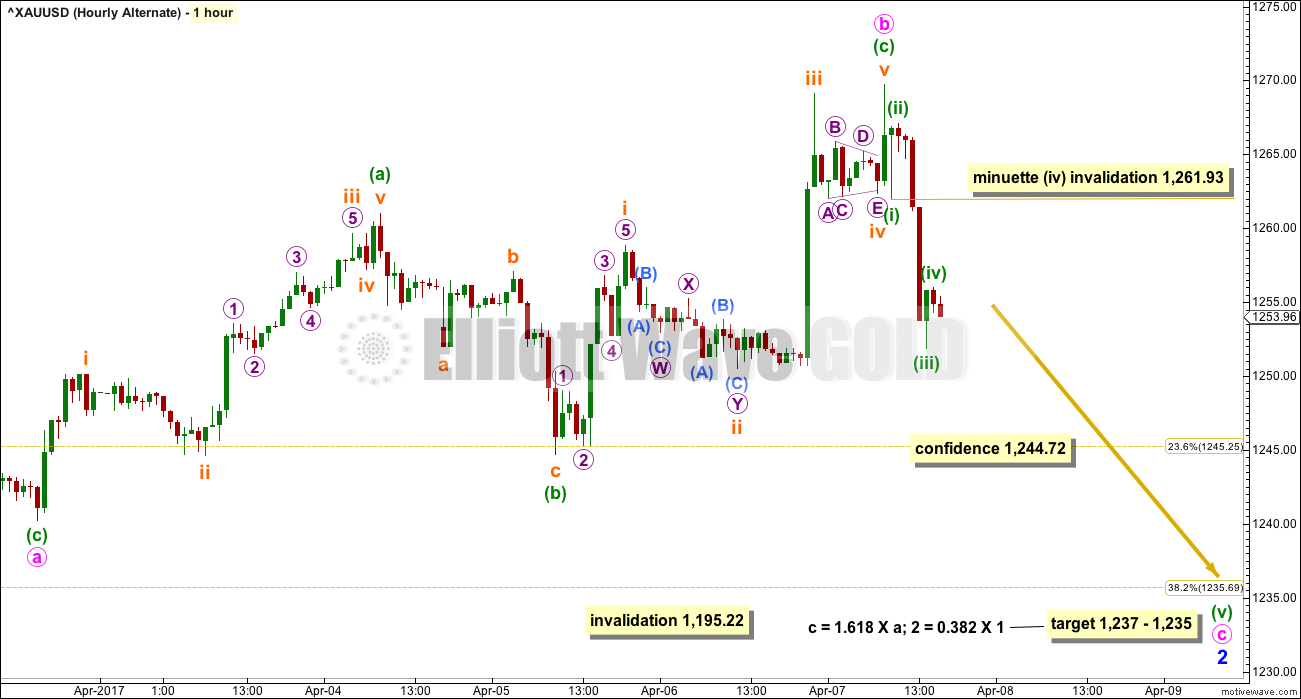
This alternate wave count must see recent upwards movement as the completion of minute wave b, subdividing as a zigzag.
Minute wave c must subdivide as a five wave structure, either an ending diagonal or an impulse. An impulse is the more common structure, so more likely, and at this stage that is what it looks like.
Minuette wave (iv) may not move into minuette wave (i) price territory above 1,261.93.
If downwards movement continues to Thursday the 13th of April, then minor wave 2 may complete in a Fibonacci 13 sessions total.
TECHNICAL ANALYSIS
WEEKLY CHART
Click chart to enlarge. Chart courtesy of StockCharts.com.
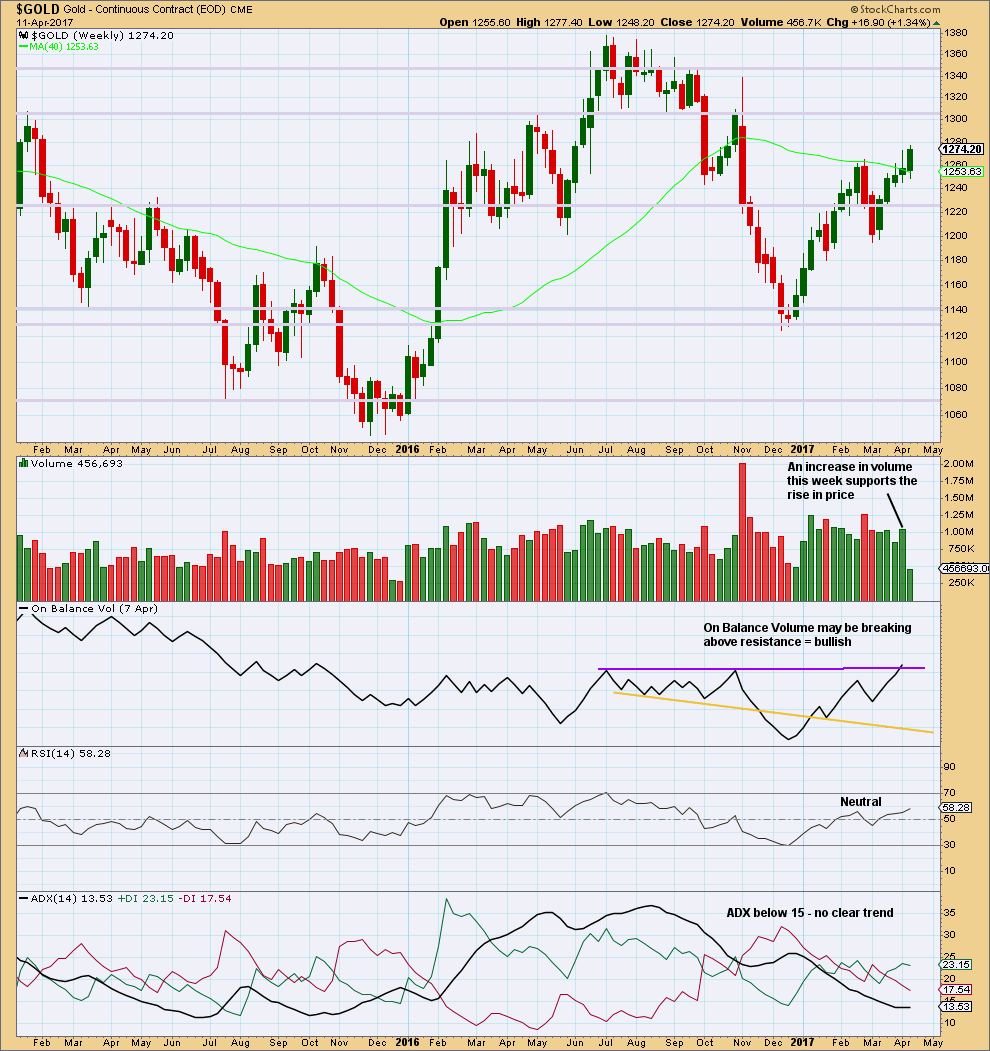
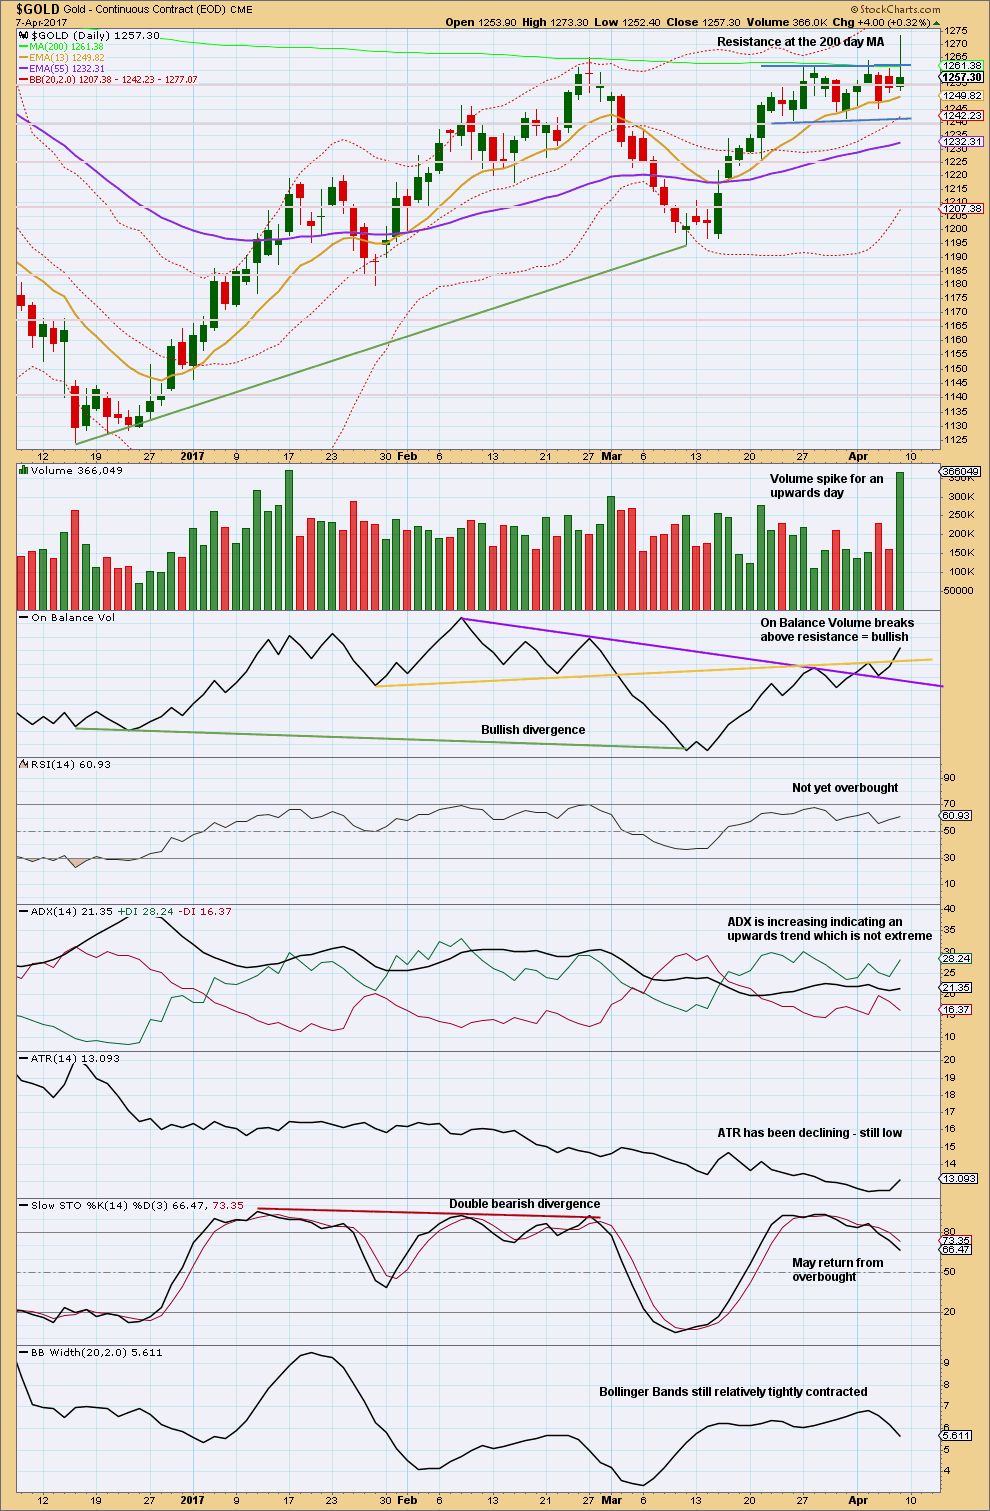
The relatively long upper wicks of the last two weekly candlesticks are a little bearish. The increase in volume this week is bullish.
The purple trend line on On Balance Volume has been carefully drawn to be as conservative as possible, sitting along the prior two highs. This trend line has a very shallow slope and is reasonably long held. It has only been tested twice before. It has some reasonable technical significance. This week it is slightly breached offering a reasonable bullish signal. However, for the signal to have more weight it needs a clearer breach.
DAILY CHART
Click chart to enlarge. Chart courtesy of StockCharts.com.
Gold is back within the prior range, but has a very strong spike above it. The support for upwards movement during Friday’s session from volume is bullish.
On Balance Volume gives yet another bullish signal. On Balance Volume remains strongly bullish at the daily chart level. This indicator is given much weight; it usually works well with trend lines for Gold.
ADX is bullish.
ATR is neutral. RSI is neutral.
Stochastics is bearish. Bollinger Bands contracting on Friday is a little bearish. The very long upper wick on Friday is fairly bearish.
Overall, this chart is more bullish than bearish.
Trading advice:
Profitable long positions may have stops moved up to breakeven to eliminate risk. The larger trend is most likely still up and corrections offer an opportunity to join the trend. Always use a stop. In this case, it should be at breakeven or preferably just below 1,250.48 now. Do not invest more than 1-5% of equity on any one trade.
More cautious traders may still like to wait for a classic breakout before entering the new trend. A classic breakout is a close above resistance or below support, on a day with increased volume. Friday is not a classic breakout.
GDX
DAILY CHART
Click chart to enlarge. Chart courtesy of StockCharts.com.
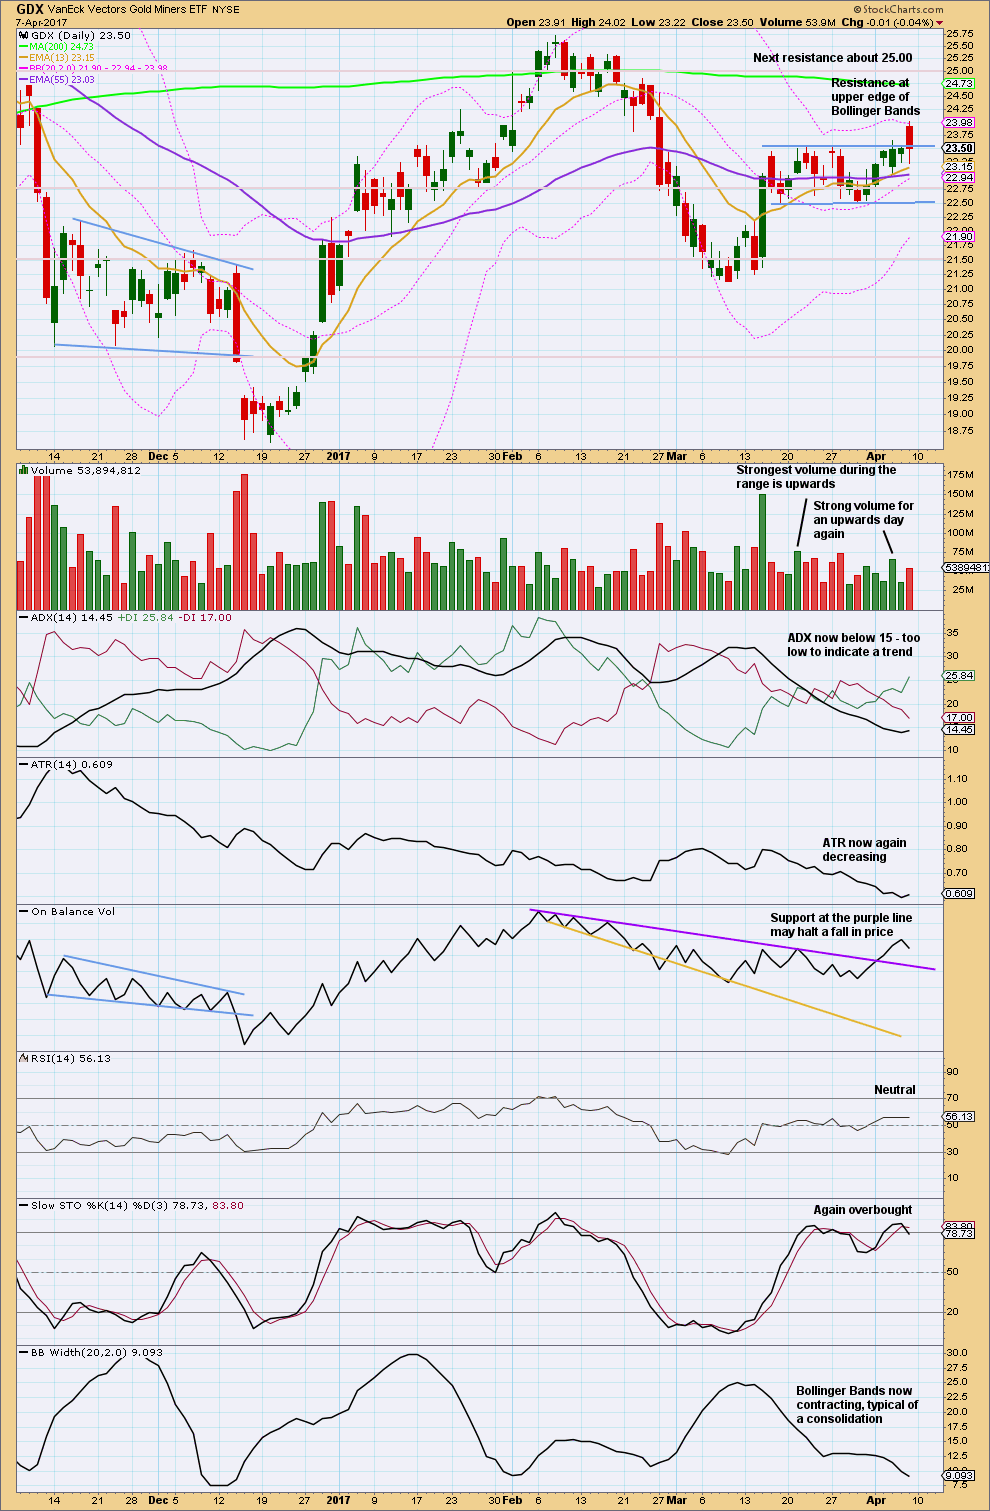
Friday is not a classic breakout because price has closed back within the prior consolidation zone. Friday’s session would more accurately be interpreted as an extension of the consolidation.
On Balance Volume for GDX remains very bullish. Volume for recent movement is still strongest for upwards days, so this too is bullish.
ADX and ATR are neutral.
Stochastics and Bollinger Bands are bearish.
Overall, GDX is more bullish than bearish. But price action during Friday is concerning for bulls.
This analysis is published @ 11:10 p.m. EST on 8th April, 2017.
imo Gold price appears toppy under 1257; a down move to test a break below 1248-47 appears to be on the cards….
Updated main hourly wave count:
Minuette (ii) should now be over, finding support at the lower edge of the base channel.
First, updated alternate hourly wave count.
I’ve tried a few ideas and this one looks best this morning. If minute c continues with a leisurely path for another three days then minor 2 may total a Fibonacci 13 sessions.
Minute c could even look like a continuation of the consolidation, with a slight overshoot of the lower area of support.
Then the breakout could be upwards for minor 3.
This is entirely possible. Which is why I’ve moved my stop on my long position up to breakeven. I may well be stopped out, but I don’t want a loss. If that happens I’ll wait for clarity before entering long again.
Lara,
As in your Alt. Hrly. the last sub-minuette a and b as completed of (ii) can be replaced in main Hrly. as Sub-minuette i and ii as completed of (iii)? If so, we should see some strong bullish action soon for iii of (iii)?
Yes.
While upward movement may continue a little higher, I’m gaining confidence in the alternative counts. I think miners will finish today positive on weak volume.
Here is a chart fr. Gary @ Fullgoldcrown (on Goldtadise.come site today):
I like Alan’s and Dreamer’s idea, but since most of us agree we are at some strong resistance…it could be very rational that we need to back and fill here as in Lara’s Alt., irregardless whether Alt count is exact or not.
This chart shows a pretty clear example of what that would look like…
Okay, I would strongly recommend against trading without stops. If you want to go that way, then how about approaching it like this.
At what point would your long position become untenable?
If price moves strongly lower, at what point would your account be so far in the red you’d lose sleep at night?
A third way to think of it: what is it that you think the market cannot do? Set your stop there.
If you don’t want to set a stop based on Elliott wave or technical analysis, then please set it based on money management.
Trading without stops exposes all the equity in your account to risk. You could lose it all. That’s how novice traders wipe out their accounts at least once.
And have big losses
Precious metals and miners turning around, only after silver corrected to its 20 day moving average. If that was the end of minor 2 for silver, hold on to your seats, and hats, and everything else… 🙂
One other possibility for the Main Count is that minuette 2 has morphed into a combination: zigzag – triangle – 5 wave zigzag. Where Lara placed “minuette ii” on the chart could only be subminuette w of minuette 2. The triangle had ended at 1254.13, and we are now in the zigzag down. Invalidation 1244.72.
So, minuette 2 ended at 1247.40, and we are now on the way in minuette 3. Currently in submicro 3 of micro 1 of subminuette 1, I presume.
If this count is correct, I will go (very) long after the pullback at the end of micro 2.
I’m bringing the wave count up one degree.
(1) Substitute “Currently in submicro 3 of micro 1 of subminuette 1” with “Currently in micro 3”.
(2) Substitute “pullback at the end of micro 2” with “pullback at the end of subminuette 2”.
Looks like we may have ended Micro 4 or a bit lower and in Micro 5 of Subminiuette i now ?
The other possibility is that we are still in micro 3 finishing up submicro 4. I still cannot distinguish between the two of them. I need further input.
agree..smaller waves are not very clear to count most times in real time
could this be Micro 2 ending instead? It has gone deeper? Or a submicro A of Micro 2 for a ZZ?
Correction above meant subminuette ii ending (or micro A of ii) and started a Micro1 of subminuette iii now may confirm by going over the high at 12:12PM? Or take out the days high today?
ssandysc. You are right. The drop to 1251.19 invalidated the scenario I mentioned at 1:11 pm. We are now in micro 5 down, finishing up subminuette 1. In a similar manner, NUGT is also in its 5th wave up.
I will wait for the end of the pullback before buying in.
Now that the triangle has apparently broken down, I have another idea.
The move out of a triangle is often short and fast. What if Minuette wave 1 just completed? Gold could move up toward the .618 retrace around 1,262 before moving lower toward the target.
https://www.tradingview.com/x/H4Rr4Z2Y/
Oh wow, I like that triangle so much better than my ending expanding diagonal idea. Don’t know why I didn’t see this idea myself earlier today…
Thanks Dreamer! Sometimes it takes a fresh pair of eyes to see what you can’t see…
GDX printed an ugly candle on Friday after hitting very strong resistance. With Gold looking very weak, I think we need to look at a short term bearish idea for GDX.
If Gold does break down toward Lara’s alternate target, expect GDX to start selling off. The EW pattern will likely see Minor wave 2 continuing as an Expanded Flat with a target of 22.35.
If this occurs, the bull will still be alive as GDX continues to consolidate within the symmetrical triangle. The coiling will result in a powerful move to the upside after Minor 2 is finished.
https://www.tradingview.com/x/JOZqVbTK/
The price action since Sunday eve is lethargic. Gold apparently didn’t get Roopa’s memo on the news. I think gold’s movement is more affected by the currencies and the Fed over the long haul and more on a short term (spike) basis for news.
Anyway, I’m having difficulty seeing the recent price movement as bullish. A triangle may be forming. If so, expect a sharp move down to Lara’s alternate target. Let’s see what happens.
https://www.tradingview.com/x/AnFHp1Am/
Sorry for the long post cut and paste.
Today also gold is at the same wave count 3 of 3 of major wave 3 per Lara’s count above.
Then from June 2007 to Jan 2008 gold rose to 1033 from 675.
From Jun 18 2007 Alf Fields post on gold Elliott wave count:
Quote from UpdateXIII:
“If this interpretation is correct, then we have an extremely bullish outlook immediately ahead as the most powerful move, wave iii of wave 3 of wave THREE, should soon get underway. In a wave iii of 3 of THREE situation, such as this, one can anticipate a sling-shot upward movement in excess of $100 per ounce for gold, without any significant corrections.
“Markets spend 90% of the time making up their minds what to do – and then only 10% of the time actually doing what they have to do in terms of dramatic moves. It is now more than 12 months since the $725 wave ONE peak was reached in gold in May 2006. The gold market has spent this time coiling and twirling, building up strength and momentum for the rapid move to the upside. Gold has spent the 90% of the time building this launch pad. It seems ready for lift-off in the dramatic move occupying 10% of the time. This would be a perfect fit for a wave iii of 3 of THREE type wave, generally the strongest in any sequence.
“An analogy could be that of a hammer thrower in athletics. The athlete twirls around in the launch cage, going faster and faster until maximum momentum is achieved. At that point the hammer is released and flies the maximum distance possible from the momentum that has been generated. Gold has spent a year twirling and building momentum. The time has come for the gold market to launch itself upwards to points well above the old $725 high point of a year ago.”
I really really don’t like that running flat (he’s labelled it an irregular A-B-C correction). The truncation for C is absolutely huge.
The probability of that count, or at least that portion of it, is really very low indeed.
And it makes a difference, what comes after flows on from there.
http://www.bbc.com/news/world-asia-39542990.
US deploys warship to korean peninsula. News is not good for global peace and this geopolitical tension seems to get drag for a long time. Bad news but good for gold
Yeap, market is gonna open with a big gap
That’s really scary news Roopa. I fear this could start WWIII.
I agree lara.
http://www.bbc.com/news/world-middle-east-39548645
Another disasterous news of the day 😰
If I read the geopolitics correctly, this is more likely to be a stare-down rather than an outright war. The US is wary of bringing China, and perhaps Russia, into the fray. China, because Pyongyang had always been its ally, and it did not want a mass exodus of refugees across its border with North Korea. That said, China has cooled off somewhat due to the Xi-Trump meeting, North Korea’s constant refusal to heed its advice to discontinue with missile testing, and lately the murder of Kim Jong Nam who is under China’s protection. Russia, because it is still licking its wounds after the US missile incursion into Syria; knowing Putin, he will jump at any chance to exact his revenge. The warship is meant more of a deterrent. Of course, the situation is very volatile, what with the megalomaniac Kim Jong Un on the one hand, and an unpredictable firebrand Trump on the other. It just needs one irresponsible shot at the other to ignite a full-blown crisis.
Lara. I’m glad that, for the Main Count, you have agreed to the way that ssandysc and I view the price movement, that the high of 1269.72 was minuette 1 of Minute 3. All it takes now is
(a) Minute 3 = 2.618 * Minute 1 to yield 1300, and
(b) Minute 5 = Minute 3 to yield 1333.
The higher targets will come naturally: 1392 for Intermediate 3, 1452 for Primary 3, and 1655 for Cycle A if Cycle A comprises 5 waves. Thereafter it will be a big drop for Cycle B.
Your Alternate Count is a stroke of genius.
To sum up, the best strategy for the more cautious trader would be:
(1) Once price breaks above 1261.93, buy into the (huge) uptrend given by Main Count.
(2) If price drops below 1250.48, prepare to sell longs.
(2a) If price drops below 1244.72, definitely sell longs, or for the braver ones, hold.
(2b) Once price rises above 1237, buy into the (huge) uptrend given by the Alternate Count.
Why, thank you very much Alan.
I like your trading advice.
For members: this is one possible approach outlined by Alan, follow it at your own risk. Your trading decisions are your own, take responsibility for them.
Which means managing risk. Remember my two Golden Rules:
1. Always use a stop.
2. Do not invest more than 1=5% of equity on any one trade.
Good luck!
Hi Lara
Is it possible to show a few precedents where a daily long tailed pin bar like the one we have just had, have failed to mark a change in direction?
There’s one on the daily chart for the 28th of December, 2016.
The 26th of July 2016 also has a long upper wick, but it has a large real body. Anyway, the long upper wick there was bearish but that wasn’t the high.
There’s another one on 6th February, 2014. That was a very small real body with a very long upper wick, yet price continued higher until the 18th of March.
Another on 27th December 2006 has a very long upper wick and a very small real body. The high was seen seven days later, and it wasn’t immediately followed by a small pullback, price moved up after the candlestick.
That’s just a quick look on the daily chart.
I can see plenty more examples of candlesticks like this, small real bodies and very long upper wicks, that are followed by some downwards movement. But they make no comment on how far the next downwards movement must go nor how long it may last. Plenty of only one to three days of downwards movement for a relatively brief shallow pullback within an overall upwards trend.
The lesson here I think is this:
It’s a warning. It’s not definitive. It is likely to be followed by some downwards movement, but it doesn’t have to be by much or for long. A candlestick like this can certainly still occur within an overall upwards trend.
It is not a reversal signal.
I would recommend to members to take a little time to scroll back over the daily chart for Gold, go back to early 2000’s if you can.
Focus on the candlestick wicks. Notice at lows what do the wicks look like. Do you see clusters of long lower or upper wicks? Same at the highs. What do you see?
Try to get a feel for how candlesticks can show you what is likely to happen next.
Also, notice the doji. Do they appear within trends? Only at highs and lows? What do you think they represent?
Getting a “feel” for how candlesticks work is one of the best things for trading. I think they’re beautiful.