
Last week expected the pullback was over but price has kept falling. A new wave count is now the main wave count, which has support from classic technical analysis.
Summary: Price is falling hard and this fall may not be over yet. It looks now fairly likely it may end at least slightly below 16.82. Some advice on what to look for to see if a low is in place is given in the classic technical analysis section. The larger trend is still up; at its end, this pullback may offer an opportunity to join the trend.
Remember my two Golden Rules of trading:
1. Always use a stop on every trade.
2. Do not invest more than 1-5% of equity on any one trade.
New updates to this analysis are in bold.
Last monthly chart is here.
ELLIOTT WAVE COUNT
WEEKLY CHART
Click chart to enlarge.
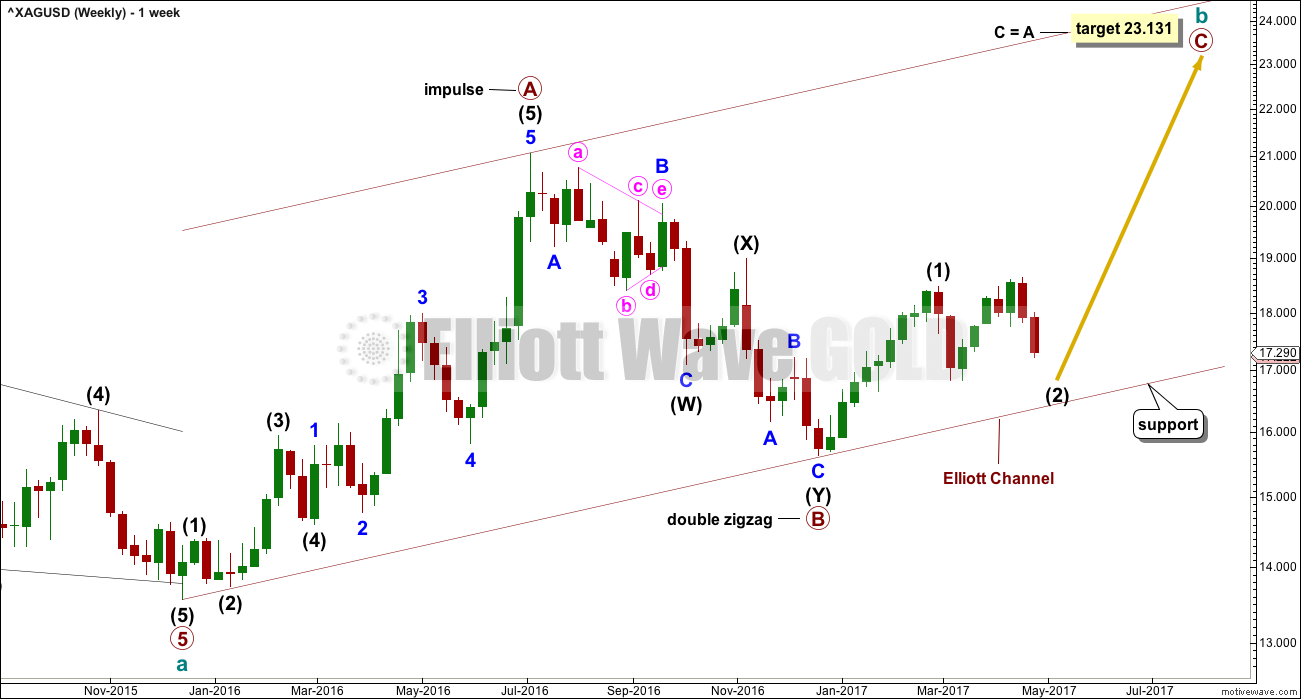
Upwards movement labelled primary wave A fits perfectly as an impulse.
Primary wave B fits as a deep double zigzag. Primary wave C must subdivide as a five wave structure. The target expects it to reach the most common Fibonacci ratio to primary wave A.
Primary wave A lasted 29 weeks. Primary wave B lasted 24 weeks. These waves are in proportion.
DAILY CHART
Click chart to enlarge.
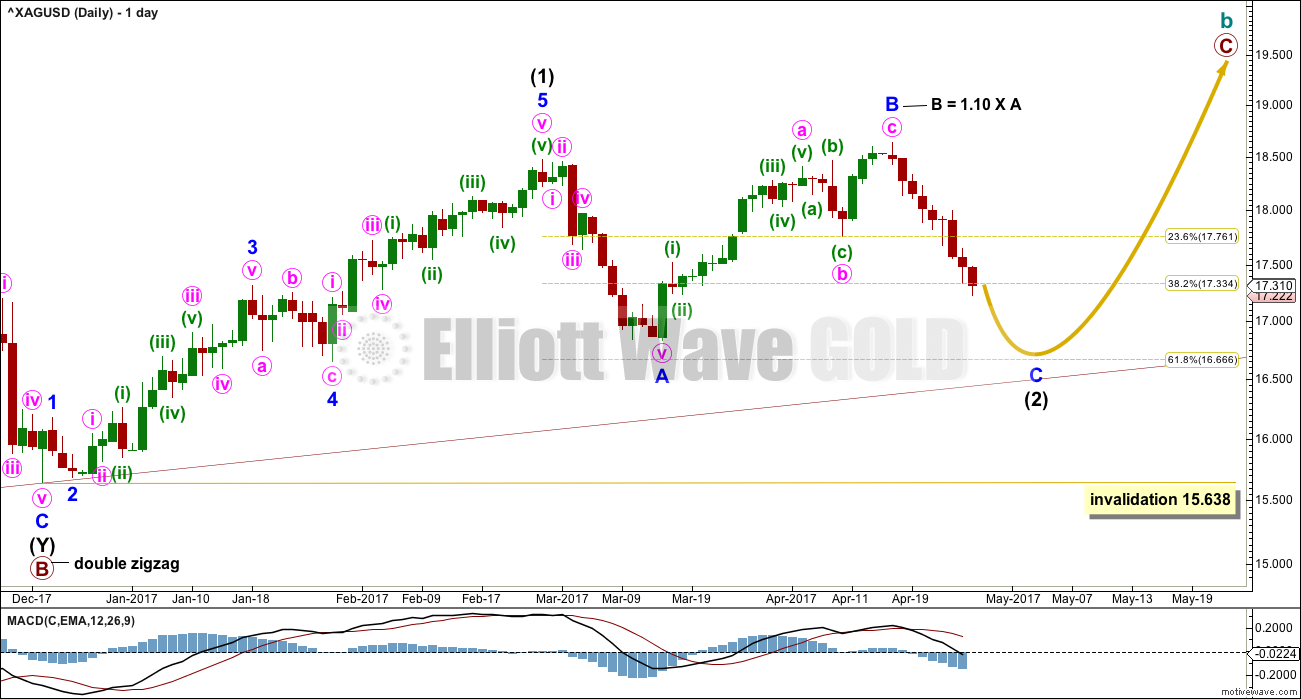
This week the main wave count is changed. On the alternate below (which was last week’s main wave count) it is explained why.
The new main wave count will see intermediate wave (2) continuing lower as an expanded flat correction. Minor wave B is within the normal range of 1 to 1.38 the length of minor wave A. Minor wave C would be extremely likely to make at least a slight new low below the end of minor wave A at 16.831 to avoid a truncation and a very rare running flat.
The target for intermediate wave (2) to end is the 0.618 Fibonacci ratio of intermediate wave (1) at 16.666. If it moves below this point, it should find very strong support at the lower edge of the maroon Elliott channel which is copied over from the weekly chart.
Intermediate wave (2) may not move beyond the start of intermediate wave (1) below 15.638.
ALTERNATE DAILY CHART
Click chart to enlarge.
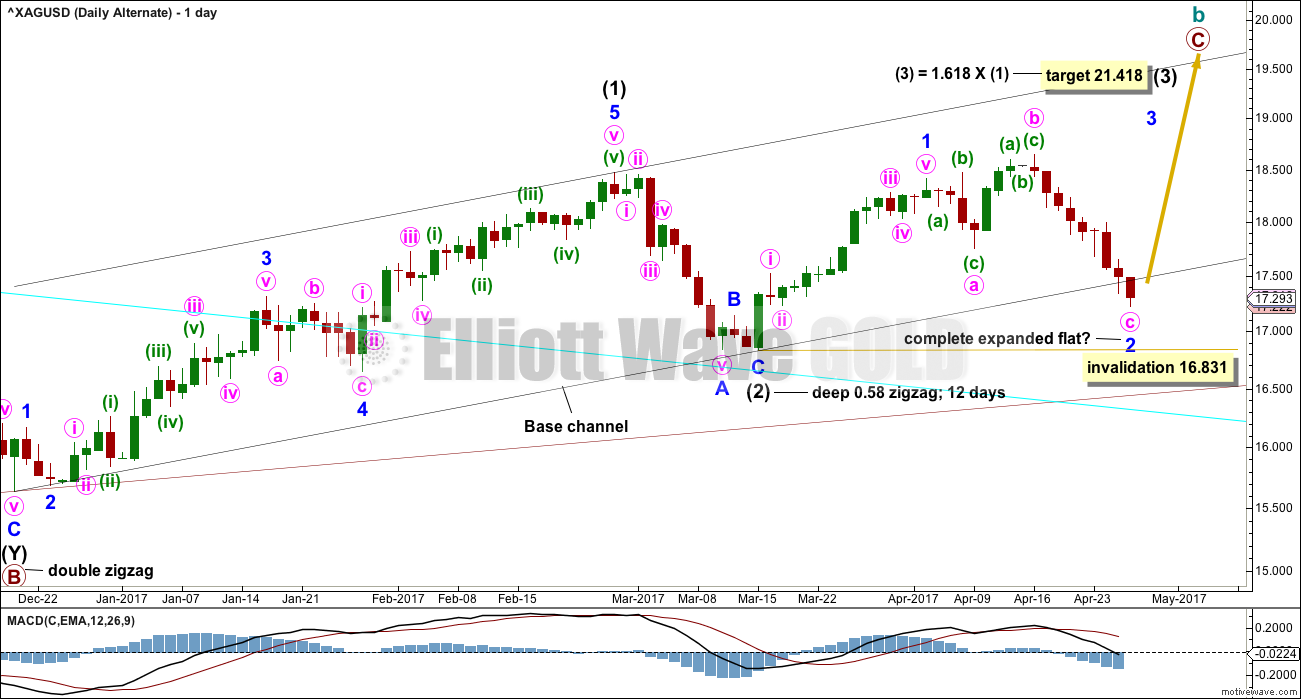
This wave count was the alternate last week. The main wave count last week was invalidated.
This wave count is still an alternate.
There is a problem with the base channel about intermediate waves (1) and (2). Lower degree second wave corrections should not breach base channels drawn about first and second waves one or more degrees higher. The lower edge of the base channel is strongly overshot today; it looks like it may be breached. This reduces the probability of this wave count.
There is also a problem now of proportion. Intermediate wave (2) lasted 12 days. So far minor wave 2, one degree lower, has lasted 17 days, but it should be about even or less in duration than intermediate wave (2). This further reduces the probability of this wave count today.
Minor wave 2 may not move beyond the start of minor wave 1 below 16.831.
TECHNICAL ANALYSIS
WEEKLY CHART
Click chart to enlarge. Chart courtesy of StockCharts.com.
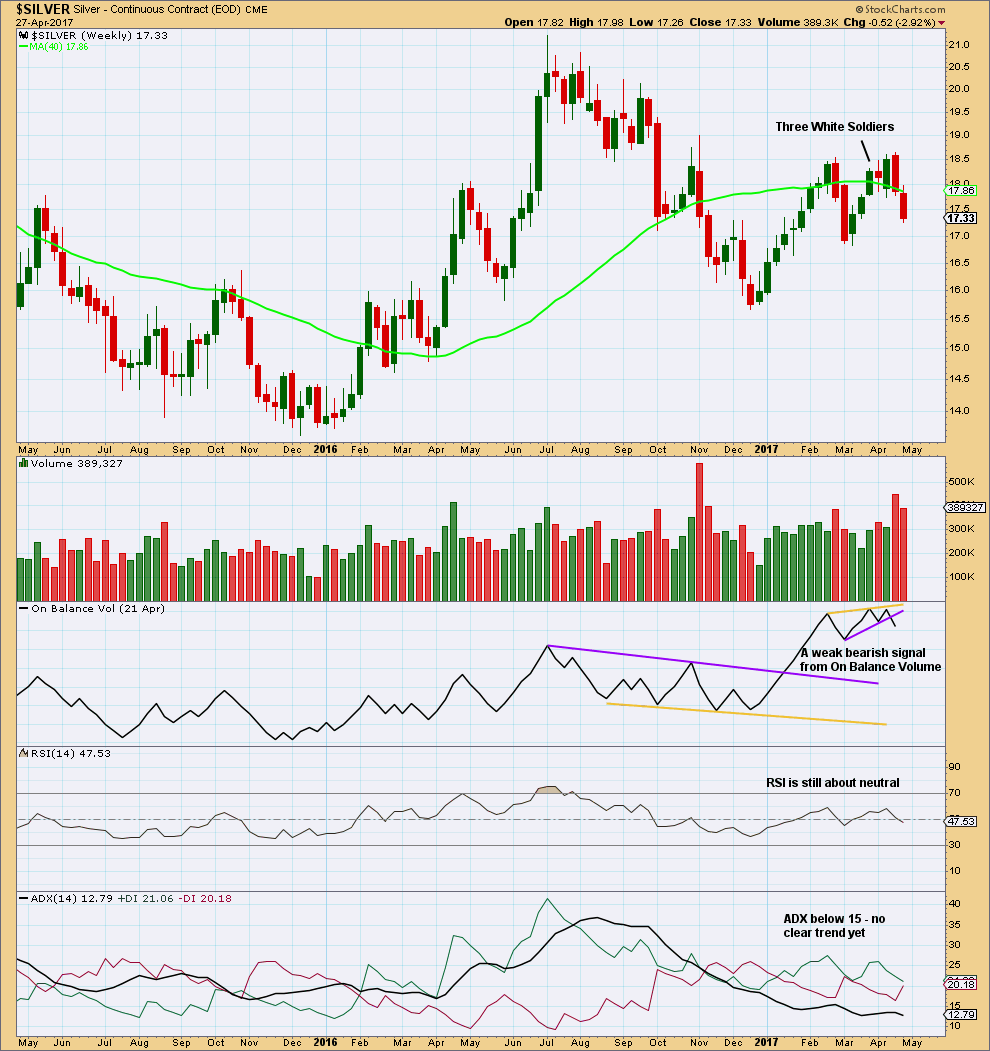
The last two downwards weeks have stronger volume than prior upwards weeks. There is some support for the downwards movement in price. Expect it is likely to continue further.
RSI allows further room for price to fall. ADX has not yet indicated a trend change.
DAILY CHART
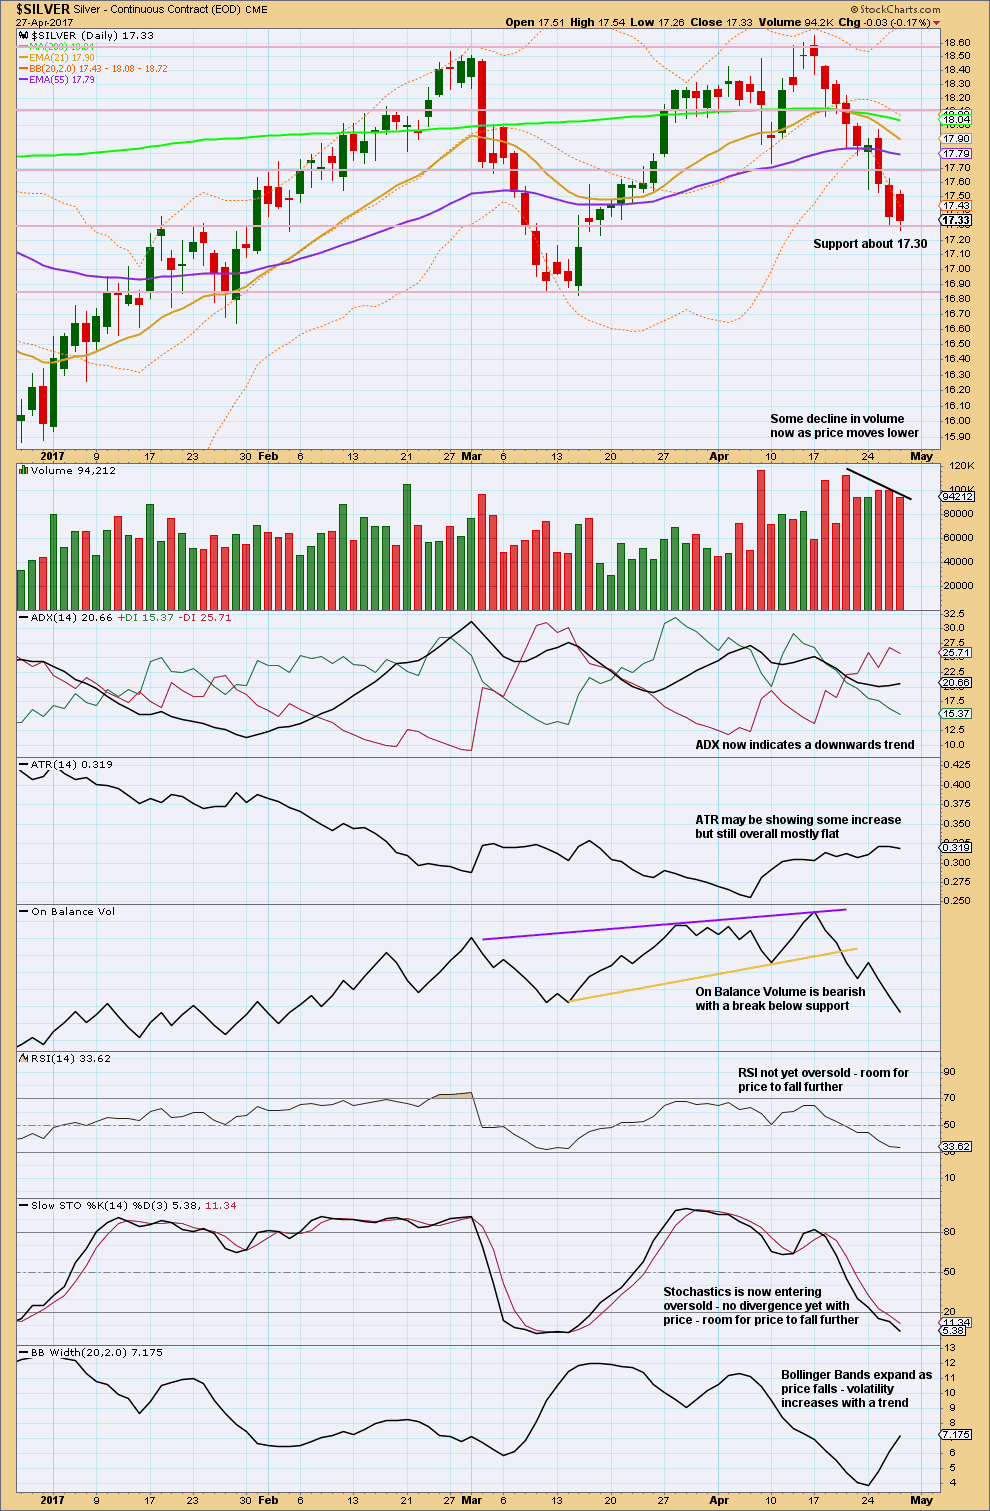
Click chart to enlarge. Chart courtesy of StockCharts.com.
Downwards movement is currently finding some support about 17.30. A slight decline in volume indicates some lack of support for the fall in price, but it is not yet a strong enough difference to indicate real weakness here. Price may continue to fall further mostly of its own weight.
Volume for downwards days is still much stronger here than prior upwards days.
If RSI reaches oversold and then exhibits some divergence with price, then expect a low is in place. If Stochastics also exhibits some divergence with price at the same time, then this signal would be stronger. For now there is room for price to fall further. Next support is about 16.85.
This analysis is published @ 09:50 p.m. EST.
Hi Lara, is this the time to buy Silver?
Thank you Lara!
You’re welcome 🙂