
Again, last week expected downwards movement from US Oil but price continues higher. The main Elliott wave count was invalidated leaving only one wave count now, which was last week’s alternate.
Summary: Use the small best fit channel on the daily Elliott wave count. If price breaks below the lower edge, then expect Oil has changed trend. The target would be at least a new low below 47.06; it should be comfortably below that point. Expect price may continue higher while it remains within the channel.
New updates to this analysis are in bold.
MONTHLY ELLIOTT WAVE COUNT
Click chart to enlarge.
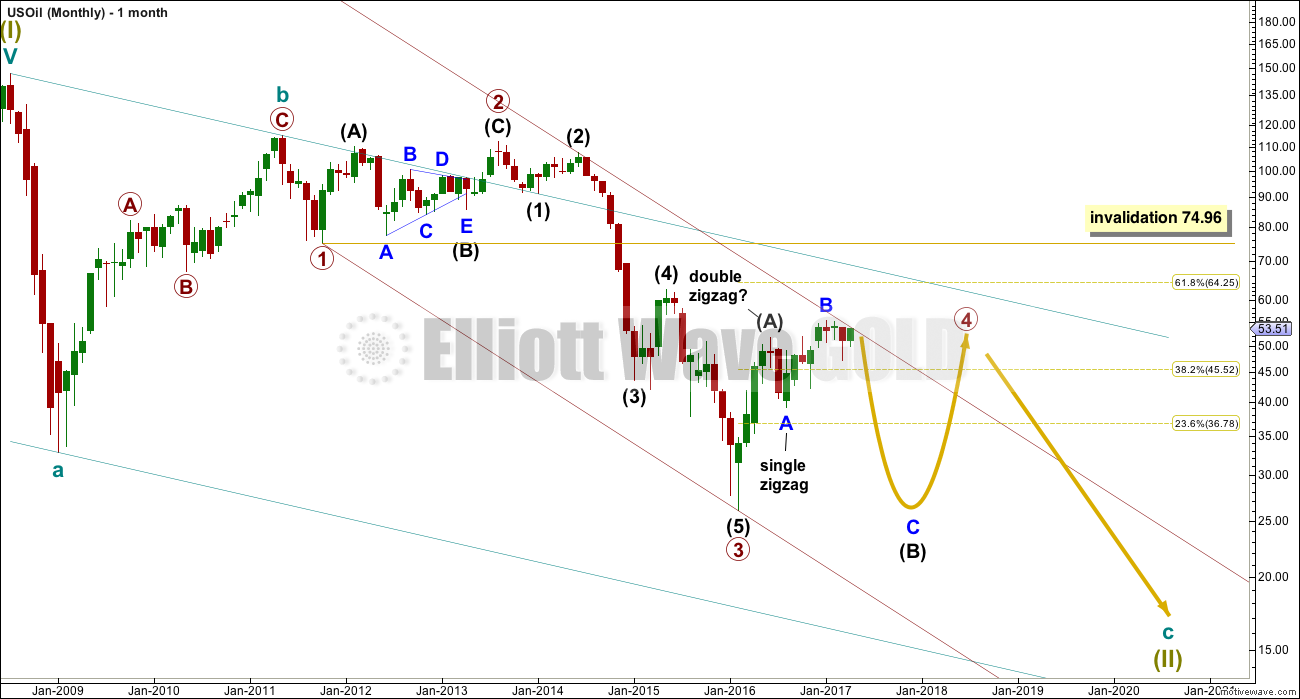
Within the bear market, cycle wave b is seen as ending in May 2011. Thereafter, a five wave structure downwards for cycle wave c begins.
Within cycle wave c, at this stage it does not look like primary wave 5 could be complete. That would only be possible if primary wave 4 was over too quickly.
Primary wave 1 is a short impulse lasting five months. Primary wave 2 is a very deep 0.94 zigzag lasting 22 months. Primary wave 3 is a complete impulse with no Fibonacci ratio to primary wave 1. It lasted 30 months.
Primary wave 4 is likely to exhibit alternation with primary wave 2. Primary wave 4 is most likely to be a flat, combination or triangle. Within all of these types of structures, the first movement subdivides as a three. The least likely structure for primary wave 4 is a zigzag.
Primary wave 4 is likely to end within the price territory of the fourth wave of one lesser degree; intermediate wave (4) has its range from 42.03 to 62.58.
If primary wave 4 is incomplete, then it looks like it may not remain contained within the channel. Sometimes fourth waves overshoot channels and this is why Elliott developed a second technique to redraw the channel when it does not contain a fourth wave.
Primary wave 4 is most likely to be shallow to exhibit alternation in depth with primary wave 2. So far it has passed the 0.382 Fibonacci ratio at 45.52. It may now continue to move mostly sideways in a large range.
Primary wave 4 may not move into primary wave 1 price territory above 74.96.
At this stage, primary wave 4 has completed intermediate wave (A) only. Intermediate wave (B) is incomplete.
WEEKLY ELLIOTT WAVE COUNT
Click chart to enlarge.
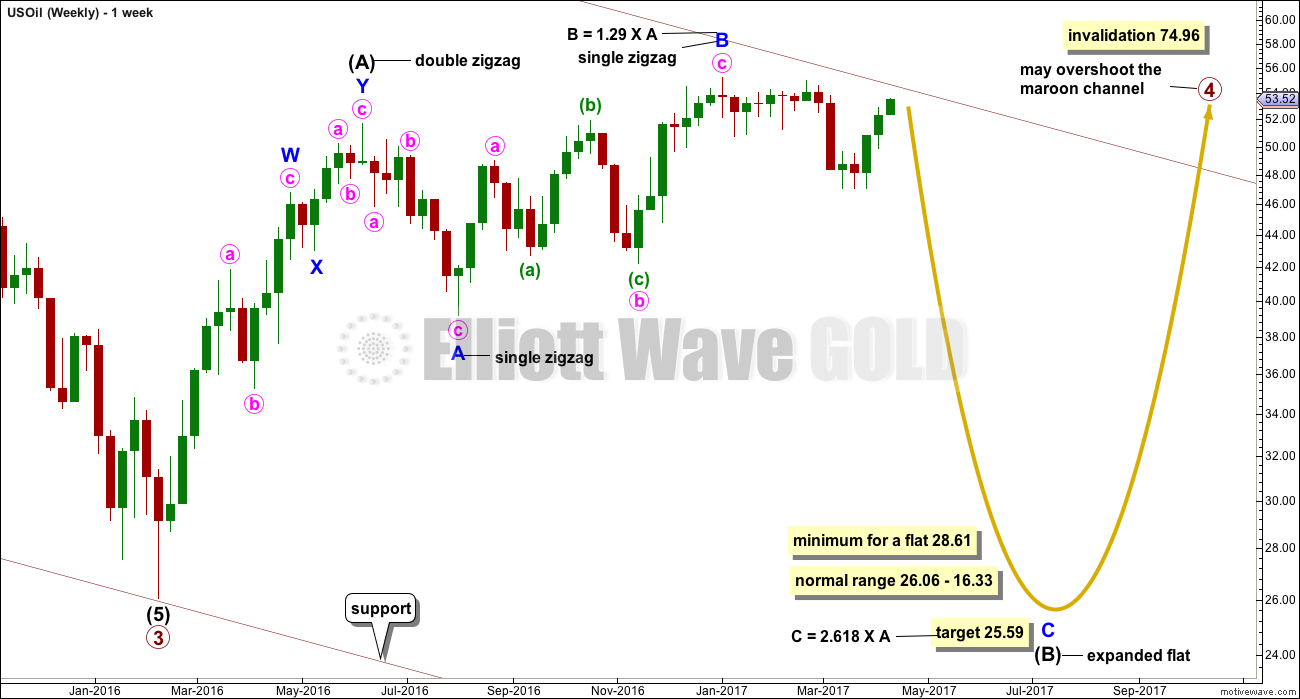
The whole structure of primary wave 4 is seen here in more detail.
The first wave labelled intermediate wave (A) is seen as a double zigzag, which is classified as a three.
Intermediate wave (B) is also a three. This means primary wave 4 is most likely unfolding as a flat correction if my analysis of intermediate wave (A) is correct. Flats are very common structures.
Intermediate wave (B) began with a zigzag downwards. This indicates it too is unfolding most likely as a flat correction.
Within intermediate wave (B), the zigzag upwards for minor wave B is a 1.29 correction of minor wave A. This indicates intermediate wave (B) may be unfolding as an expanded flat, the most common type.
The normal range for intermediate wave (B) within a flat correction for primary wave 4 is from 1 to 1.38 the length of intermediate wave (A) giving a range from 26.06 to 16.33.
Primary wave 4 may not move into primary wave 1 price territory above 74.96.
Within the larger expanded flat correction of primary wave 4, intermediate wave (B) must retrace a minimum 0.9 length of intermediate wave (A) at 28.61 or below.
DAILY ELLIOTT WAVE COUNT
Click chart to enlarge.
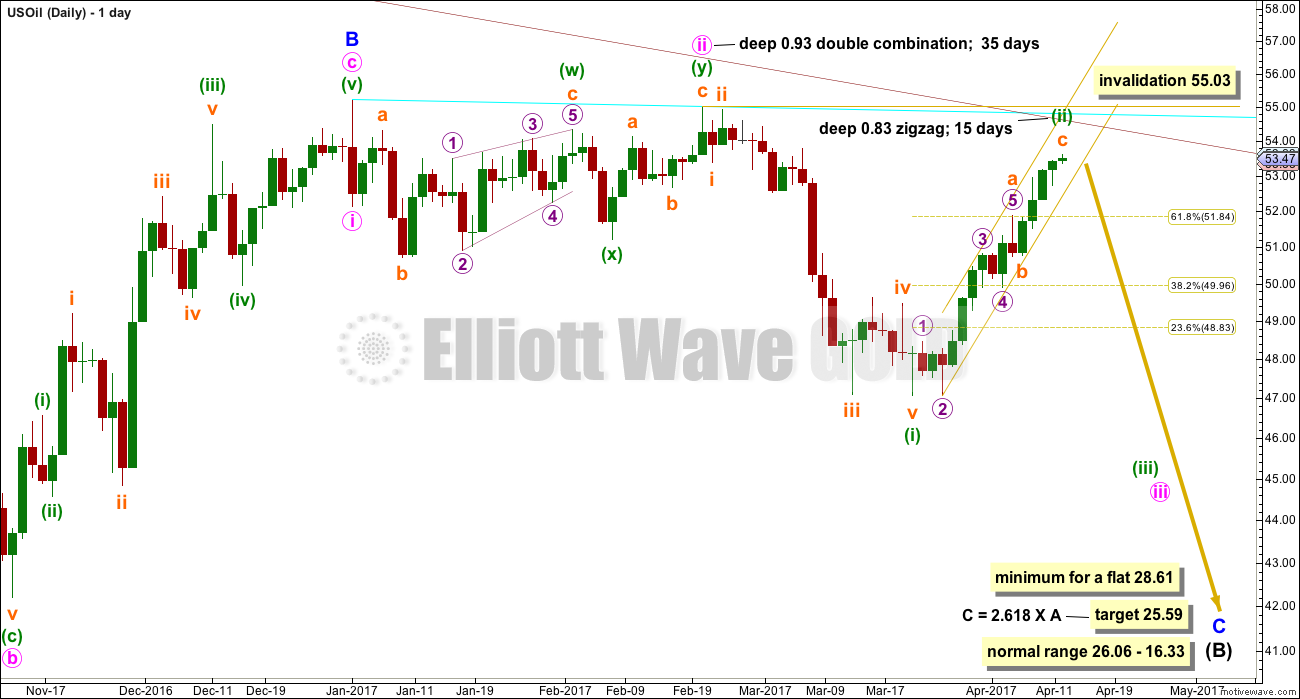
Minor wave C downwards must subdivide as a five wave structure.
Within minor wave C, minute waves i and ii should be complete and minute wave iii may be incomplete.
Within minute wave iii, minuette wave (i) is complete and minuette wave (ii) must end soon because it has very little room left to move into.
A small best fit channel is drawn about the zigzag of minuette wave (ii). When this channel is breached by a full daily candlestick below and not touching the lower edge, that shall provide trend channel confirmation of a trend change. At that stage, this wave count would expect an increase in downwards momentum.
Minuette wave (iii) must make a new low below the end of minuette wave (i) at 47.06. It must move far enough below that point to allow for subsequent upwards movement for minuette wave (iv) to unfold and remain below minuette wave (i) price territory.
Minuette wave (ii) may not move beyond the start of minuette wave (i) above 55.03.
TECHNICAL ANALYSIS
DAILY CHART
Click chart to enlarge. Chart courtesy of StockCharts.com.
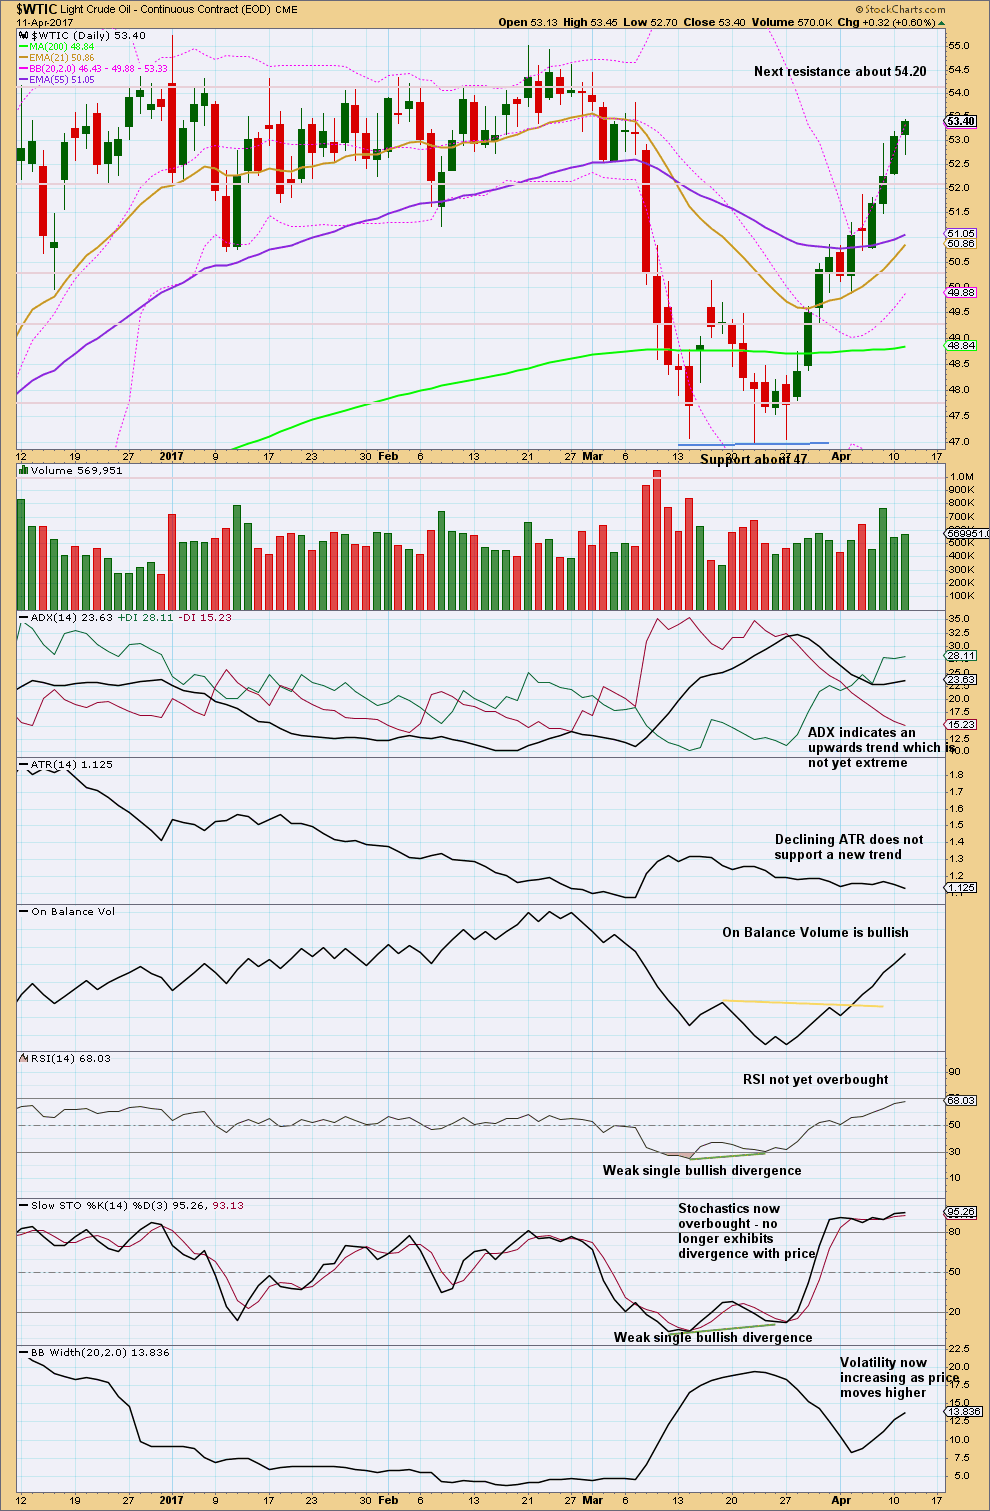
There is some increase in volume as price continues higher. Volume overall is bullish.
On Balance Volume is bullish. ADX is bullish. RSI is bullish and not yet overbought. Bollinger Bands are also now bullish.
Stochastics may remain extreme for long periods of time when this market trends. When it has remained extreme and then exhibits divergence with price, preferably multiple divergence, then it shows weakness in price.
This analysis is overall fairly bullish. The only concern is declining ATR and the Stalled candlestick pattern of the last three candlesticks.
VOLATILITY INDEX
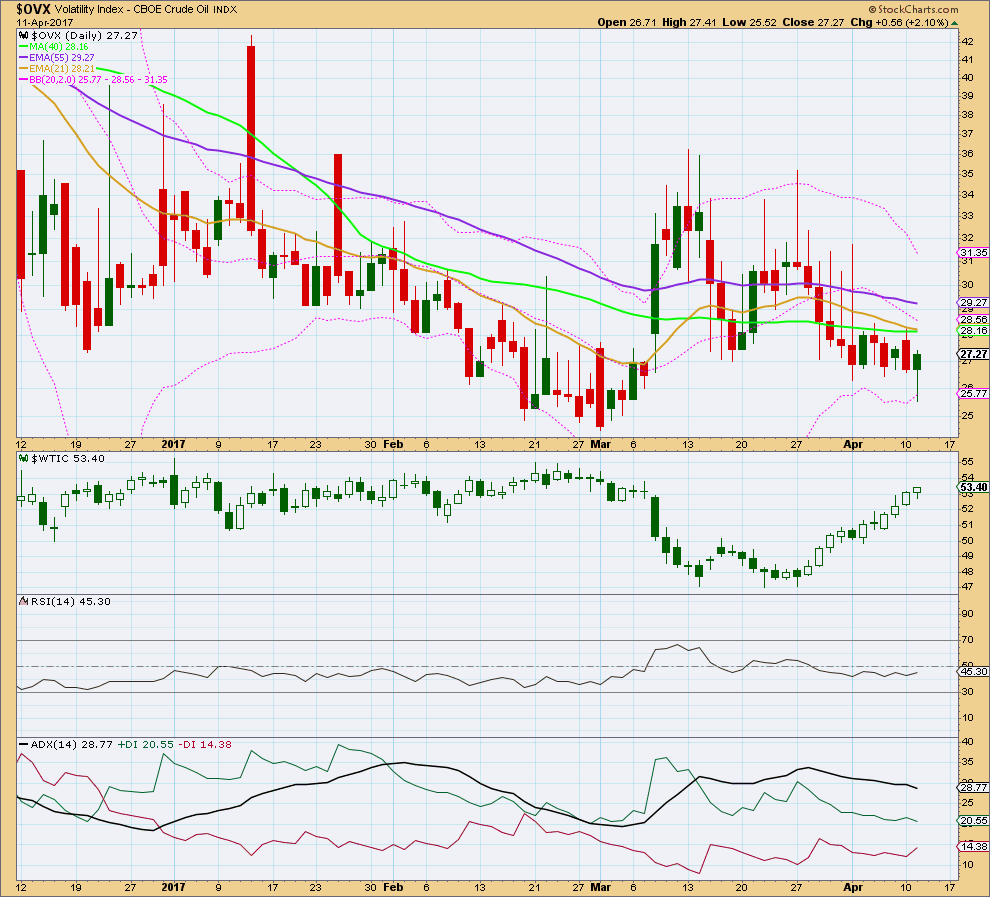
Click chart to enlarge. Chart courtesy of StockCharts.com.
Normally, volatility should decline as price rises and volatility should increase as price falls. Divergence from this normal can provide a bullish or bearish signal for Oil.
There is no divergence with price and volatility at this stage. Price has made new highs while volatility has declined.
This analysis is published @ 01:52 a.m. EST.
Hi Lara. Can you pls comment on if you think the daily breach happened for a potential trend change? Thanks.
It’s so close isn’t it!
At this stage it looks like that trend line may be breached soon, but it isn’t breached yet.
Strong warnings only at this time.
The last daily candlestick is red with a long upper wick, it’s a bearish engulfing candlestick pattern.
I may take a punt here on a short on Oil, but there’s more risk in doing that prior to a proper breach of the channel. Still, can set a stop just above the high of 12th April so not too much risk.
Haha….yea, so close. Will wait for a proper breach. Hope all is good down there for you guys…
Hi Lara…I’m wondering if you think this might be consolidation…or a trend change currently? I’m short right now thanks to you…keep it up!!!