
Price has moved higher over the last few days.
Summary: Upwards movement looks like a counter trend movement and it looks reasonably likely to end here or very soon indeed.
If members choose to enter short positions, stops should technically be set just above 55.03. Do not invest more than 1-5% of equity on any one trade.
It is expected that short positions should become profitable quickly, maybe within 24 hours.
New updates to this analysis are in bold.
MONTHLY ELLIOTT WAVE COUNT
Click chart to enlarge.
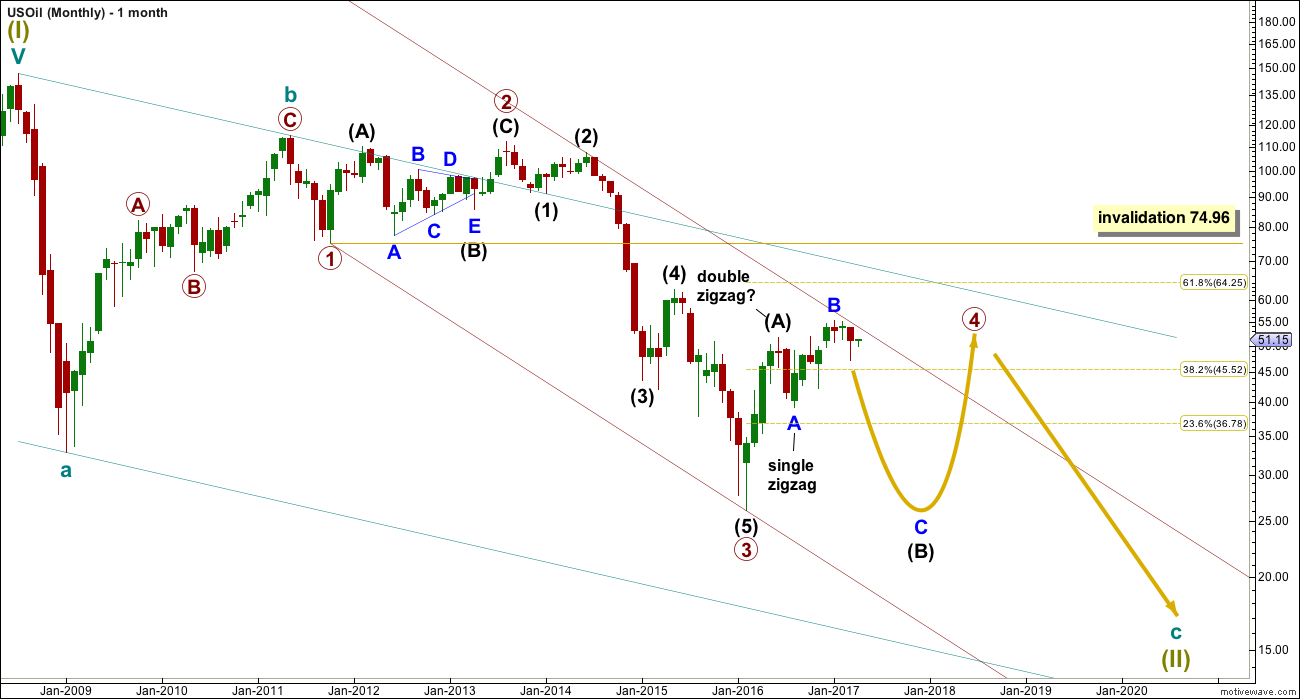
Within the bear market, cycle wave b is seen as ending in May 2011. Thereafter, a five wave structure downwards for cycle wave c begins.
Within cycle wave c, at this stage it does not look like primary wave 5 could be complete. That would only be possible if primary wave 4 was over too quickly.
Primary wave 1 is a short impulse lasting five months. Primary wave 2 is a very deep 0.94 zigzag lasting 22 months. Primary wave 3 is a complete impulse with no Fibonacci ratio to primary wave 1. It lasted 30 months.
Primary wave 4 is likely to exhibit alternation with primary wave 2. Primary wave 4 is most likely to be a flat, combination or triangle. Within all of these types of structures, the first movement subdivides as a three. The least likely structure for primary wave 4 is a zigzag.
Primary wave 4 is likely to end within the price territory of the fourth wave of one lesser degree; intermediate wave (4) has its range from 42.03 to 62.58.
If primary wave 4 is incomplete, then it looks like it may not remain contained within the channel. Sometimes fourth waves overshoot channels and this is why Elliott developed a second technique to redraw the channel when it does not contain a fourth wave.
Primary wave 4 is most likely to be shallow to exhibit alternation in depth with primary wave 2. So far it has passed the 0.382 Fibonacci ratio at 45.52. It may now continue to move mostly sideways in a large range.
Primary wave 4 may not move into primary wave 1 price territory above 74.96.
At this stage, primary wave 4 has completed intermediate wave (A) only. Intermediate wave (B) is incomplete.
WEEKLY ELLIOTT WAVE COUNT
Click chart to enlarge.
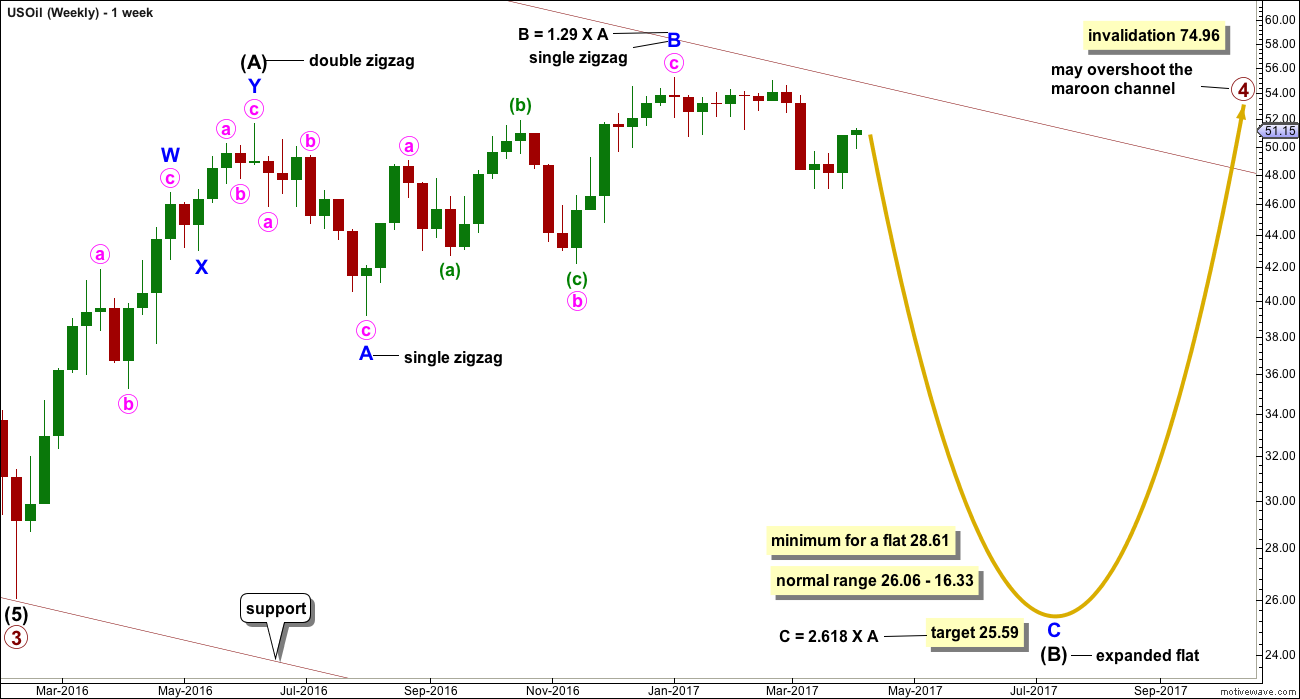
The whole structure of primary wave 4 is seen here in more detail.
The first wave labelled intermediate wave (A) is seen as a double zigzag, which is classified as a three.
Intermediate wave (B) is also a three. This means primary wave 4 is most likely unfolding as a flat correction if my analysis of intermediate wave (A) is correct. Flats are very common structures.
Intermediate wave (B) began with a zigzag downwards. This indicates it too is unfolding most likely as a flat correction.
Within intermediate wave (B), the zigzag upwards for minor wave B is a 1.29 correction of minor wave A. This indicates intermediate wave (B) may be unfolding as an expanded flat, the most common type.
The normal range for intermediate wave (B) within a flat correction for primary wave 4 is from 1 to 1.38 the length of intermediate wave (A) giving a range from 26.06 to 16.33.
Primary wave 4 may not move into primary wave 1 price territory above 74.96.
Within the larger expanded flat correction of primary wave 4, intermediate wave (B) must retrace a minimum 0.9 length of intermediate wave (A) at 28.61 or below.
DAILY ELLIOTT WAVE COUNT
Click chart to enlarge.
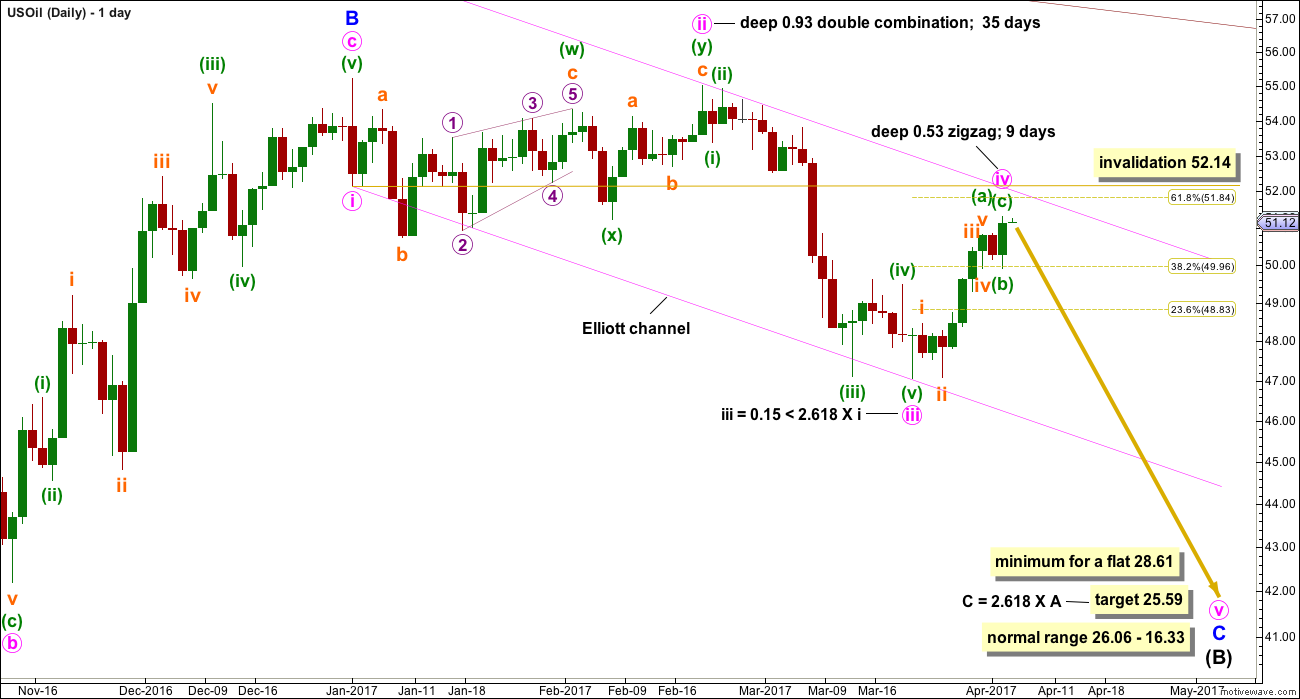
Minor wave C downwards must subdivide as a five wave structure.
Minute wave iii looks now to have ended 0.15 short of the first target given. It exhibits a Fibonacci ratio to minute wave i.
Minute wave ii was a time consuming and very deep double combination. If the current correction is minute wave iv, then it does not exhibit good alteration in depth but does exhibit alternation in structure. Minute wave iv at this stage may be a complete zigzag.
Minute wave ii lasted 35 days, one more than a Fibonacci 34. Zigzags are usually quicker structures than combinations; minute wave iv may have lasted 9 days, one more than a Fibonacci 8.
Minute wave v downwards may be a very strong, swift and extended wave. It may end with a selling climax, which is typical for commodities.
Minute wave iv may not move into minute wave i price territory above 52.14.
If upwards movement continues and makes a new high above 52.14, then this main daily wave count would be invalidated and the alternate below would then be used.
ALTERNATE DAILY ELLIOTT WAVE COUNT
Click chart to enlarge.
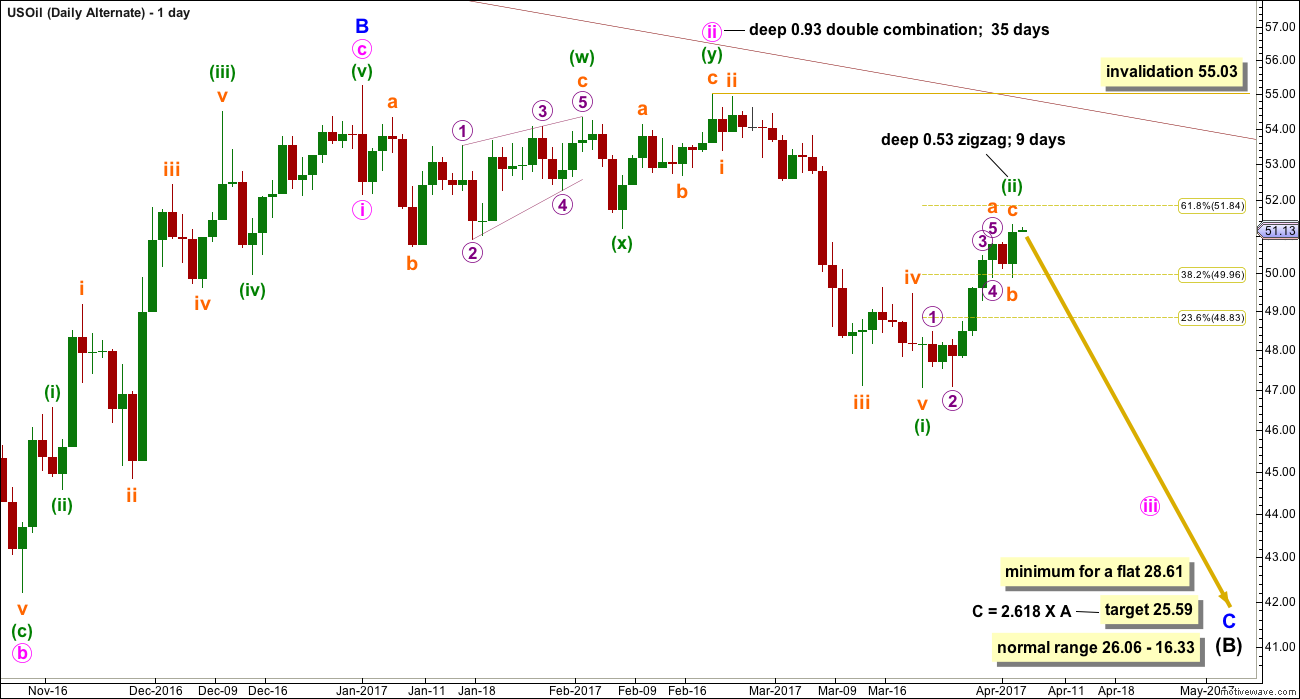
If the degree of labelling within minute wave iii is simply moved down one degree, the current correction may be another second wave correction and not a fourth wave.
All subdivisions are seen in exactly the same way for both wave counts.
Minuette wave (ii) would be more brief than minute wave ii one degree higher. This gives this wave count the right look.
Minuette wave (ii) may not move beyond the start of minuette wave (i) above 55.03. If it does move higher, then it would be likely to end close to the 0.618 Fibonacci ratio at 51.84.
TECHNICAL ANALYSIS
DAILY CHART
Click chart to enlarge. Chart courtesy of StockCharts.com.
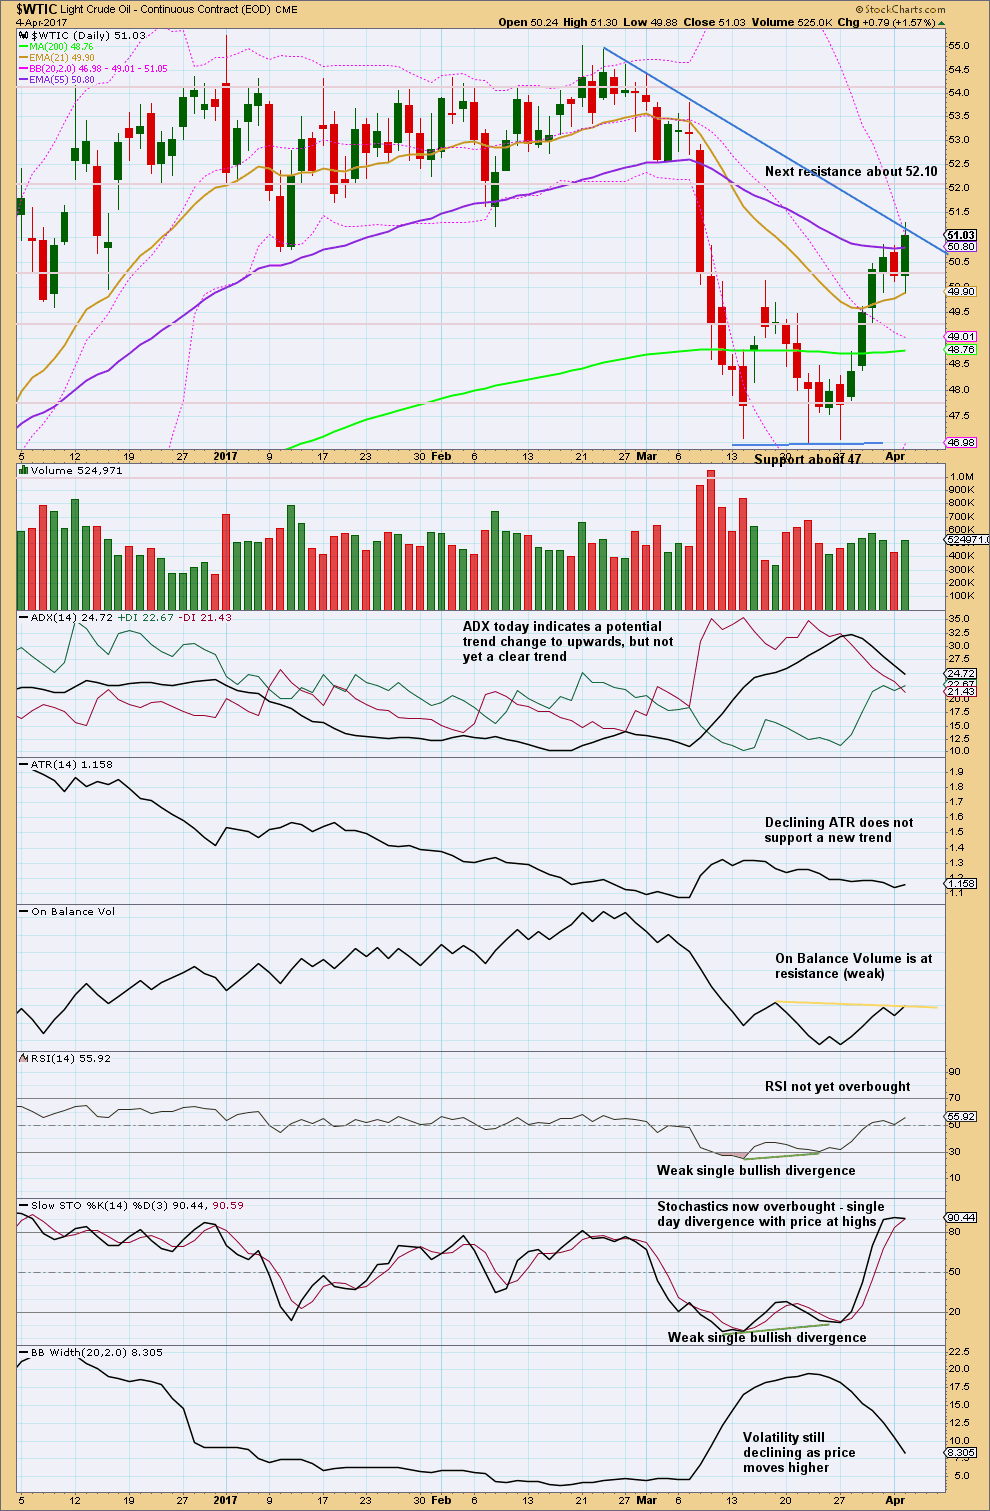
Volume increased for the first three days of upwards movement, supporting the rise in price.
The last three days have lighter volume.
This last upwards day shows some increase in volume above the prior downwards day. So there is still support for the rise in price, but it is lighter than the previous upwards day of the 30th of March. This is slightly bearish.
Stochastics is overbought and exhibits divergence with price at today’s high. Price is at the upper edge of Bollinger Bands, so it may find some resistance here.
On Balance Volume supplies weak resistance, but this may assist to halt the rise in price here.
ADX, ATR and contracting Bollinger Bands all indicate this upwards movement is likely a counter trend movement.
VOLATILITY INDEX
Click chart to enlarge. Chart courtesy of StockCharts.com.
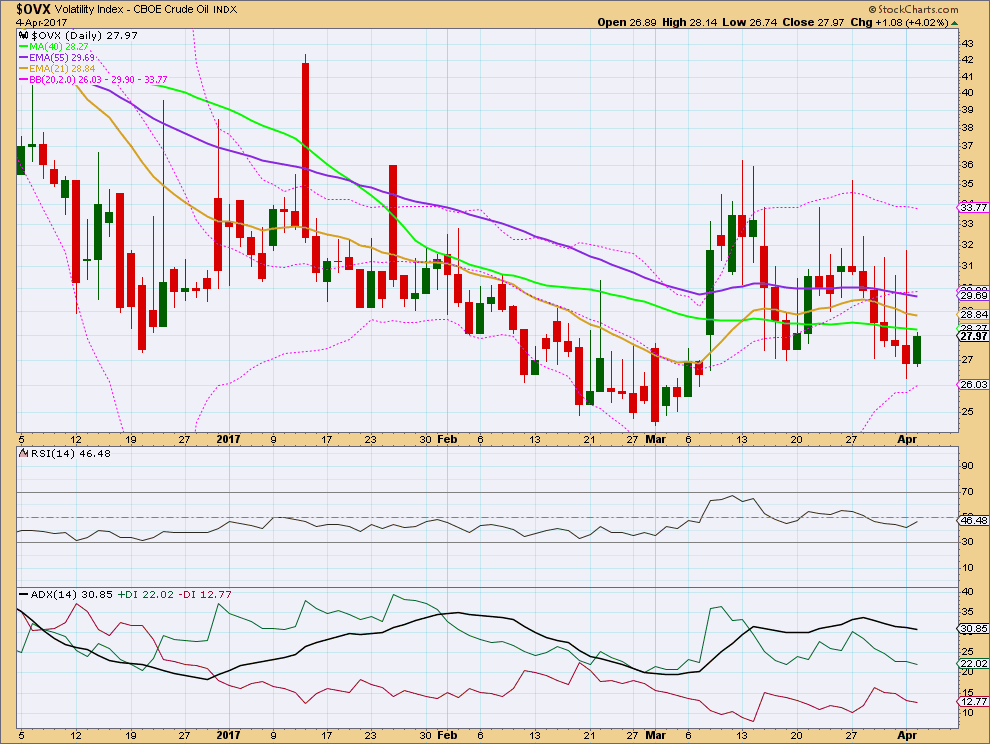
Normally, volatility should decline as price rises and volatility should increase as price falls. Divergence from this normal can provide a bullish or bearish signal for Oil.
Price moved higher today but volatility increased. This single day divergence supports the idea that the rise in price may stop here.
This analysis is published @ 09:03 p.m. EST.
Hi Lara,
what are your thoughts and analysis to the current situation?
Thanks
Ursula
Any ideas about oil’s move up today? The move down yesterday from the highs looks like a 3 wave structure…
Possibly ending diagonal?
Would appreciate your thoughts Lara.
it looks like the alternate option now… looking forward to the update today.
Thanks Lara
Alternative may be right. Exceptional “potential” top tick at 0.618 fib retrace.
Thanks Lara.
That long upper wick on the last red daily candlestick looks pretty bearish. It looks like Oil is turning.