
After publication of last week’s analysis price broke above the channel on the 2 hourly chart, indicating a trend change. The 0.382 and 0.618 Fibonacci ratios were targets. Price rose up to 17.027, just 0.025 of the 0.382 Fibonacci ratio.
Summary: A bounce may be over here today. The target for the next wave down is at 15.44.
New updates to this analysis are in bold.
Last monthly chart is here.
ELLIOTT WAVE COUNT
FIRST WEEKLY CHART
Click chart to enlarge.
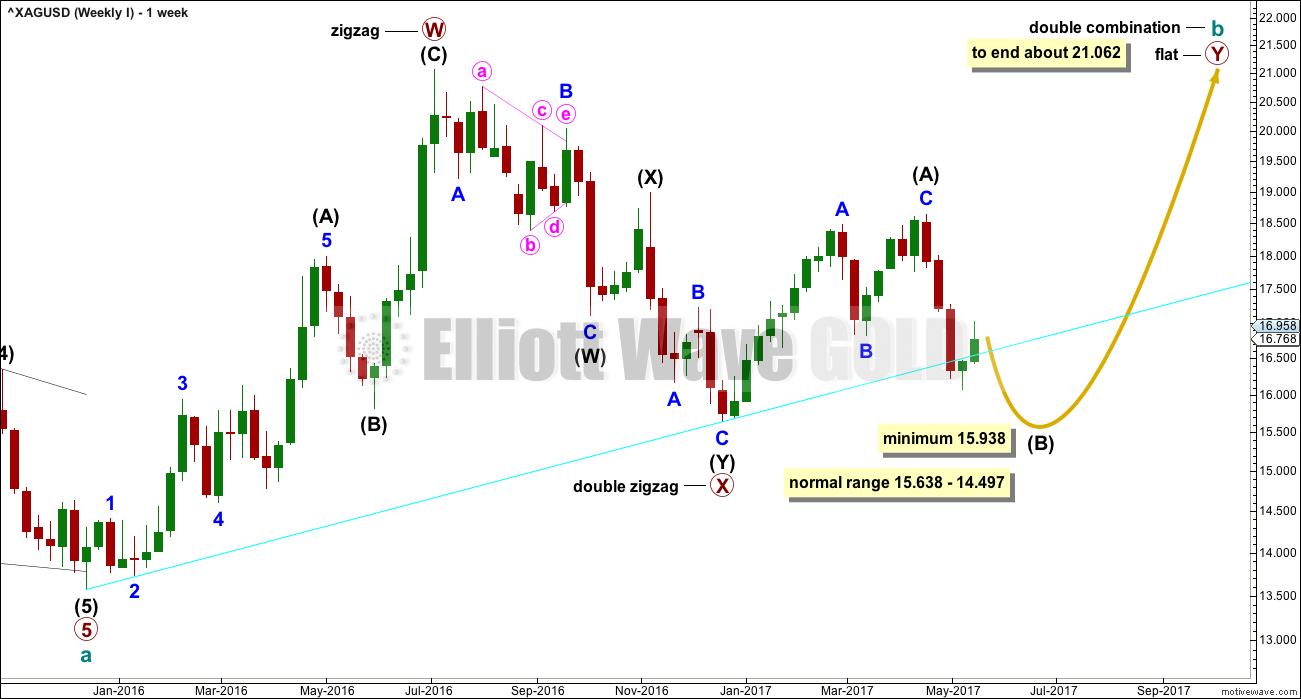
Cycle wave b may be completing as a double combination: zigzag – X – flat. The second structure, a flat correction for primary wave Y, may be underway.
Within a flat correction, intermediate wave (B) must retrace a minimum 0.9 length of intermediate wave (A) at 15.938. The common range for intermediate wave (B) is from 1 to 1.38 the length of intermediate wave (A).
Intermediate wave (B) may make a new price extreme beyond the start of intermediate wave (A), as in an expanded flat, which are very common structures.
The bigger picture for cycle wave b would expect primary wave Y to end about the same level as primary wave W about 21.062. The purpose of combinations is to take up time and move price sideways. To achieve this purpose the second structure in the double normally ends about the same level as the first.
The maximum number of corrective structures is three within combinations (and double zigzags). This maximum applies to sub-waves W, Y and Z. Within these structures, they may only be labelled as simple A-B-C corrections (or A-B-C-D-E in the case of triangles). They may not themselves be labeled multiples as that would increase the number of corrections within the structure beyond three and violate the rule.
X waves are joining structures and they are not counted in the maximum total of three (otherwise the maximum would be five). X waves may be any corrective structure, including multiples.
FIRST DAILY CHART
Click chart to enlarge.
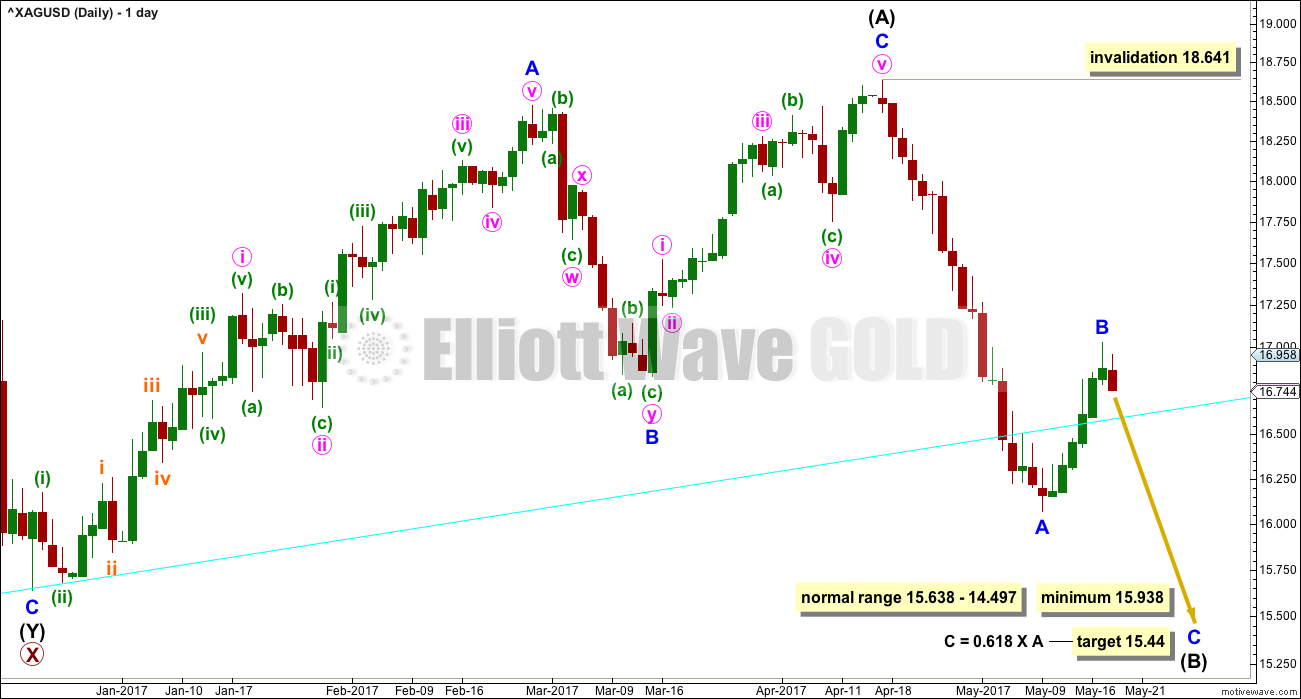
Intermediate wave (B) may be unfolding as a zigzag. Within Intermediate wave (B), minor wave A looks like an impulse. Minor wave B may not move beyond its start above 18.641.
Minor wave B has reached up to just short of 0.382 the length of minor wave A. The bearish engulfing candlestick pattern and long upper wicks on the last two daily candlesticks looks like a trend change here. This may be the end of minor wave B, or it may only be the middle of minor wave B.
At this stage, a target is calculated for minor wave C to end which would see intermediate wave (B) meet the minimum requirement for a flat correction.
SECOND WEEKLY CHART
Click chart to enlarge.
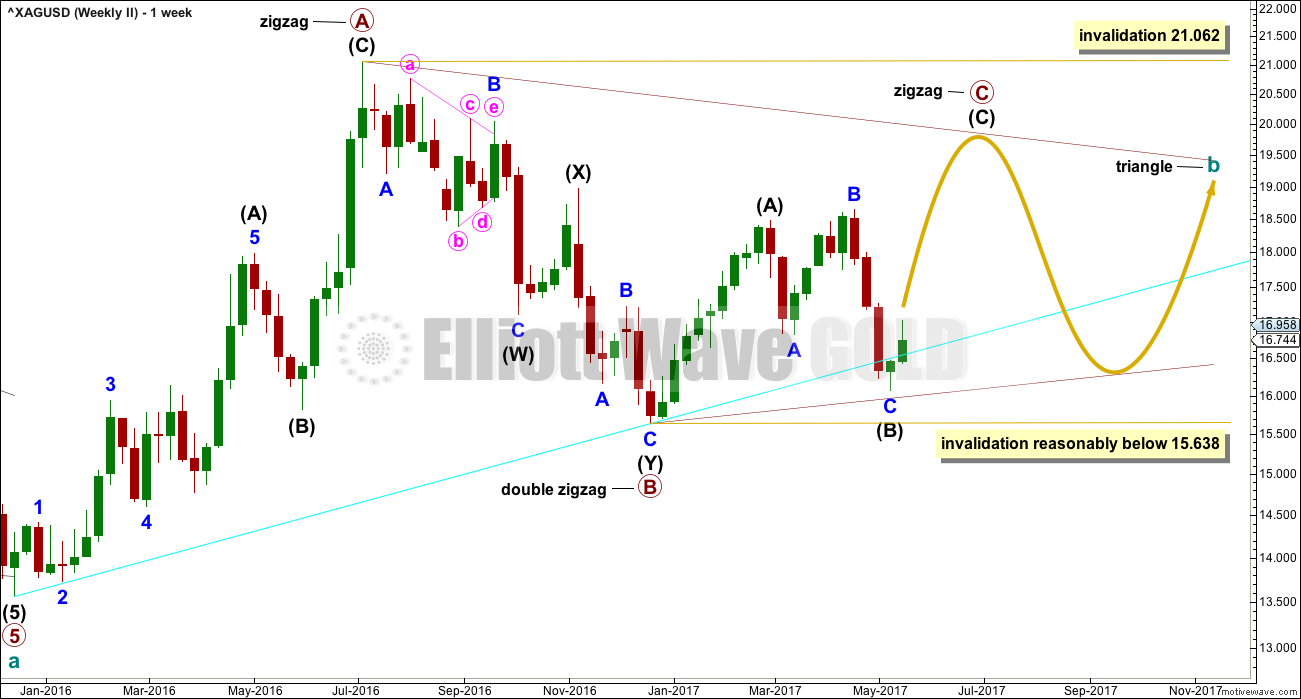
It is also possible that cycle wave b may be completing as a triangle. Only because combinations are more common than triangles is this a second wave count.
Within a triangle, only one of the sub-waves may be a more complicated multiple. Primary wave B subdivides as a double zigzag. Primary waves C, D and E may only be single threes.
Within a contracting or barrier triangle, primary wave C may not move beyond the end of primary wave A above 21.062.
To label primary wave C over at the last high of the 17th of April would see the A-C trend line too steeply sloped to have a normal look. It would be only a 0.55 length of primary wave B, which is unusually short for a triangle sub-wave. It would look more likely that primary wave C is not over.
Within a contracting triangle, primary wave D (nor any part of primary wave C) may not move beyond the end of primary wave B below 15.638.
Within a barrier triangle, primary wave D should end about the same point as primary wave B. As long as the B-D trend line remains essentially flat the triangle will remain valid. In practice, this means that primary wave D may move slightly below the end of primary wave B (this is the only Elliott wave rule which is not black and white).
The final wave of primary wave E may not move beyond the end of primary wave C. It would most likely fall short of the A-C trend line.
This second wave count expects a large consolidation to continue for months.
SECOND DAILY CHART
Click chart to enlarge.
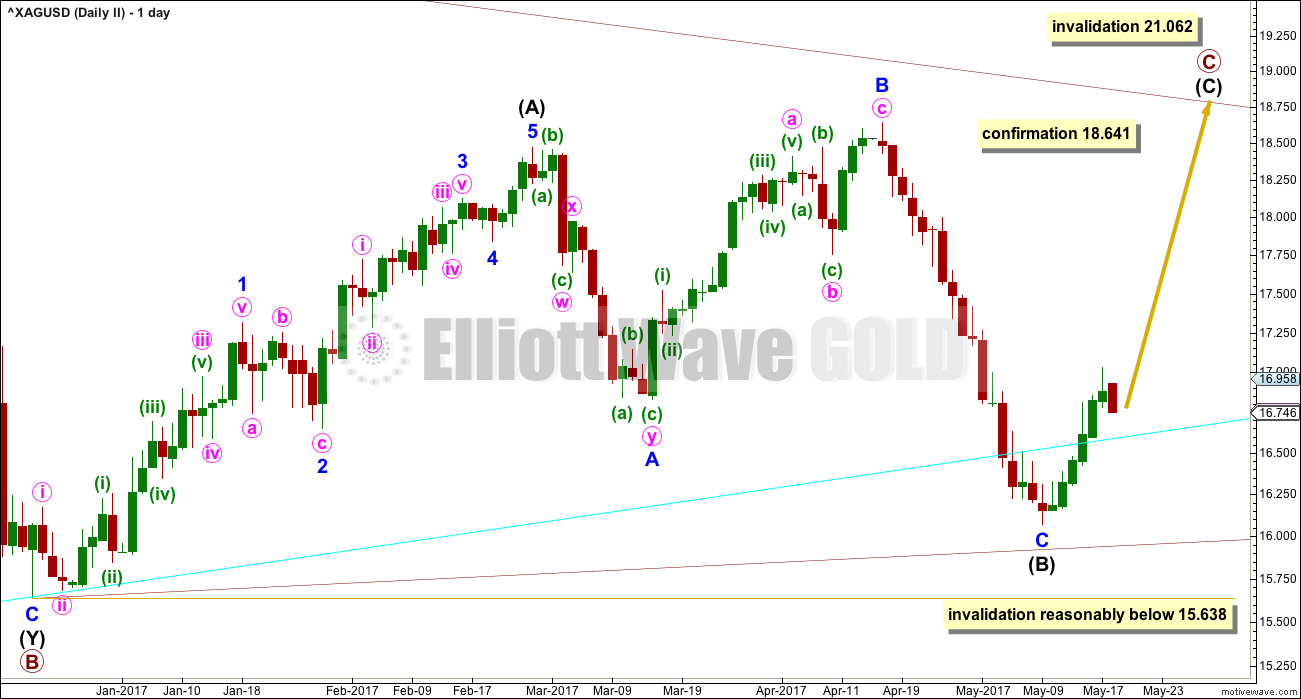
Primary wave C may be an incomplete zigzag.
A new high above 18.641 would at this stage invalidate the first wave count and provide some confirmation of this second wave count.
A new low reasonably below 15.638 would see this second wave count invalidated and the first wave count increase in probability.
Upwards movement needs to overall continue here for this wave count to retain the right look.
TECHNICAL ANALYSIS
WEEKLY CHART
Click chart to enlarge. Chart courtesy of StockCharts.com.
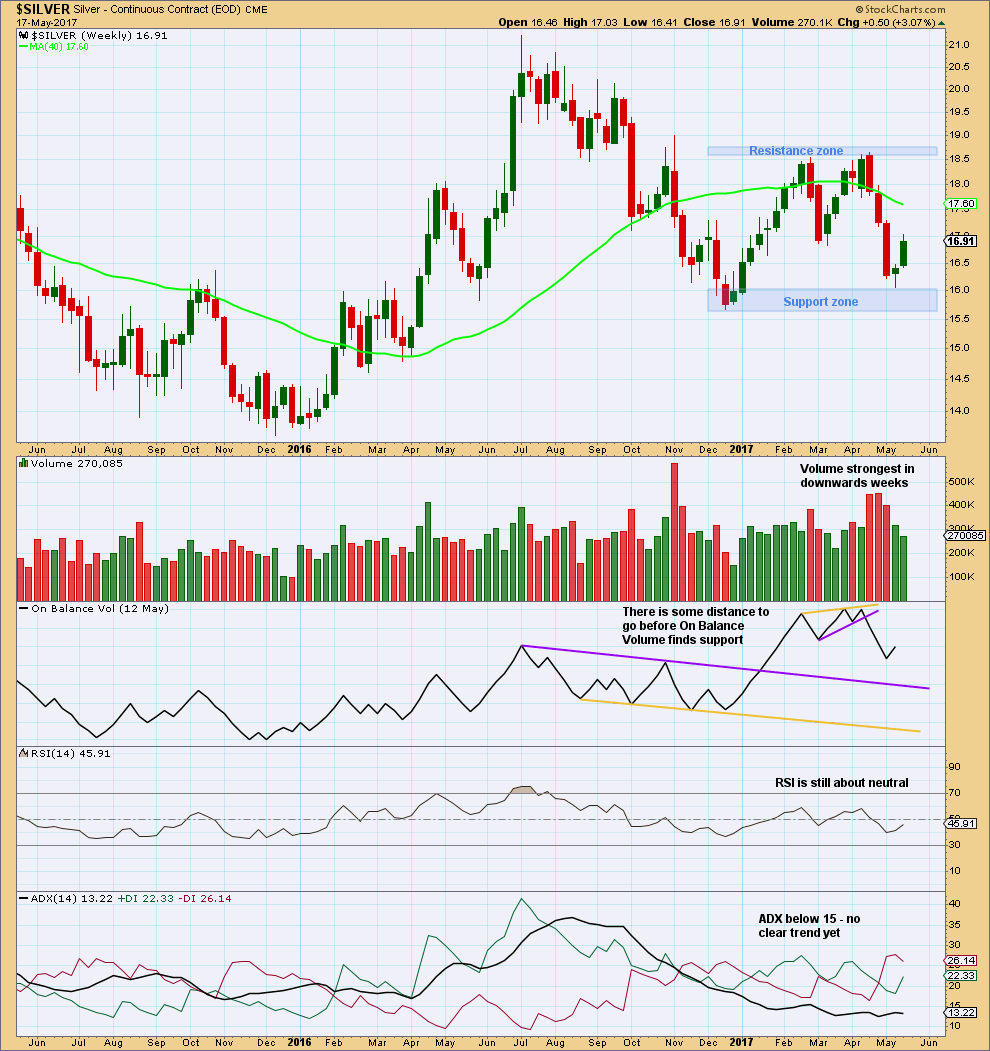
Volume for the last upwards week is much lighter than prior downwards weeks. No conclusion may be drawn about the current week as it still has Friday to close before the weekly volume is known.
Overall, Silver is now in a large consolidation at the weekly chart level. Support is about 16.05 – 15.70 and resistance is about 18.55 – 18.65. It is four downwards weeks that have strongest volume during this period and this strongly suggests a downwards breakout. ADX agrees that price is consolidating.
DAILY CHART
Click chart to enlarge. Chart courtesy of StockCharts.com.
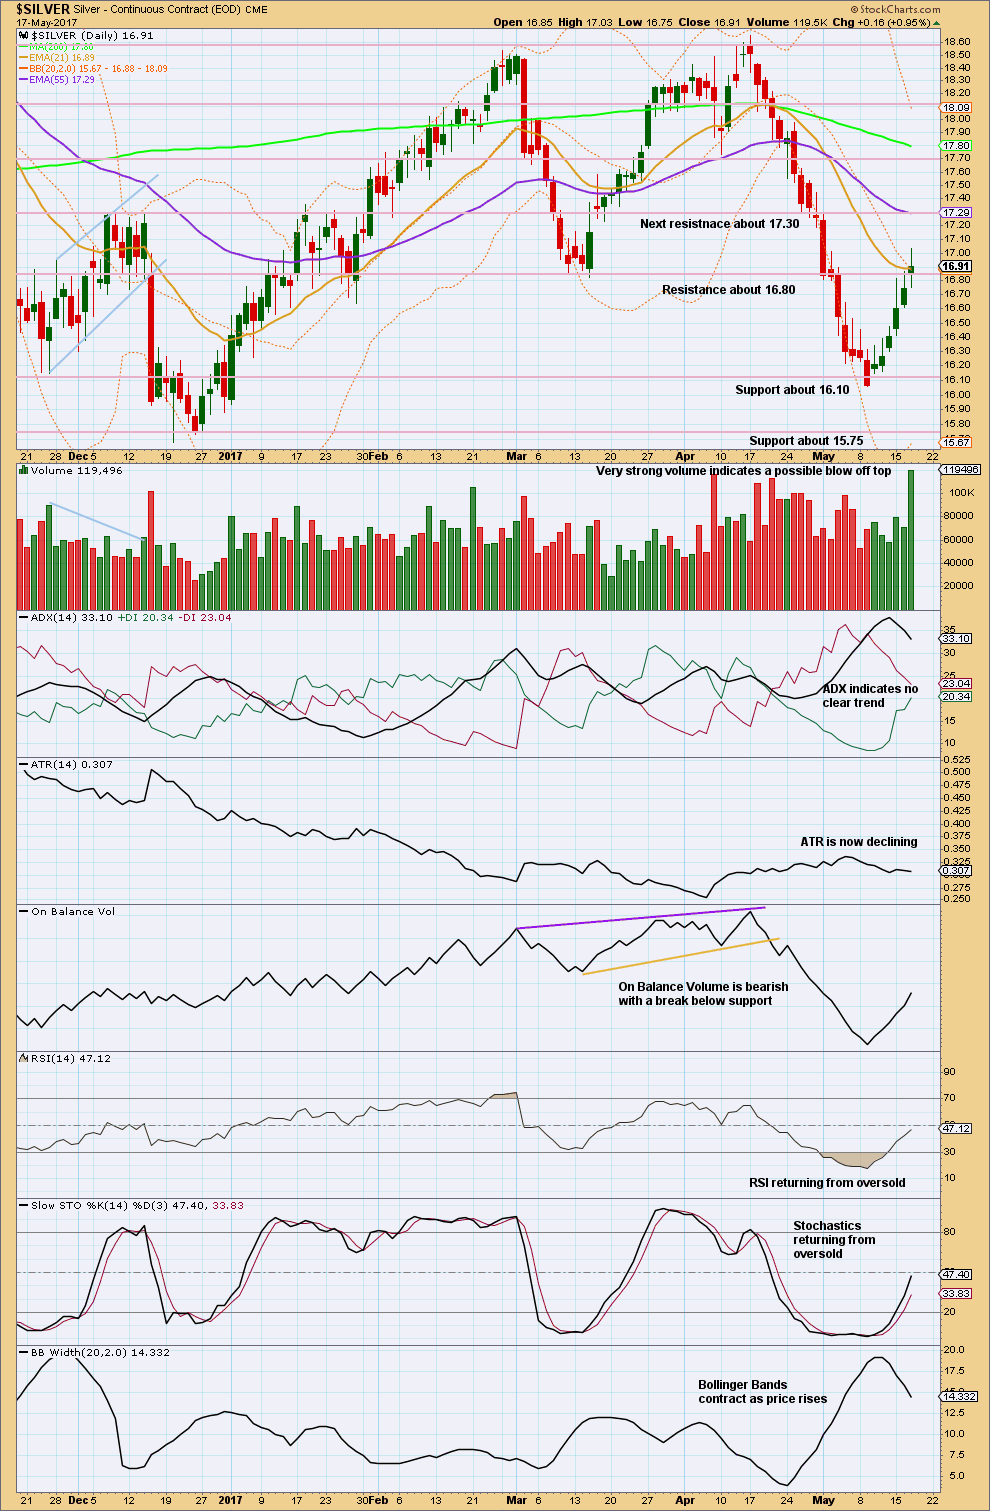
ADX indicates no clear trend. ATR is declining and Bollinger Bands are contracting. The upwards movement of the last six days lacks range and volatility. At this stage, it does not look like a healthy new trend. It looks like a counter trend bounce.
Very strong volume today looks like a blow off top. The bounce may be over here. The Spinning Top candlestick pattern puts the trend into neutral. All prior five daily candlesticks have long upper wicks and this is bearish.
RSI and Stochastics are both neutral. There is plenty of room for price to rise or fall.
This analysis is published @ 03:35 a.m. EST.
you might be interested in:
https://www.edelsoninstitute.com/gold-silver/silver-seen-bottom/?sc=WAV-E
Thanks Ursula.
I wish it explained the reasoning behind the prediction. It’s kinda hard to evaluate it without that information.