
Short term analysis is given today to help members manage profitable short positions on Oil.
Summary: The target is at 28.61 minimum. Downwards movement may show a further increase in momentum. Stops may now be set just above the Elliott wave invalidation point at 48.22.
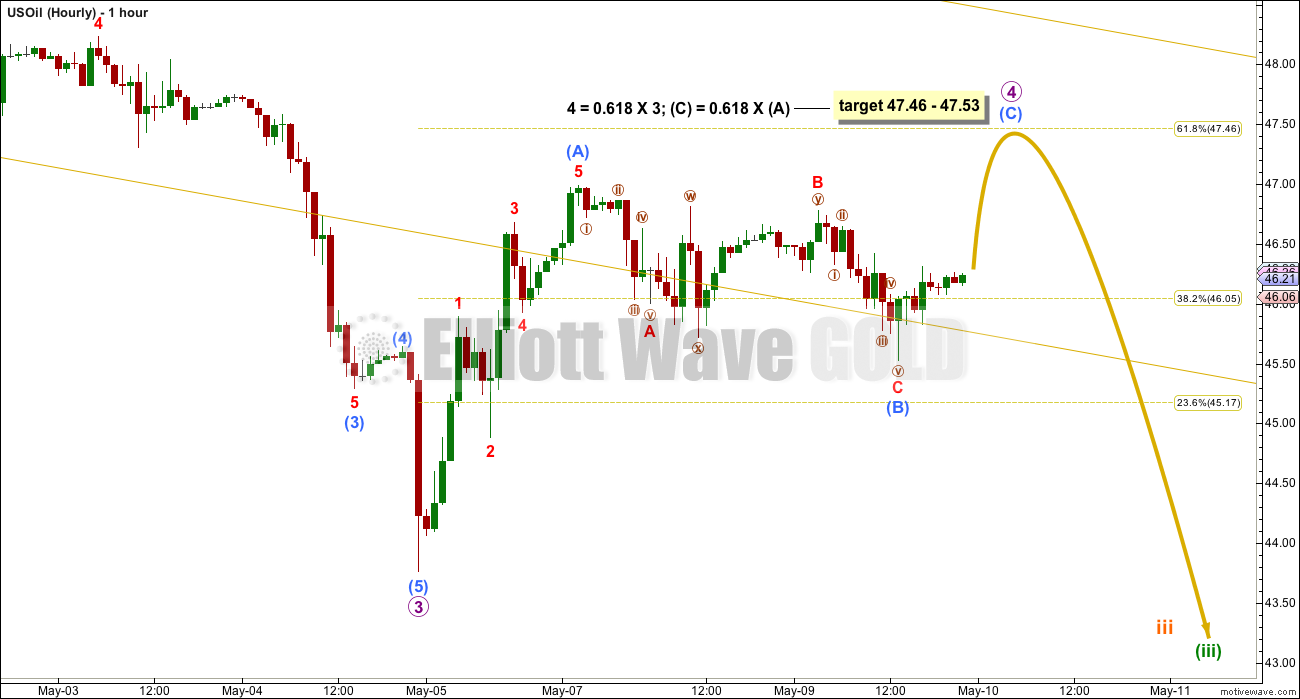
In the short term, Oil may be in a small consolidation that may end about 47.46 to 47.53. If price does bounce up to this area then reverse, it may offer another opportunity to join the downwards trend or to add to short positions.
New updates to this analysis are in bold.
MONTHLY ELLIOTT WAVE COUNT
Click chart to enlarge.
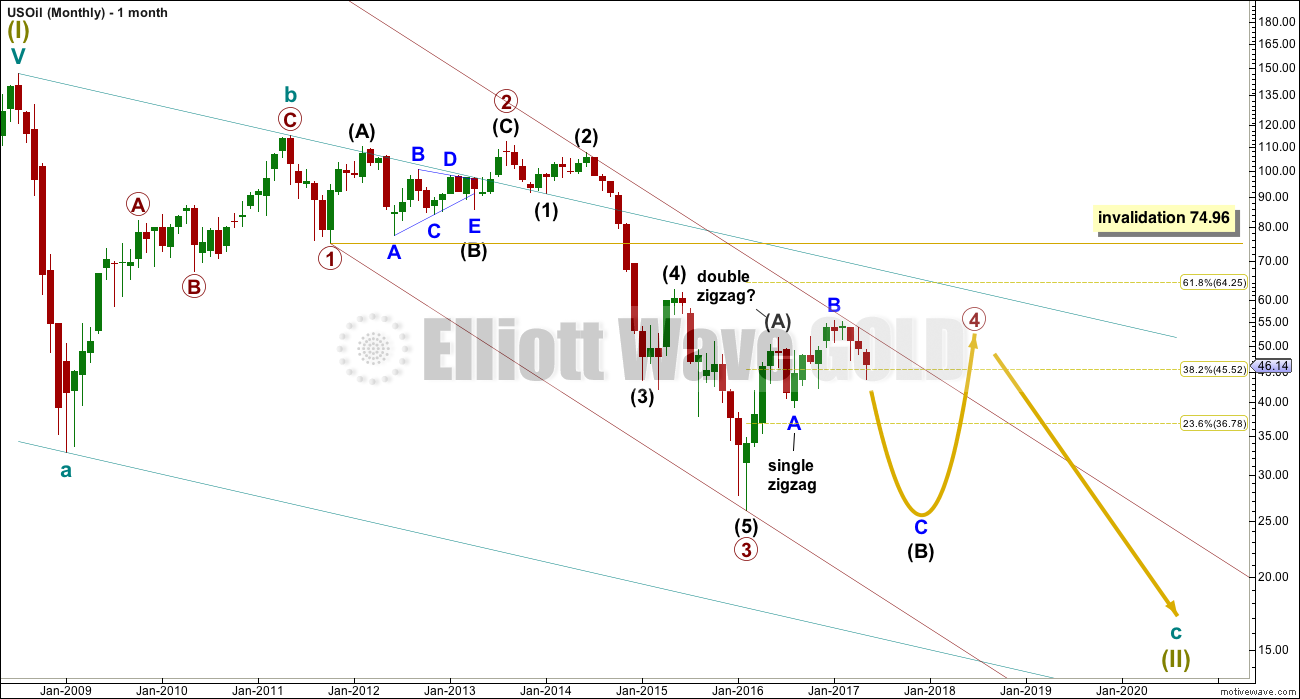
Within the bear market, cycle wave b is seen as ending in May 2011. Thereafter, a five wave structure downwards for cycle wave c begins.
Within cycle wave c, at this stage it does not look like primary wave 5 could be complete. That would only be possible if primary wave 4 was over too quickly.
Primary wave 1 is a short impulse lasting five months. Primary wave 2 is a very deep 0.94 zigzag lasting 22 months. Primary wave 3 is a complete impulse with no Fibonacci ratio to primary wave 1. It lasted 30 months.
Primary wave 4 is likely to exhibit alternation with primary wave 2. Primary wave 4 is most likely to be a flat, combination or triangle. Within all of these types of structures, the first movement subdivides as a three. The least likely structure for primary wave 4 is a zigzag.
Primary wave 4 is likely to end within the price territory of the fourth wave of one lesser degree; intermediate wave (4) has its range from 42.03 to 62.58.
If primary wave 4 is incomplete, then it looks like it may not remain contained within the channel. Sometimes fourth waves overshoot channels and this is why Elliott developed a second technique to redraw the channel when it does not contain a fourth wave.
Primary wave 4 is most likely to be shallow to exhibit alternation in depth with primary wave 2. So far it has passed the 0.382 Fibonacci ratio at 45.52. It may now continue to move mostly sideways in a large range.
Primary wave 4 may not move into primary wave 1 price territory above 74.96.
At this stage, primary wave 4 has completed intermediate wave (A) only. Intermediate wave (B) is incomplete.
WEEKLY ELLIOTT WAVE COUNT
Click chart to enlarge.
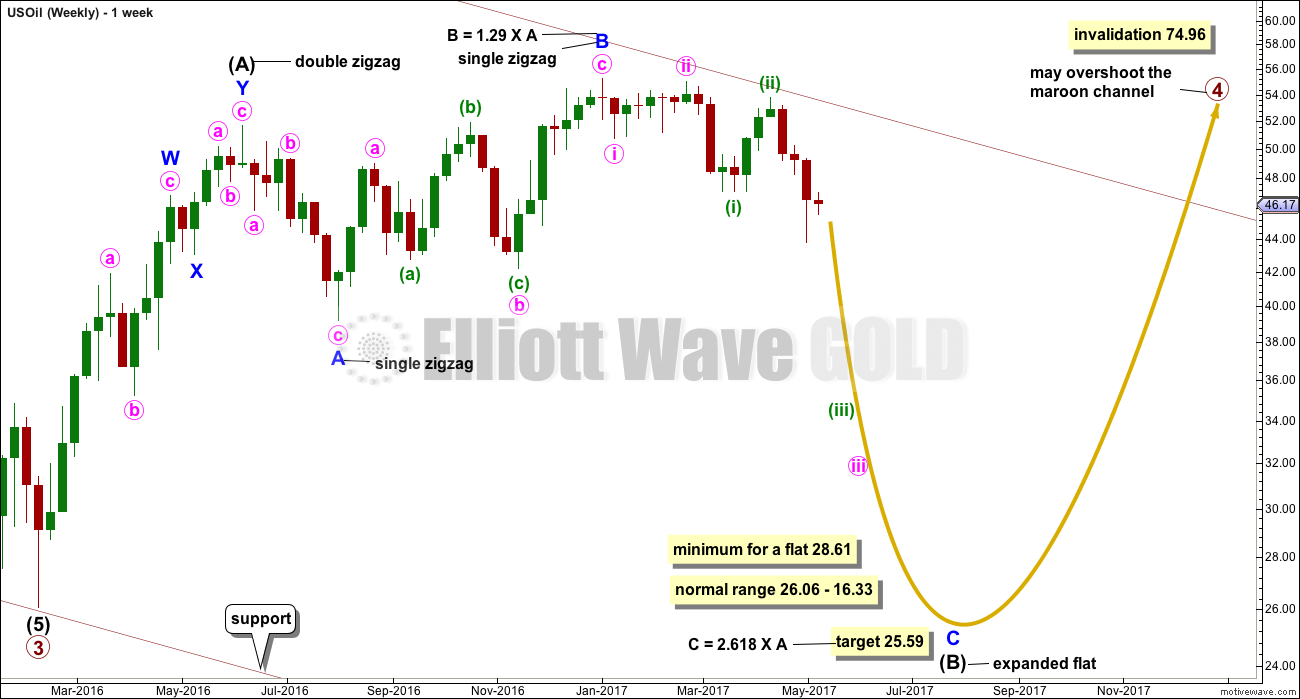
The whole structure of primary wave 4 is seen here in more detail.
The first wave labelled intermediate wave (A) is seen as a double zigzag, which is classified as a three.
Intermediate wave (B) is also a three. This means primary wave 4 is most likely unfolding as a flat correction if my analysis of intermediate wave (A) is correct. Flats are very common structures.
Intermediate wave (B) began with a zigzag downwards. This indicates it too is unfolding most likely as a flat correction.
Within intermediate wave (B), the zigzag upwards for minor wave B is a 1.29 correction of minor wave A. This indicates intermediate wave (B) may be unfolding as an expanded flat, the most common type.
The normal range for intermediate wave (B) within a flat correction for primary wave 4 is from 1 to 1.38 the length of intermediate wave (A) giving a range from 26.06 to 16.33.
Primary wave 4 may not move into primary wave 1 price territory above 74.96.
Within the larger expanded flat correction of primary wave 4, intermediate wave (B) must retrace a minimum 0.9 length of intermediate wave (A) at 28.61 or below.
DAILY ELLIOTT WAVE COUNT
Click chart to enlarge.
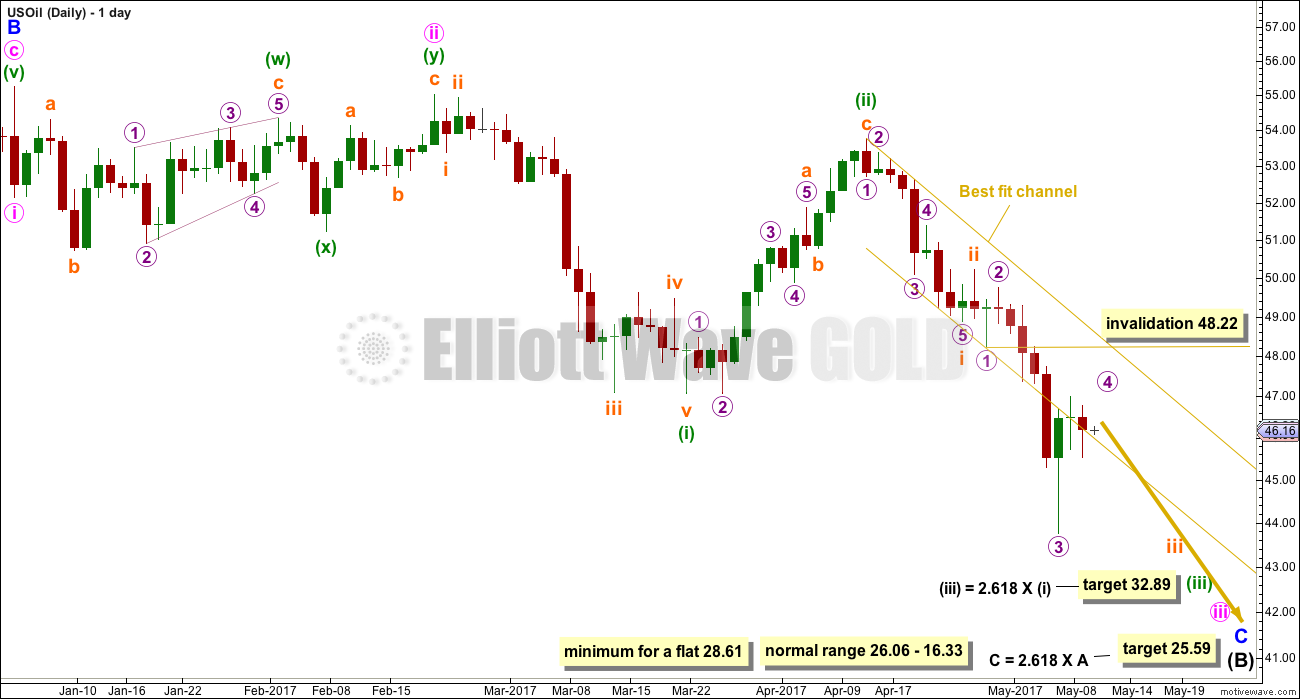
Minor wave C downwards must subdivide as a five wave structure.
Within minor wave C, minute waves i and ii should be complete and minute wave iii must be incomplete. Upwards movement, which is labelled minuette wave (ii), cannot be minute wave iv as it overlaps back into minute wave i price territory.
Within minute wave iii, minuette waves (i) and (ii) are complete. Minuette wave (iii) must move below the end of minuette wave (i) and stay far below that point at 47.06 to allow for enough room for a subsequent correction for minuette wave (iv) to unfold and remain below first wave price territory.
Minuette wave (iii) may only subdivide as an impulse. Because minuette wave (ii) was a very deep correction the appropriate Fibonacci ratio to apply to a target for minuette wave (iii) is 2.618.
The middle of minuette wave (iii) may have passed a few days ago. This wave count expects it is highly likely that micro wave 5 to end subminuette wave iii, or subminuette wave iii to end minuette wave (iii), may be a selling climax. Fifth waves in commodities can be particularly strong, and this tendency turns up very often for fifth waves to end third wave impulses.
Micro wave 4 may not move into micro wave 1 price territory above 48.22. To see if micro wave 4 may be complete an hourly chart is provided this week.
HOURLY ELLIOTT WAVE COUNT
Click chart to enlarge.
The upwards wave labelled sub-micro wave (A) fits better as a five than it does as a three. If this is correct, then micro wave 4 may be incomplete.
Sub-micro wave (C) would be very likely to make at least a slight new high above the end of sub-micro wave (A) at 46.99 to avoid a truncation.
Micro wave 2 was a deep 0.8 zigzag. Given the guideline of alternation, micro wave 4 may be expected to be more shallow; it would not be expected to be much if at all deeper than the 0.618 Fibonacci ratio of micro wave 3.
TECHNICAL ANALYSIS
DAILY CHART
Click chart to enlarge. Chart courtesy of StockCharts.com.
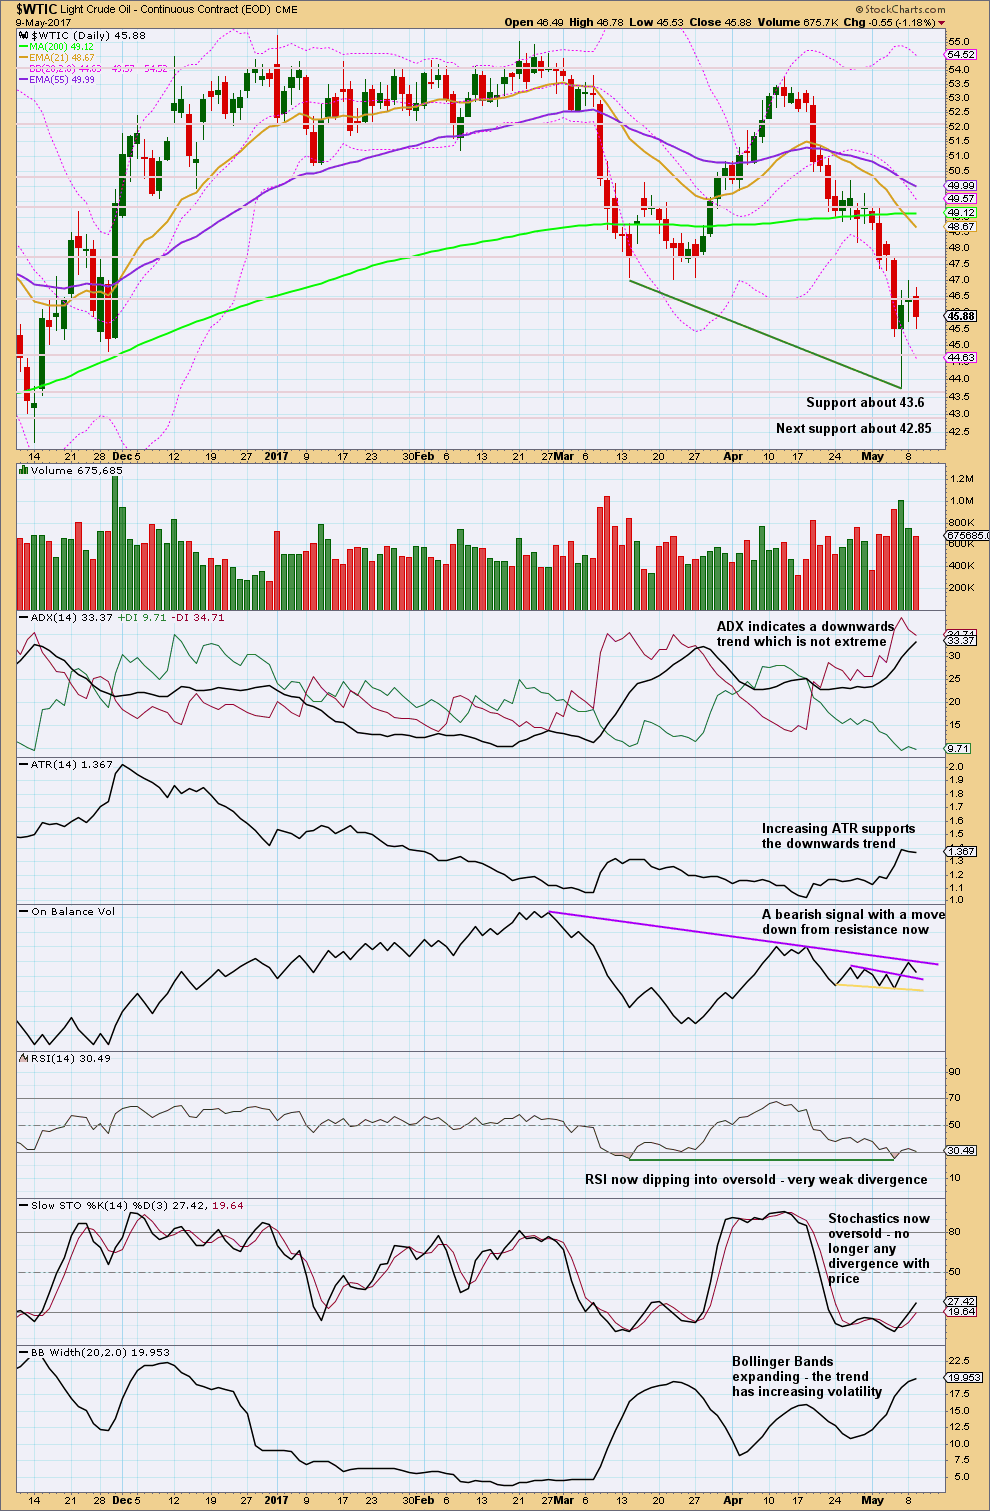
The long lower wick on the candlestick for the 5th of May completes a hammer reversal pattern. Hammers at the end of a downtrend signal a reversal of trend from down to up, or down to sideways. Further, they make no comment on how far or how long the next trend may travel.
In short, hammers on their own do not necessarily signal the end of a trend.
The next candlestick is a doji, which puts the trend into neutral. Followed now by a downwards day with a decline in volume it looks most likely that Oil has entered a small consolidation, a pause within the larger trend.
Resistance for On Balance Volume may halt the rise in price here. The small bullish signal from On Balance Volume is too weak to signal an end to the trend here.
Some weak bullish divergence with RSI is also too weak to signal the end of the trend.
ADX is not extreme. There is plenty of room for the trend to continue. Price remains below all three moving averages.
When Oil trends strongly, its indicators may reach extreme levels and stay there for reasonably long periods of time.
The two charts below looking at a strong trend in Oil are provided as an illustration of how indicators can behave during a strong trend. That does NOT mean this is how Oil must behave now. The current trend may end here or it may continue for several weeks. The study below is used to illustrate what may be looked for to see if the trend is complete.
DAILY CHART – TREND (Jun 2014 – Feb 2015)
Click chart to enlarge. Chart courtesy of StockCharts.com.
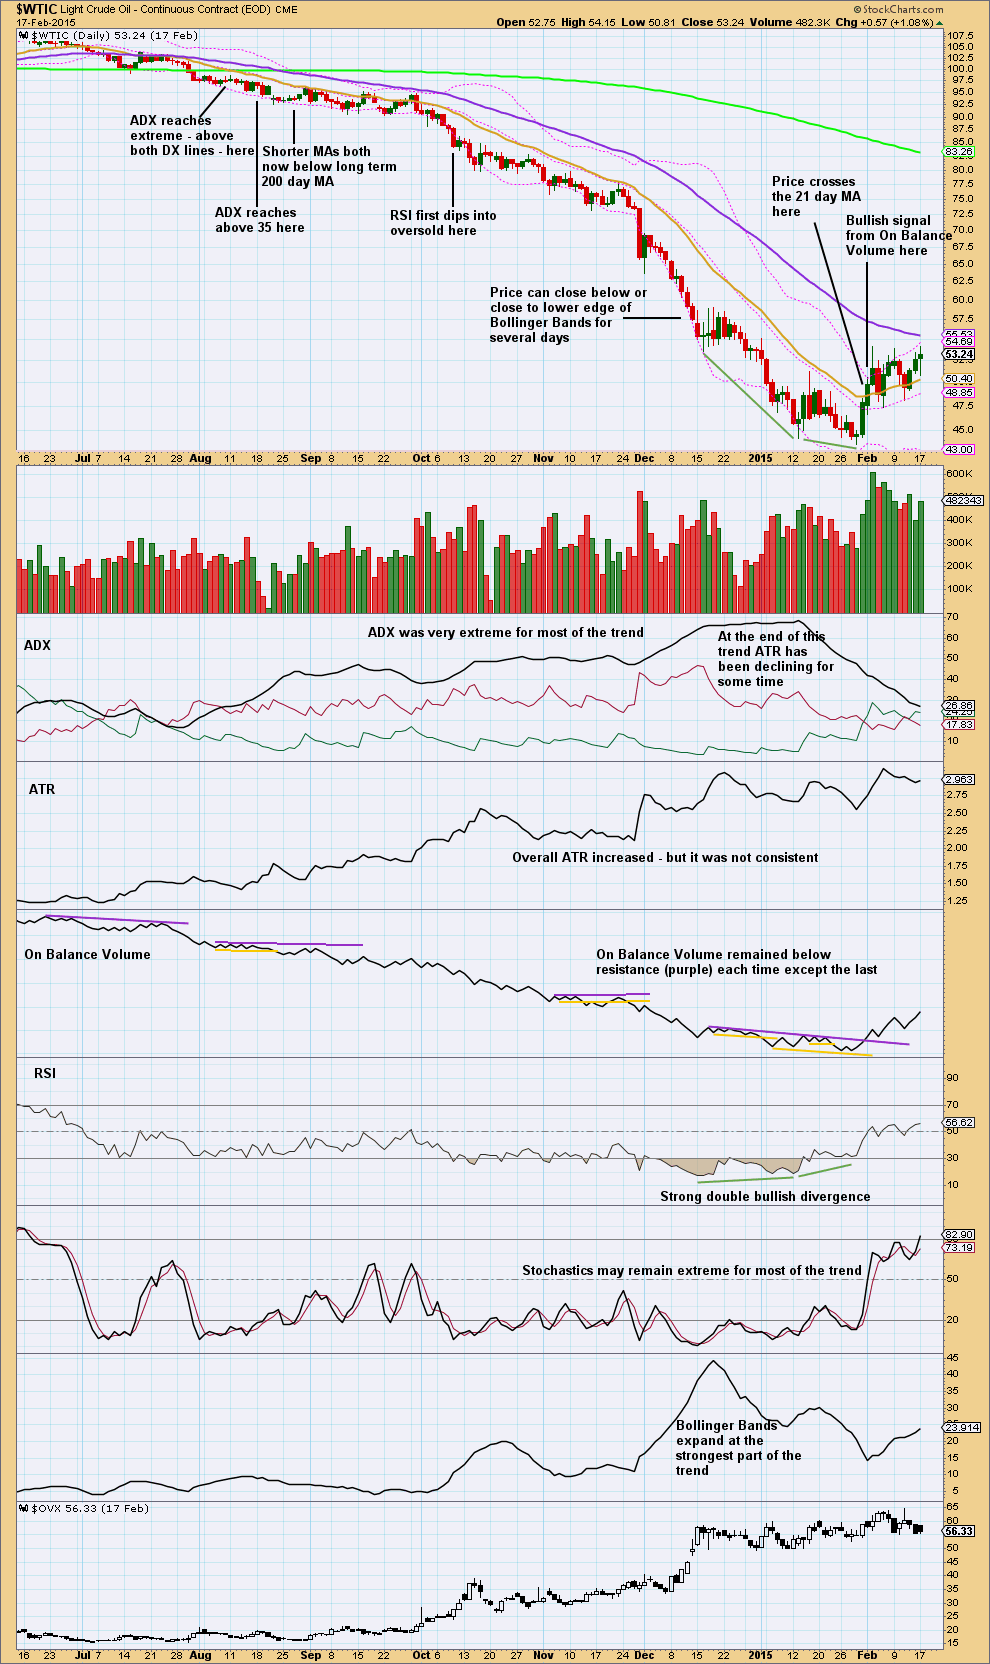
This chart is an example of how extreme indicators can get if / when Oil trends strongly.
Not shown on the chart are smaller examples of bullish divergence with price and RSI, which were followed by more downwards movement. When looking for bullish divergence to assist to find a low, it is important that the divergence be strong and clear and not weak.
The one indicator that would have helped traders to hold short positions throughout this trend would have been On Balance Volume. Using the purple resistance lines only (not yellow), each time one of those lines could be drawn across multiple pivots On Balance Volume remained below the line. At no time during the trend did On Balance Volume give a bullish signal with a purple line. A few false bullish signals were given with yellow support lines after they were breached, so those should not be used.
It is instructive how extreme ADX and RSI reached so early on in the trend.
Divergence between Oil price and Volatility would have seen the trade exited too early on the 17th November, 2014.
DAILY CHART – TREND LINES (Jun 2014 – Feb 2015)
Click chart to enlarge. Chart courtesy of StockCharts.com.
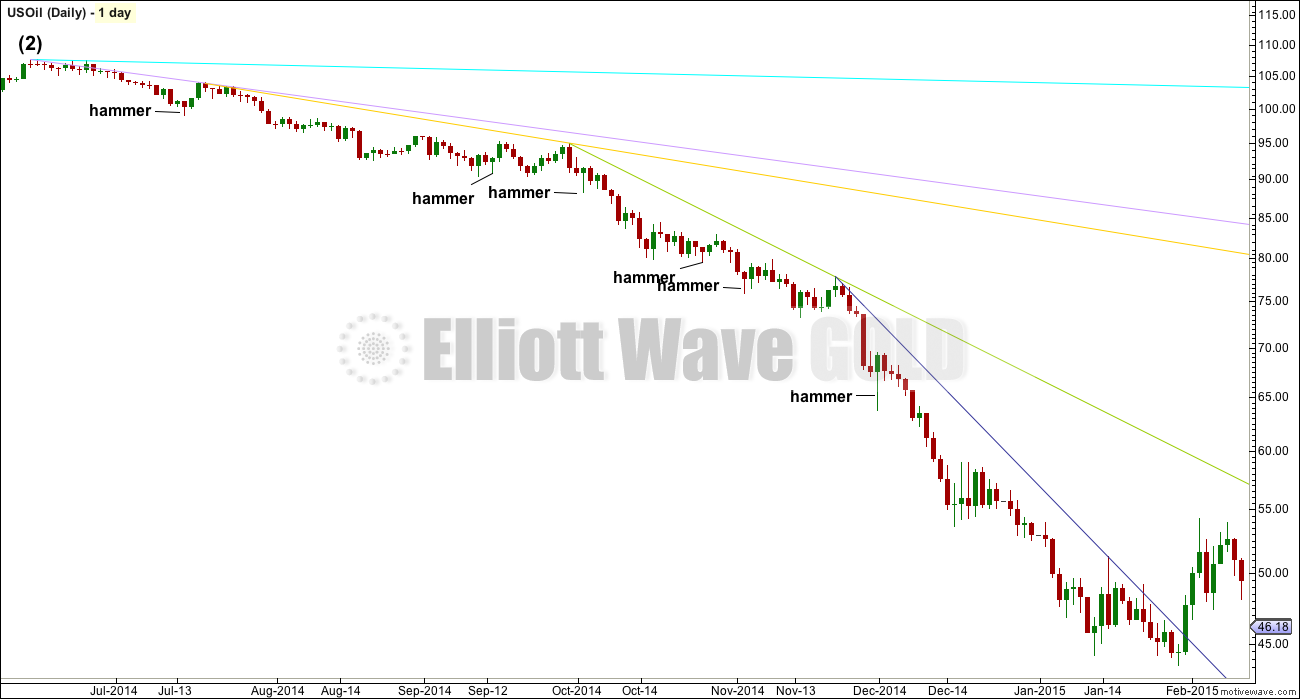
The best technique to exit a strong trend from Oil may be simple trend lines.
By drawing extended trend lines across swing highs a series of lines can be drawn for a strong trend in Oil (this technique also works for other commodities).
Commodities tend to have curved trends. They start of relatively slowly, accelerate towards the middle, then explode at their ends.
When the latest trend line is clearly breached by a strong upwards day (not overshot by a sideways movement), then it may be a signal to exit. If that comes in conjunction with strong clear divergence with price and RSI, and RSI is extreme and ADX is extreme, then the signal would be a strong one.
VOLATILITY INDEX
Click chart to enlarge. Chart courtesy of StockCharts.com.
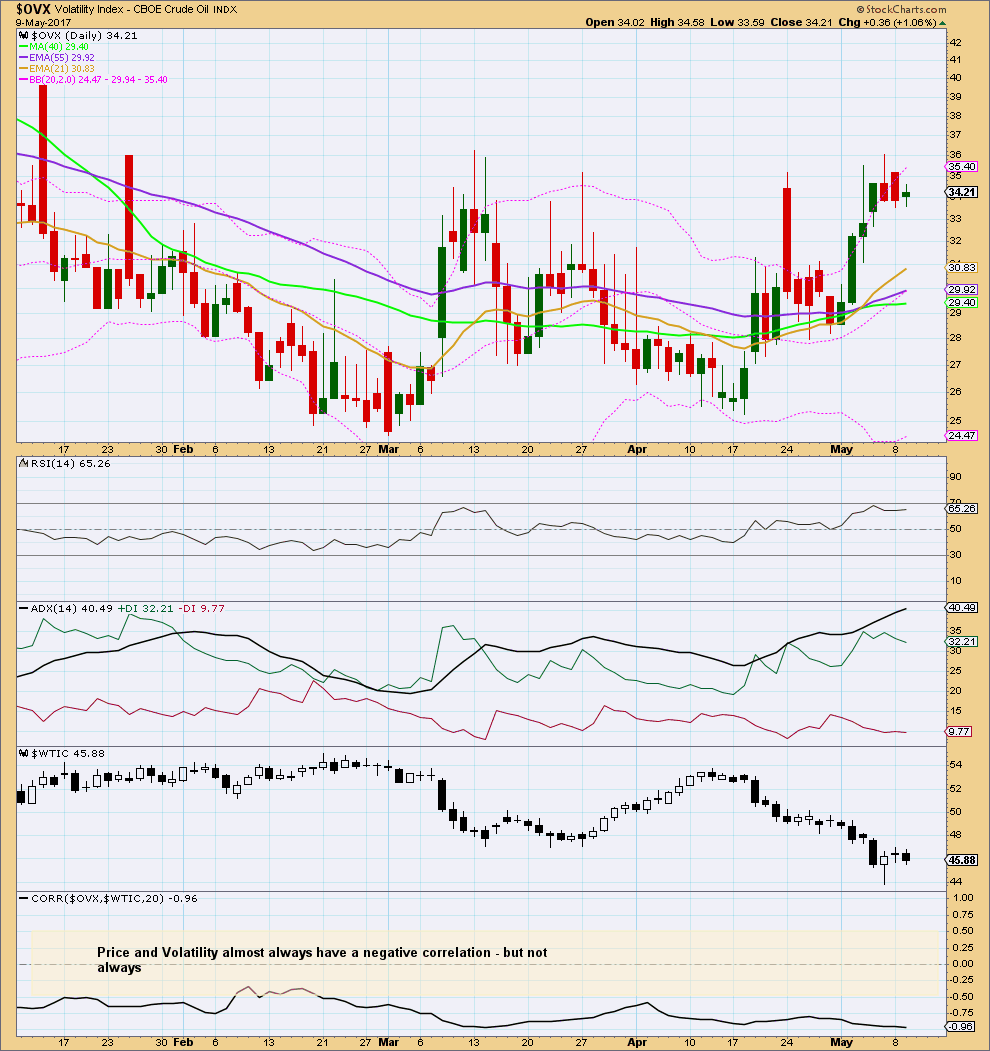
Normally, volatility should decline as price rises and volatility should increase as price falls. Divergence from this normal can provide a bullish or bearish signal for Oil. However, it is noted that this signal occurs both in minor and major lows and it cannot be used to distinguish between them.
There is short term divergence today between price and volatility: price has made a new low, but volatility has not shown a corresponding increase. This divergence is bullish; it indicates weakness in the downwards movement in price. This is not always followed by a reversal (it was seen three days ago on the 27th of April yet was followed by more downwards movement in price), but it is common at reversals.
This analysis is published @ 01:10 a.m. EST.
Will be updating Oil today and answering your questions there.
Lara, is it possible that minuette (ii) is not over, and the uptrend now in USOIL is the C wave of an expanded flat?
Possible, but it wouldn’t look very good.
Minute ii lasted 35 days.
So far minuette (ii), one degree lower, would have lasted 38 days and be incomplete.
The disproportion reduces the probability.
not sure this still looks very corrective in shape
Volume is definitely declining, vs increasing volume for the last fall.
OK we go North – really strongly as far as I can see already over the invalidation point of Lara. Ant suggestions how far we will go? All the way back to about $54?
Looks like a nice backtest to the broken channel. Should be a good place to short.
https://www.tradingview.com/x/txRru5ZT/
Nice. The channel about this downwards movement that I’m drawing on the hourly chart is now repeatedly tested. So far it’s holding.
So far the invalidation point held.
However, that channel is very steep and so that reduces its effectiveness. If price breaks above the upper trend line I’m going to close my short positions and wait for clarity. Stops still just above the invalidation point, holding on.
And hey, that reminds me, the fourth wave “kissing” the first wave, that’s Olga’s favourite set up.
I’m betting Olga’s in on this one!
*waves*
This is the hardest thing ever to do right. Feels so wrong….
We know Oil is in a downwards trend. Classic TA tells us it is, and it’s not yet extreme enough to signal an end.
We have a resistance line. We have an invalidation point.
Today Oil price came up to touch the end of micro 1. Fourth waves can do that. It’s overlapping INTO wave 1 price territory that’s not allowed.
Price has come up to touch the upper edge of the best fit channel. Again. The upwards move so far looks like a three = against the larger trend.
If anyone doesn’t have Oil shorts yet, then this is the time to jump in.
Remember, manage risk! I could be wrong. And if I am you don’t want to let losses run and wipe out your accounts.
Stops just above the invalidation point. Add about 3X your normal broker spread so your position isn’t closed by widening spreads in times of high volatility.
Target 28.61 minimum. For now.
I had a member recently make a comment that he recommended trading without stops. That member subsequently had serious losses when my analysis was wrong. He refused to manage risk.
Trading without stops exposes the entire equity in your account to risk.
I am wrong sometimes. If I’m wrong then risk management will save you.
Refusal to manage risk means your account will be wiped out, of that I am 100% certain.
If new members learn nothing else from me but risk management then I will have done my job well.
Added Cl put today
Lara, I have a question- In the section discussing the hourly chart you wrote: “This wave count expects it is highly likely that micro wave 5 to end subminuette wave iii, or subminuette wave iii to end minuette wave (iii), may be a selling climax.” Did you mean to write subminuette wave v to end minuette (iii)??
Thanks for the update, especially the hourly chart. Great work as always.
Ah yes, thanks for pointing out the mistake.