
Downwards movement was expected after last week’s analysis, but this is not what happened. Price has continued to move higher.
Summary: Divergence today with price and volatility, price and On Balance Volume, and price and Stochastics more strongly suggests the high may be in place here or very soon. Use the channel on the daily chart. Confidence in a trend change may be had when it is clearly breached by downwards movement. Prior to that confidence look for very strong resistance at the cyan trend line on the daily Elliott wave chart.
New updates to this analysis are in bold.
MONTHLY ELLIOTT WAVE COUNT
Click chart to enlarge.
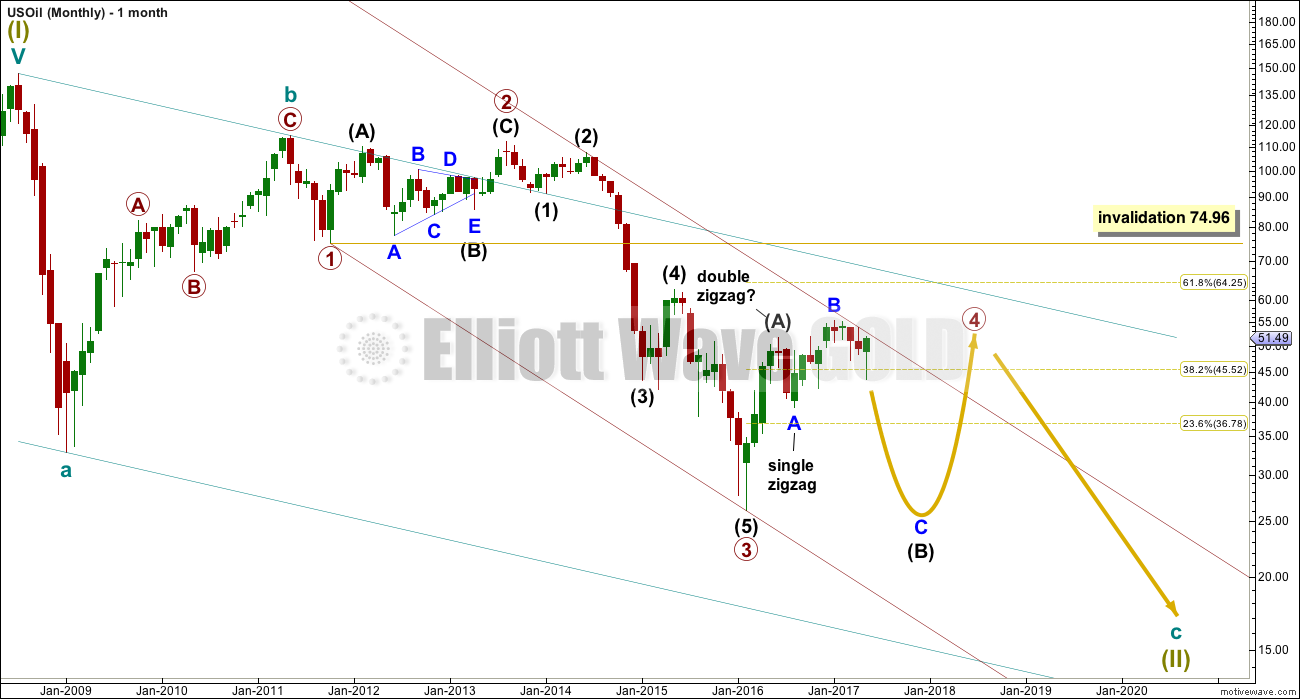
Within the bear market, cycle wave b is seen as ending in May 2011. Thereafter, a five wave structure downwards for cycle wave c begins.
Within cycle wave c, at this stage it does not look like primary wave 5 could be complete. That would only be possible if primary wave 4 was over too quickly.
Primary wave 1 is a short impulse lasting five months. Primary wave 2 is a very deep 0.94 zigzag lasting 22 months. Primary wave 3 is a complete impulse with no Fibonacci ratio to primary wave 1. It lasted 30 months.
Primary wave 4 is likely to exhibit alternation with primary wave 2. Primary wave 4 is most likely to be a flat, combination or triangle. Within all of these types of structures, the first movement subdivides as a three. The least likely structure for primary wave 4 is a zigzag.
Primary wave 4 is likely to end within the price territory of the fourth wave of one lesser degree; intermediate wave (4) has its range from 42.03 to 62.58.
If primary wave 4 is incomplete, then it looks like it may not remain contained within the channel. Sometimes fourth waves overshoot channels and this is why Elliott developed a second technique to redraw the channel when it does not contain a fourth wave.
Primary wave 4 is most likely to be shallow to exhibit alternation in depth with primary wave 2. So far it has passed the 0.382 Fibonacci ratio at 45.52. It may now continue to move mostly sideways in a large range.
Primary wave 4 may not move into primary wave 1 price territory above 74.96.
At this stage, primary wave 4 has completed intermediate wave (A) only. Intermediate wave (B) is incomplete.
WEEKLY ELLIOTT WAVE COUNT
Click chart to enlarge.
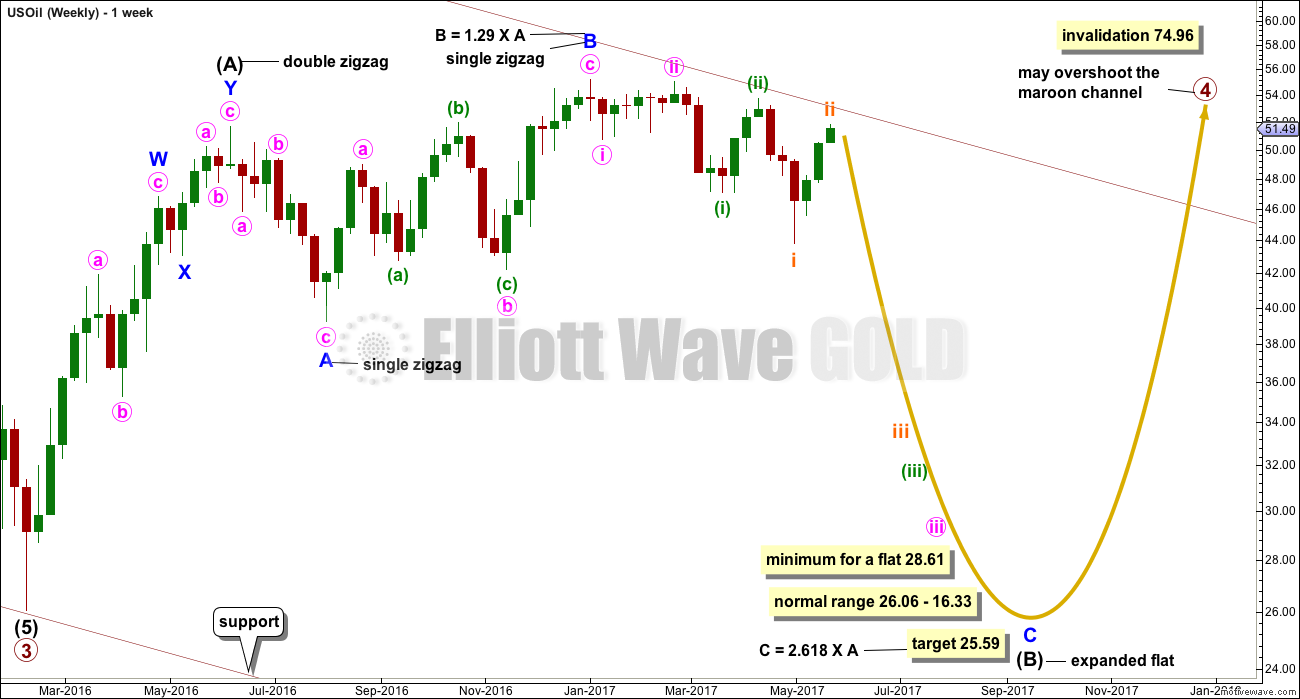
The whole structure of primary wave 4 is seen here in more detail.
The first wave labelled intermediate wave (A) is seen as a double zigzag, which is classified as a three.
Intermediate wave (B) is also a three. This means primary wave 4 is most likely unfolding as a flat correction if my analysis of intermediate wave (A) is correct. Flats are very common structures.
Intermediate wave (B) began with a zigzag downwards. This indicates it too is unfolding most likely as a flat correction.
Within intermediate wave (B), the zigzag upwards for minor wave B is a 1.29 correction of minor wave A. This indicates intermediate wave (B) may be unfolding as an expanded flat, the most common type.
The normal range for intermediate wave (B) within a flat correction for primary wave 4 is from 1 to 1.38 the length of intermediate wave (A) giving a range from 26.06 to 16.33.
Primary wave 4 may not move into primary wave 1 price territory above 74.96.
Within the larger expanded flat correction of primary wave 4, intermediate wave (B) must retrace a minimum 0.9 length of intermediate wave (A) at 28.61 or below.
DAILY ELLIOTT WAVE COUNT
Click chart to enlarge.
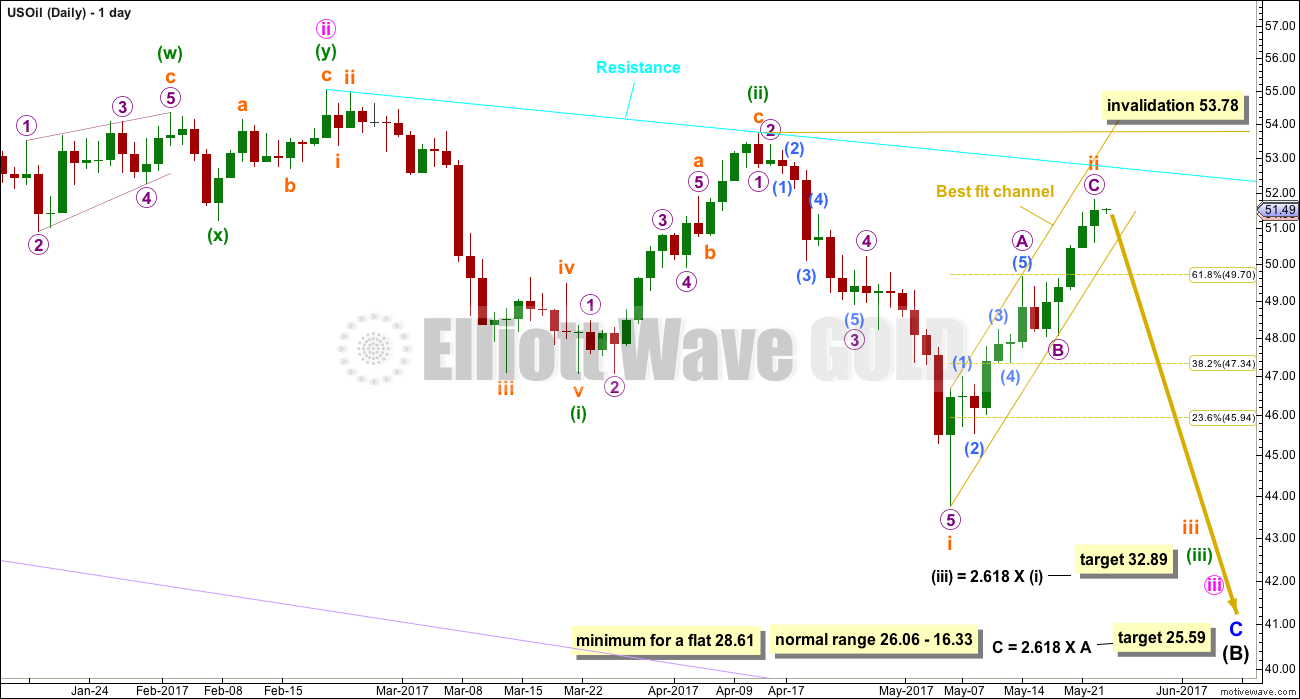
Minor wave C downwards must subdivide as a five wave structure.
This upwards movement cannot be minuette wave (iv) as it has overlapped back into minuette wave (i) price territory. If the larger picture for this wave count is correct in seeing an impulse unfolding lower, then this upwards movement must be another second wave correction. If it continues any higher, it should find very strong resistance at the cyan trend line.
So far now there would be three overlapping first and second waves within this wave count. This indicates a possible strong increase in downwards momentum to come as the middle of a third wave passes.
Subminuette wave ii may not move beyond the start of subminuette wave i above 53.78.
The target for minuette wave (iii) remains the same.
The best fit channel is redrawn about subminuette wave ii. It now has a better look as it is wider. When price clearly breaks below the lower edge of this channel with a downwards (not sideways) movement and a full daily candlestick below and not touching the lower trend line, that shall be a strong indication that the bounce is over and the downwards trend has resumed.
TECHNICAL ANALYSIS
DAILY CHART
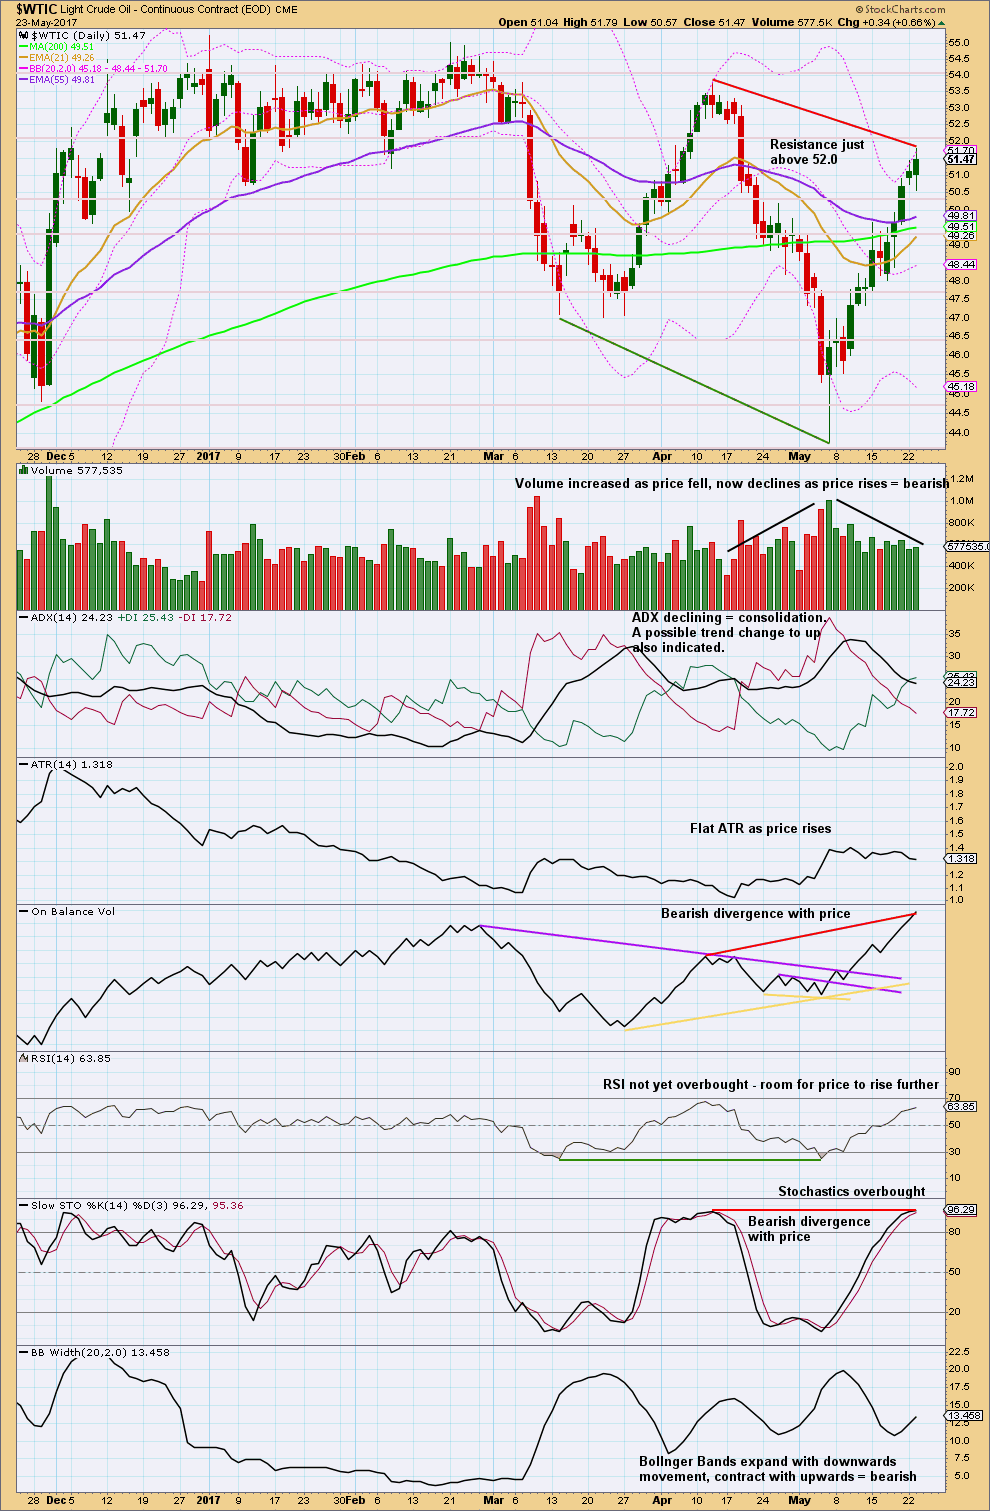
Click chart to enlarge. Chart courtesy of StockCharts.com.
This chart is overall more bearish this week, but price continues higher.
The bottom line should be to wait for a breach of the channel on the daily Elliott wave chart before having confidence that a high is in place.
ADX, ATR and mostly contracting Bollinger Bands still agree that this upwards bounce looks more like a counter trend movement than a new upwards trend.
Volume agrees. On Balance Volume showing bearish divergence also agrees.
RSI is not yet overbought and does not exhibit divergence with price. There is room for price to continue a little higher yet.
VOLATILITY INDEX
Click chart to enlarge. Chart courtesy of StockCharts.com.
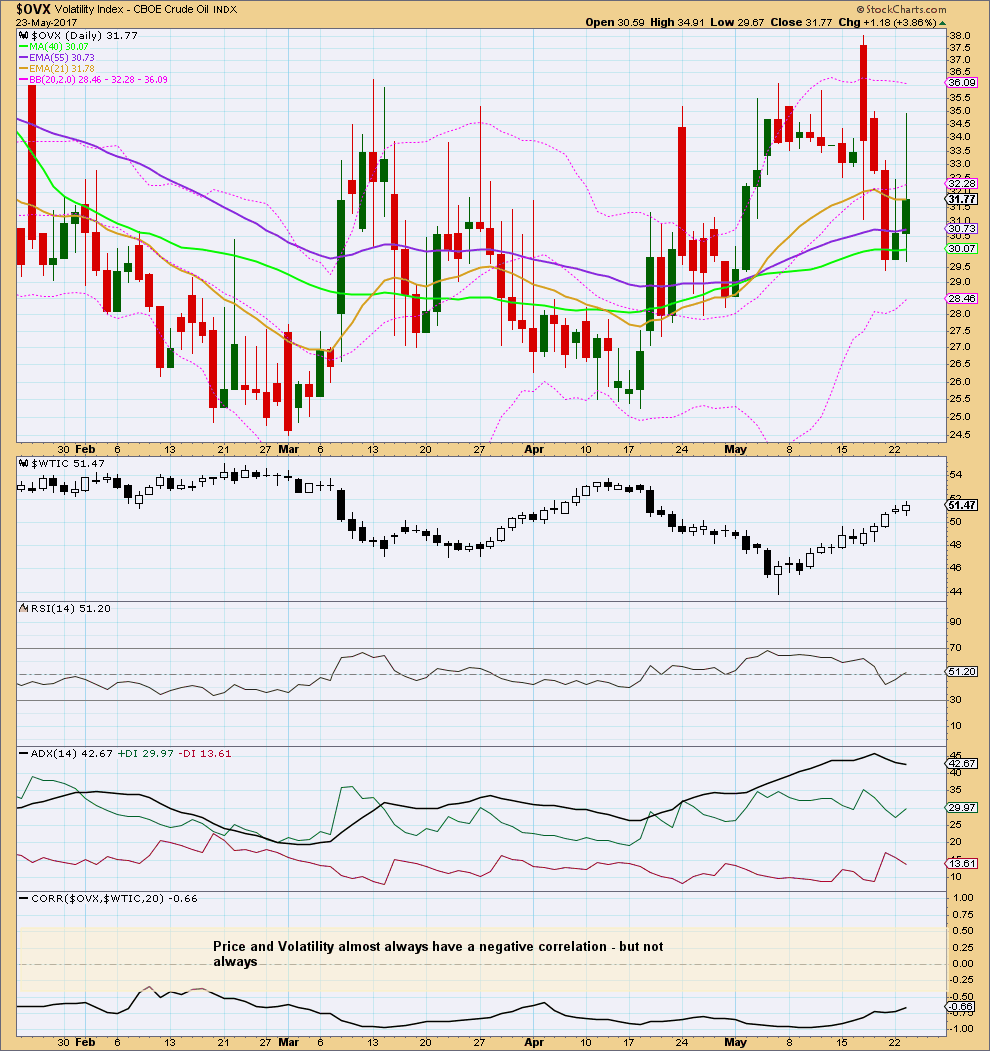
Normally, volatility should decline as price rises and volatility should increase as price falls. Divergence from this normal can provide a bullish or bearish signal for Oil. However, it is noted that this signal occurs both in minor and major lows and it cannot be used to distinguish between them.
Price has made new highs for the last two days, but volatility has increased and not declined. This is read as bearish divergence and suggests an end to the upwards trend from price here or very soon indeed.
This analysis is published @ 11:52 p.m. EST.
It is Tuesday… Looking forward to the update
Thanks Lara
Yep, being done now 🙂
Oil looking bullish again with that strong bounce back could just be a half cycle low. If it’s going to drop it needs to get a move on in my opinion
No Elliot wave but once we break the 20dma at around 48.3 things should accelerate to the downside
Anyone got a wave count on this? Are we in a final 5th of wave 1 of 3 or is it a 1,2,1,2 job?
Looking good Lara. Good job!!!
Thanks. My shorts are looking much better today 🙂
Time to look to add to my position…
Agree,
like to tgt the 46 area
Doesn’t look like a 5 down though?
Looking good so far the trend line has been pierced now we need to break it
If the EW count is right then we should get a buy the rumour sell the fact outcome from the OPEC meeting. If that doesn’t transpire then we need to ask if we’ve missed something here.
I am just about ready to reload my positions. Rather than the oil producers and explorers, I plan on taking a large position in a leveraged ETF, either DRIP or SCO. These things are volatile and so I am going to layer in until we get some momentum, and do it by selling puts at the price I am willing pay. USO put in a spinning top today so we could be at, or very close to a reversal point.
Thanks for the update I guess we will find out the true direction tomorrow after opec. I sure hope it’s down
Me too. My shorts aren’t looking very good today.