
Advice on how to manage short positions, specifically how to calculate a daily trailing stop, is given today for members to protect profits.
Summary: The target is at 28.61 minimum. Downwards movement may show a further increase in momentum. Some divergence today between price and volatility indicates possible weakness in price. Move stops daily to protect profit. Today, stops may be set just above the Elliott wave invalidation point at 49.75. Use the channel on the daily chart to move stops down each day.
New updates to this analysis are in bold.
MONTHLY ELLIOTT WAVE COUNT
Click chart to enlarge.
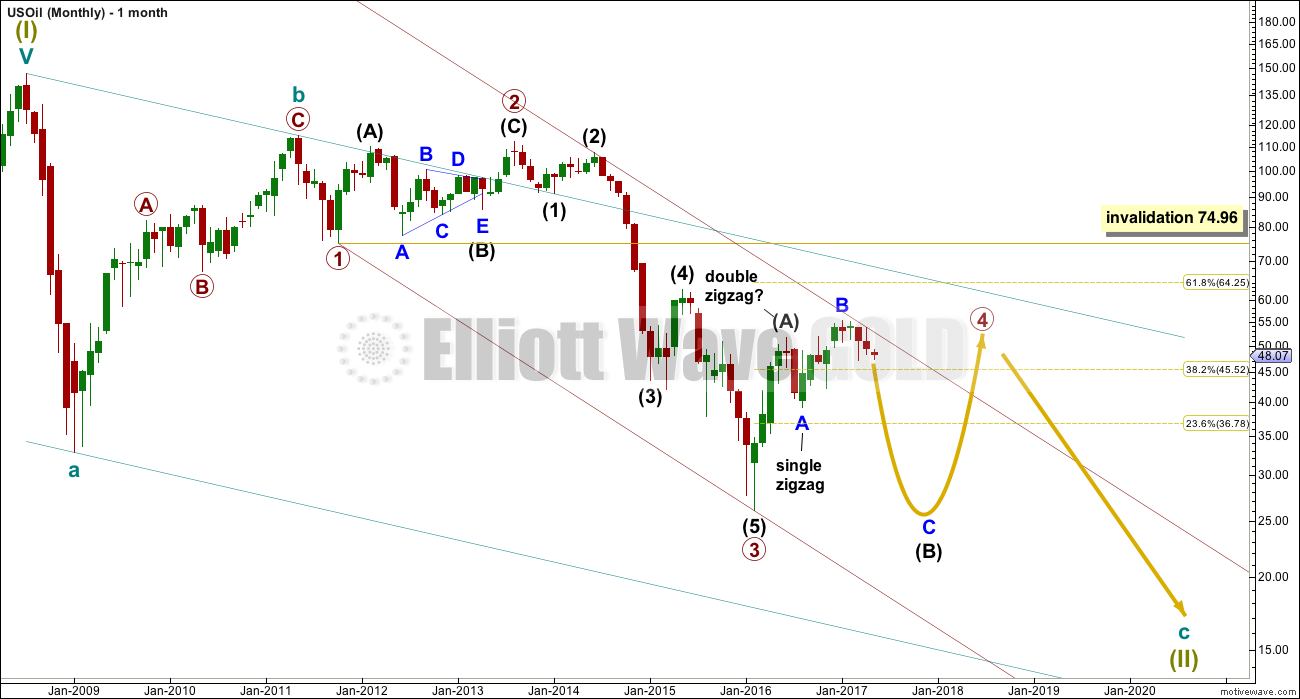
Within the bear market, cycle wave b is seen as ending in May 2011. Thereafter, a five wave structure downwards for cycle wave c begins.
Within cycle wave c, at this stage it does not look like primary wave 5 could be complete. That would only be possible if primary wave 4 was over too quickly.
Primary wave 1 is a short impulse lasting five months. Primary wave 2 is a very deep 0.94 zigzag lasting 22 months. Primary wave 3 is a complete impulse with no Fibonacci ratio to primary wave 1. It lasted 30 months.
Primary wave 4 is likely to exhibit alternation with primary wave 2. Primary wave 4 is most likely to be a flat, combination or triangle. Within all of these types of structures, the first movement subdivides as a three. The least likely structure for primary wave 4 is a zigzag.
Primary wave 4 is likely to end within the price territory of the fourth wave of one lesser degree; intermediate wave (4) has its range from 42.03 to 62.58.
If primary wave 4 is incomplete, then it looks like it may not remain contained within the channel. Sometimes fourth waves overshoot channels and this is why Elliott developed a second technique to redraw the channel when it does not contain a fourth wave.
Primary wave 4 is most likely to be shallow to exhibit alternation in depth with primary wave 2. So far it has passed the 0.382 Fibonacci ratio at 45.52. It may now continue to move mostly sideways in a large range.
Primary wave 4 may not move into primary wave 1 price territory above 74.96.
At this stage, primary wave 4 has completed intermediate wave (A) only. Intermediate wave (B) is incomplete.
WEEKLY ELLIOTT WAVE COUNT
Click chart to enlarge.
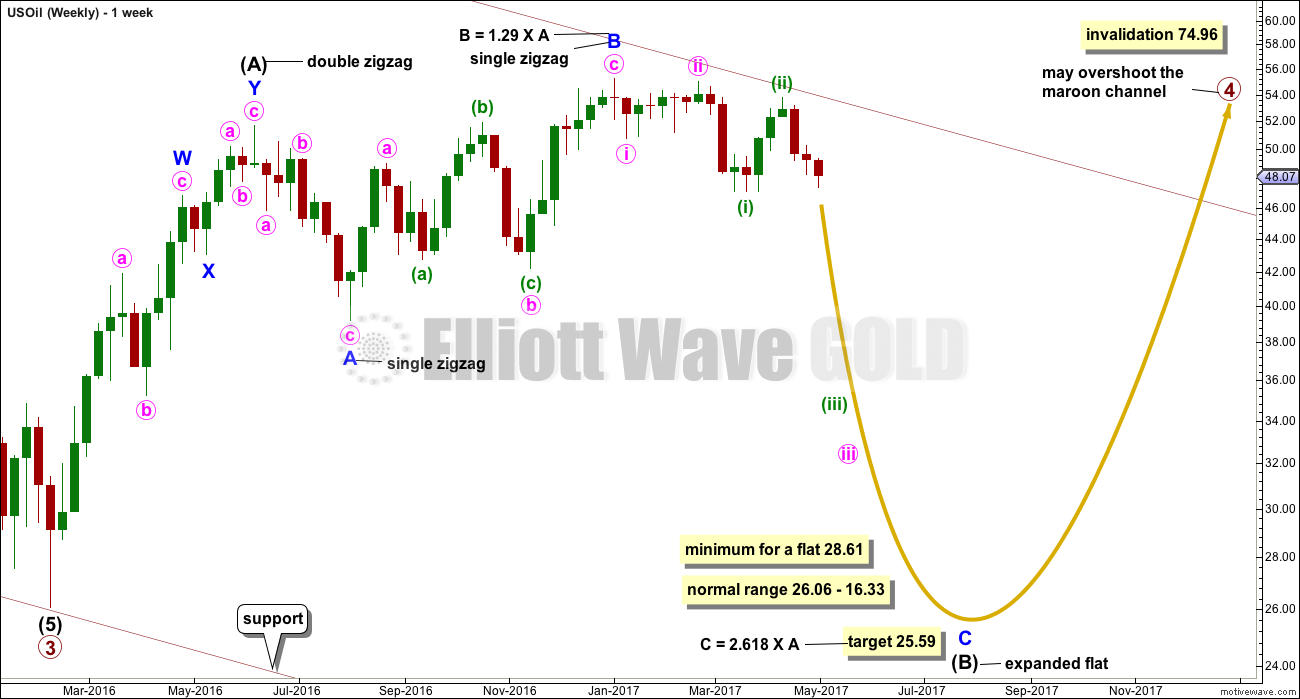
The whole structure of primary wave 4 is seen here in more detail.
The first wave labelled intermediate wave (A) is seen as a double zigzag, which is classified as a three.
Intermediate wave (B) is also a three. This means primary wave 4 is most likely unfolding as a flat correction if my analysis of intermediate wave (A) is correct. Flats are very common structures.
Intermediate wave (B) began with a zigzag downwards. This indicates it too is unfolding most likely as a flat correction.
Within intermediate wave (B), the zigzag upwards for minor wave B is a 1.29 correction of minor wave A. This indicates intermediate wave (B) may be unfolding as an expanded flat, the most common type.
The normal range for intermediate wave (B) within a flat correction for primary wave 4 is from 1 to 1.38 the length of intermediate wave (A) giving a range from 26.06 to 16.33.
Primary wave 4 may not move into primary wave 1 price territory above 74.96.
Within the larger expanded flat correction of primary wave 4, intermediate wave (B) must retrace a minimum 0.9 length of intermediate wave (A) at 28.61 or below.
DAILY ELLIOTT WAVE COUNT
Click chart to enlarge.
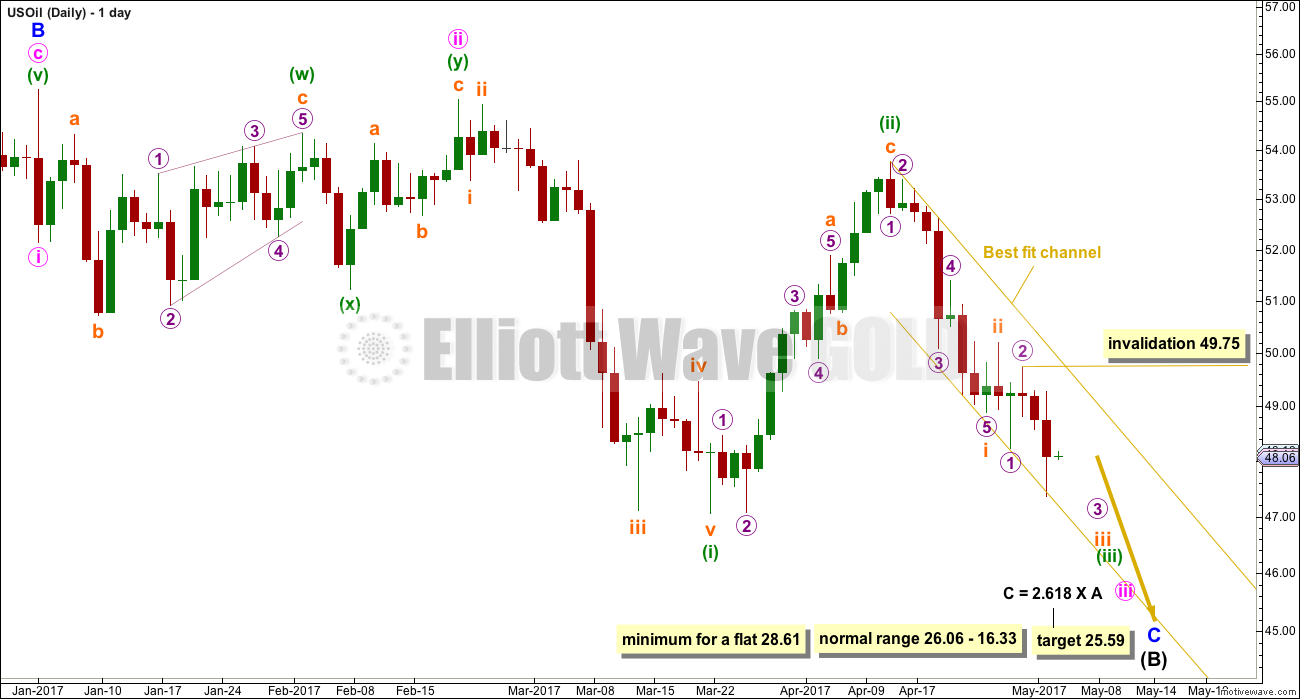
Minor wave C downwards must subdivide as a five wave structure.
Within minor wave C, minute waves i and ii should be complete and minute wave iii must be incomplete. Upwards movement, which is labelled minuette wave (ii), cannot be minute wave iv as it overlaps back into minute wave i price territory.
Within minute wave iii, minuette wave (i) is complete and minuette wave (ii) is complete.
Minuette wave (iii) must make a new low below the end of minuette wave (i) at 47.06. It must move far enough below that point to allow for subsequent upwards movement for minuette wave (iv) to unfold and remain below minuette wave (i) price territory.
Within minuette wave (iii), no second wave correction may move beyond the start of its first wave above 53.76.
At this stage, within minor wave C, corrections should be expected to be increasingly brief and shallow. They may last less than about two days now. There should now be a strong downwards pull from the middle of a third wave.
The best fit channel is adjusted this week. The upper edge is drawn from the high labelled minuette wave (ii) to sit across the highs of the next three daily candlesticks, and a parallel copy for the lower edge is placed on the low of micro wave 1, so that all this movement is contained. As the middle of a third wave passes price may break below the lower edge of this channel. If this channel is breached by upwards movement, then something else may be happening and long positions should be closed.
TECHNICAL ANALYSIS
DAILY CHART
Click chart to enlarge. Chart courtesy of StockCharts.com.
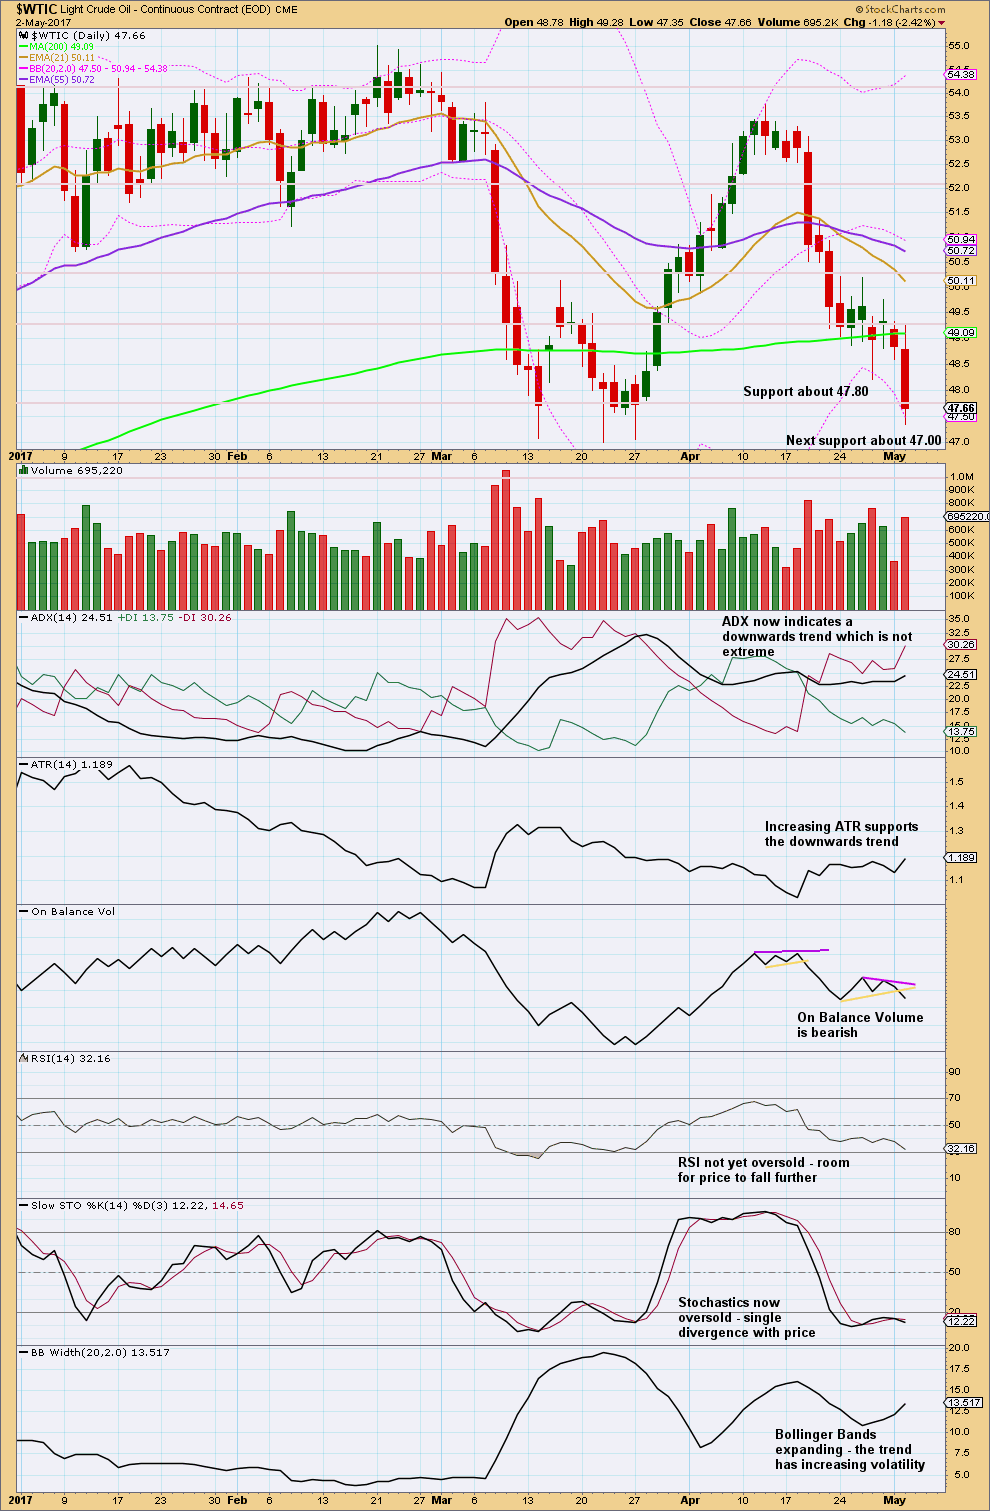
Stochastics may remain extreme for reasonably long periods of time during a strong trend. Single divergence while oversold is not a reversal signal.
This trend should be expected to continue, until it is proven that it is over.
This chart is very bearish.
VOLATILITY INDEX
Click chart to enlarge. Chart courtesy of StockCharts.com.
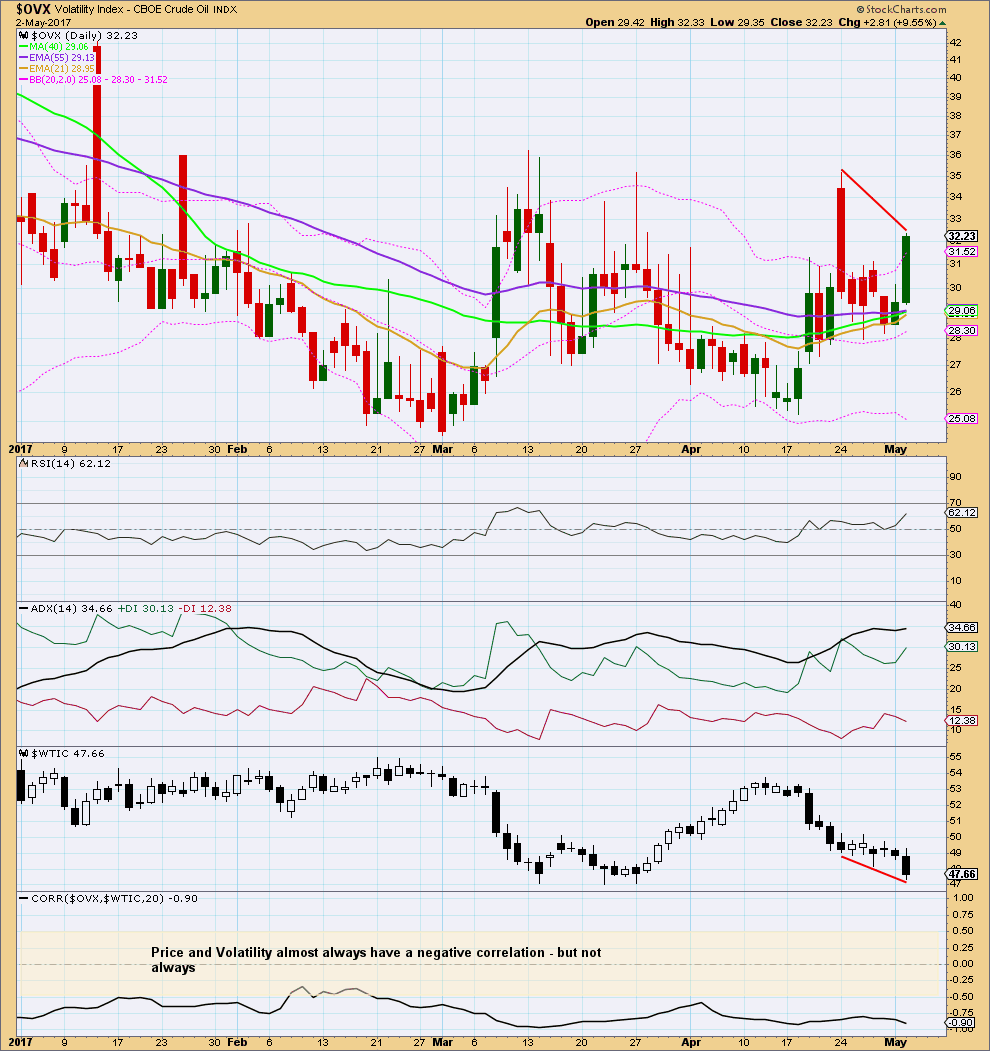
Normally, volatility should decline as price rises and volatility should increase as price falls. Divergence from this normal can provide a bullish or bearish signal for Oil.
There is short term divergence today between price and volatility: price has made a new low, but volatility has not shown a corresponding increase. This divergence is bullish; it indicates weakness in the downwards movement in price. This is not always followed by a reversal (it was seen three days ago on the 27th of April yet was followed by more downwards movement in price), but it is common at reversals.
This analysis is published @ 11:52 p.m. EST.
Updated TA:
When Oil trends strongly it can sustain oversold conditions for a long period of time. It tends to have relatively quick shallow corrections, lasting only a few days. To capture the meat of a trend you have to ride out the corrections.
RSI has had it’s first dip into oversold. This can continue for a long time. ADX is not yet extreme. There is plenty of room for this trend to continue yet.
The trend looks healthy
Updated daily chart:
Trends don’t move in straight lines. they have corrections along the way.
The long candlestick with a long lower wick = bullish. It has support from volume.
Now a small doji puts the trend to neutral. The correction may be over here or it may continue for another couple of days. It’s more likely to be brief.
Stops may be moved down to just above the invalidation point which is now lower than the upper edge of the channel. Give the market a bit of room to move and be patient with the trend. It has a long way to go.
Lara, we need your guidance, please!
I think for Oil a back test to resistance around 48.96 would be a good opportunity to go short again. What do you think?
https://www.tradingview.com/chart/USOIL/d6oSj8Eh-US-OIL-6-5-2017-and-some-related-issues/
If it does that, yes. A good opportunity.
I wouldn’t bet on it doing that though.
Pants on Fire in CL. Trimmed CL puts here at 44.20. Now only 20% left which I will let it ride and add more on any up move. Lara, an update would be appreciated on CL. Nice work again !!!! Thank you
Great call on oil Lara!
What is the projected target for green iii?
Thanks
I’m not giving one because minuette (iv) is expected to be too brief.
Lara given that we are in a 3rd of a 3rd decline, should we not be expecting a very ugly candle like the one on March 8th?
If so, wouldn’t this break through the current channel?
thanks
Yes. And yes.