
A slight new low followed by some sideways movement fits mostly with expectations for the hourly Elliott wave count.
Summary: A second wave bounce may end about 1,277. Thereafter, a third wave down may unfold for a few days. Always use a stop, which should be just above the last high at 1,295.65.
New updates to this analysis are in bold.
Last monthly charts and alternate weekly charts are here, video is here.
Grand SuperCycle analysis is here.
WEEKLY CHART I
Click chart to enlarge.
At this stage, all weekly charts published expect more upwards movement. Because there is no difference in the direction expected, only this one more likely weekly chart will be published on a daily basis.
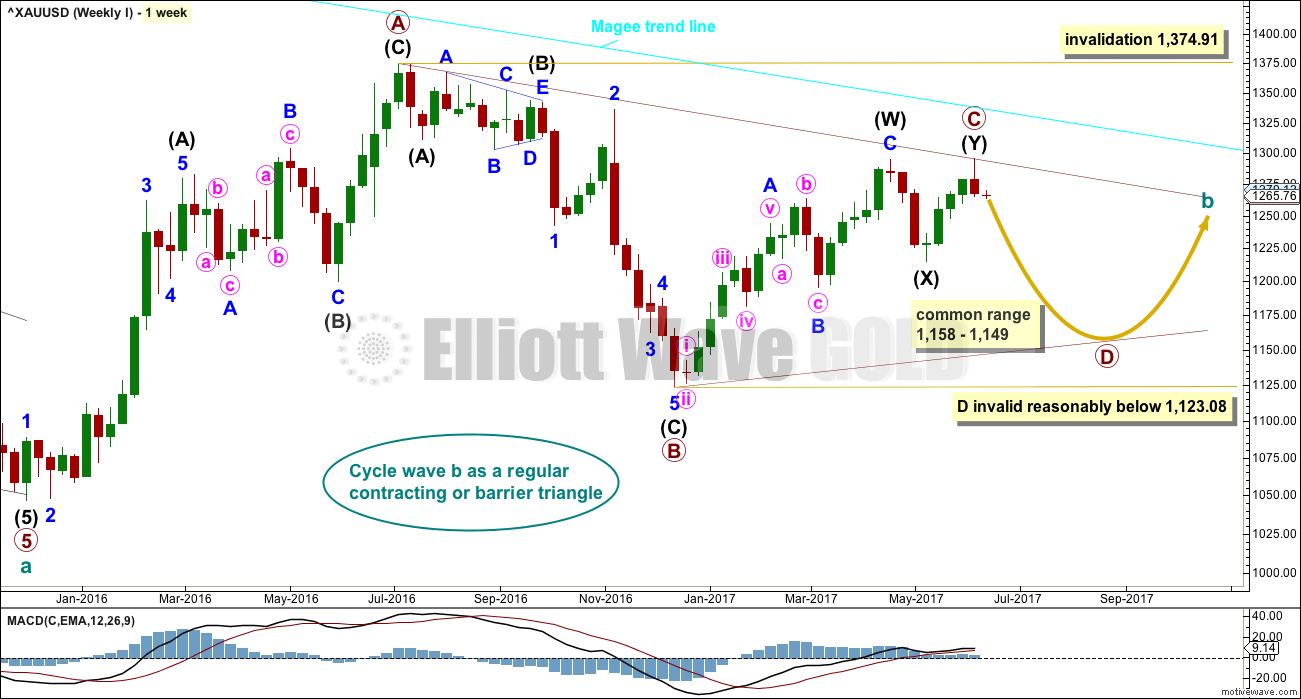
The Magee bear market trend line is added to the weekly charts. This cyan line is drawn from the all time high for Gold on the 6th of September, 2011, to the first major swing high within the following bear market on the 5th of October, 2012. This line should provide strong resistance.
At this stage, a triangle still looks most likely and has the best fit for cycle wave b.
Within a triangle, one sub-wave should be a more complicated multiple, which may be primary wave C. Primary wave C may not move beyond the end of primary wave A above 1,374.91. This invalidation point is black and white.
At this stage, it looks like primary wave C is now complete at the hourly and daily chart level. However, at the weekly chart level, it looks possible it may continue higher. This possibility must be acknowledged while price remains above 1,214.81. Within intermediate wave (Y), minor wave B may not move beyond the start of minor wave A.
Primary wave D of a contracting triangle may not move beyond the end of primary wave B below 1,123.08. Contracting triangles are the most common variety.
Primary wave D of a barrier triangle should end about the same level as primary wave B at 1,123.08, so that the B-D trend line remains essentially flat. This involves some subjectivity; price may move slightly below 1,123.08 and the triangle wave count may remain valid. This is the only Elliott wave rule which is not black and white.
Primary wave C may end when price comes up to touch the Magee trend line.
DAILY CHART
Click chart to enlarge.
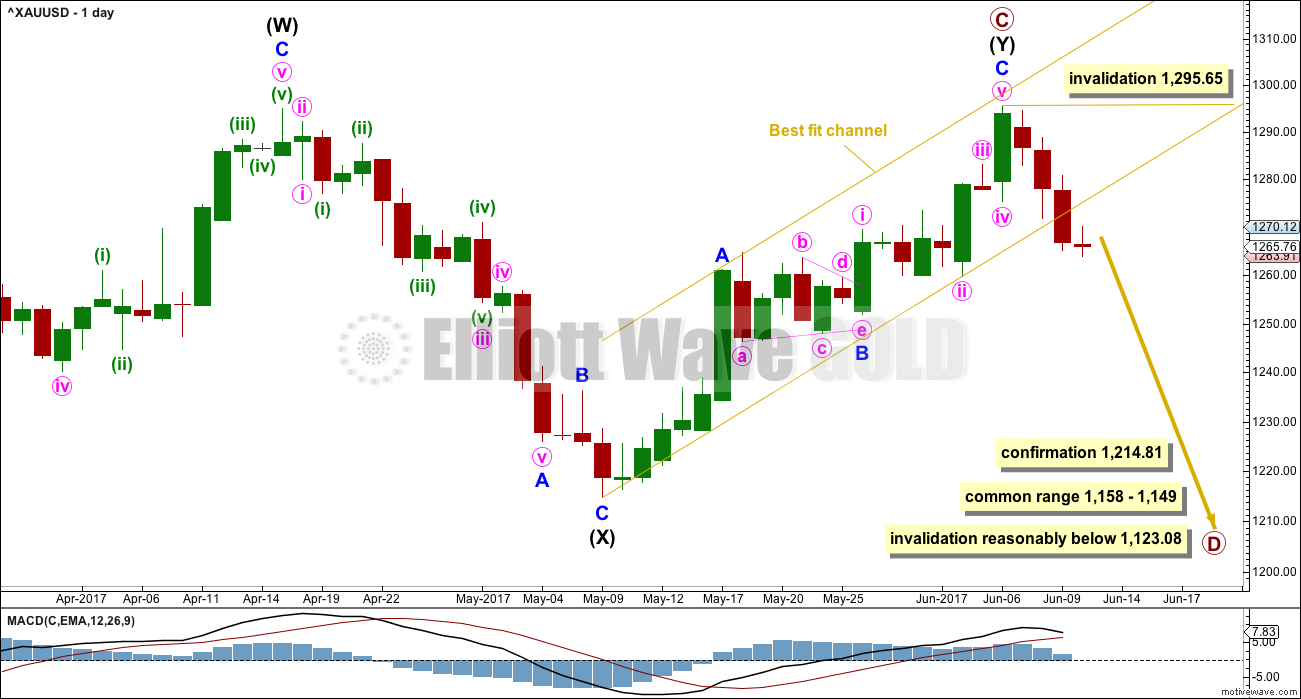
Intermediate wave (Y) may now be a complete zigzag if it is accepted that a triangle completed in the position labelled minor wave B. This has a perfect fit on the hourly chart. So that all subdivisions can be seen, a 2 hourly chart is provided this week.
The best fit channel about intermediate wave (Y) is now properly breached with a full daily candlestick below and not touching the lower trend line. This adds a little confidence that a high may be in place.
A new low below 1,214.81 could not be minor wave B within intermediate wave (Y) and would provide strong confirmation that intermediate wave (Y) is over. A new low below 1,214.81 would also invalidate all other weekly alternates published in last historic analysis (this is linked to above). This would provide final confirmation of this main wave count.
A common range for triangle sub-waves is from about 0.8 to 0.85 the prior sub-wave, this gives a range for primary wave D from 1,158 to 1,149.
If primary wave C is correctly labelled as a double zigzag, then primary wave D must be a simple A-B-C structure and would most likely be a zigzag. Within primary wave D, minor wave B may not move beyond the start of minor wave A above 1,295.64.
Primary wave A lasted 31 weeks, primary wave B lasted 23 weeks, and primary wave C may have been complete in 25 weeks.
Primary wave D should be expected to last at least 8 weeks (but most likely longer). The next Fibonacci ratio in the sequence would be a Fibonacci 13 and then 21.
HOURLY CHART
Click chart to enlarge.
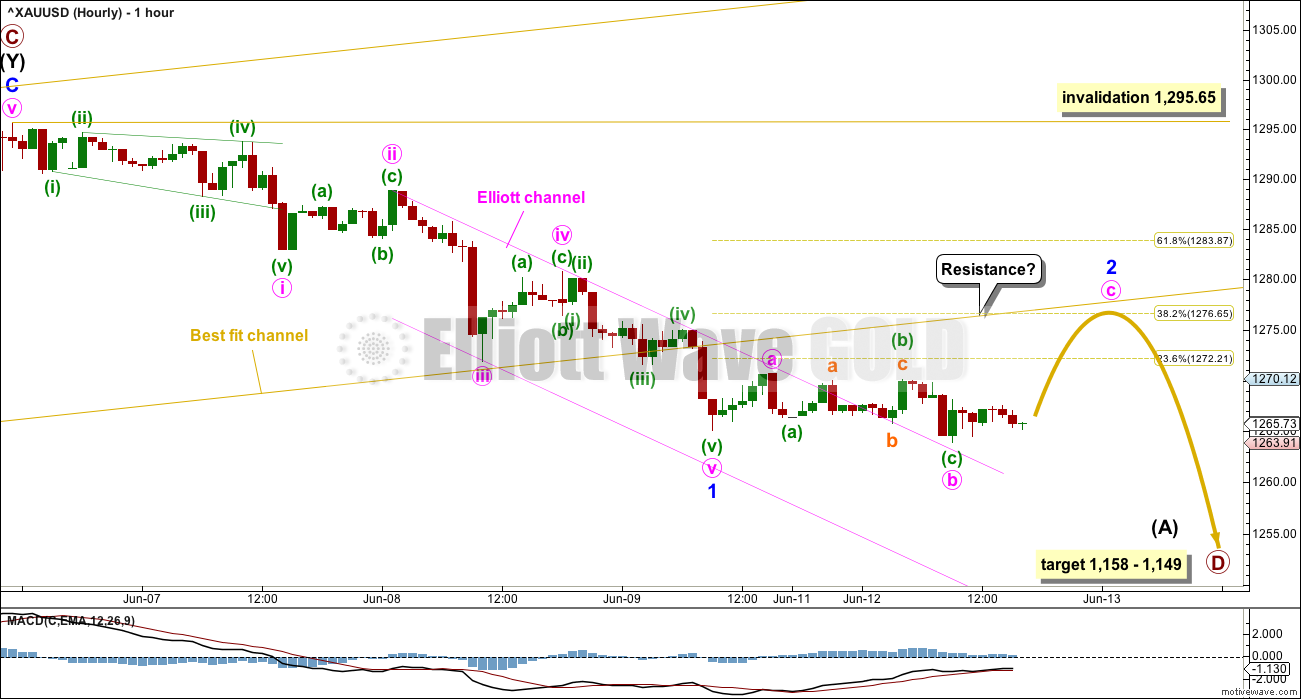
Minor wave 1 may now be over. Minor wave 2 may be underway as a regular flat correction.
If price finds resistance at the lower edge of the best fit channel, then minor wave 2 may end close to the 0.382 Fibonacci ratio at 1,276.65. If it is longer lasting, then it may end higher about the 0.618 Fibonacci ratio at 1,283.87.
When minor wave 2 is complete, then minor wave 3 should move lower and should exhibit an increase in downwards momentum.
Minor wave 2 must subdivide as a corrective structure. It may not move beyond the start of minor wave 1 above 1,295.65.
TECHNICAL ANALYSIS
WEEKLY CHART
Click chart to enlarge. Chart courtesy of StockCharts.com.
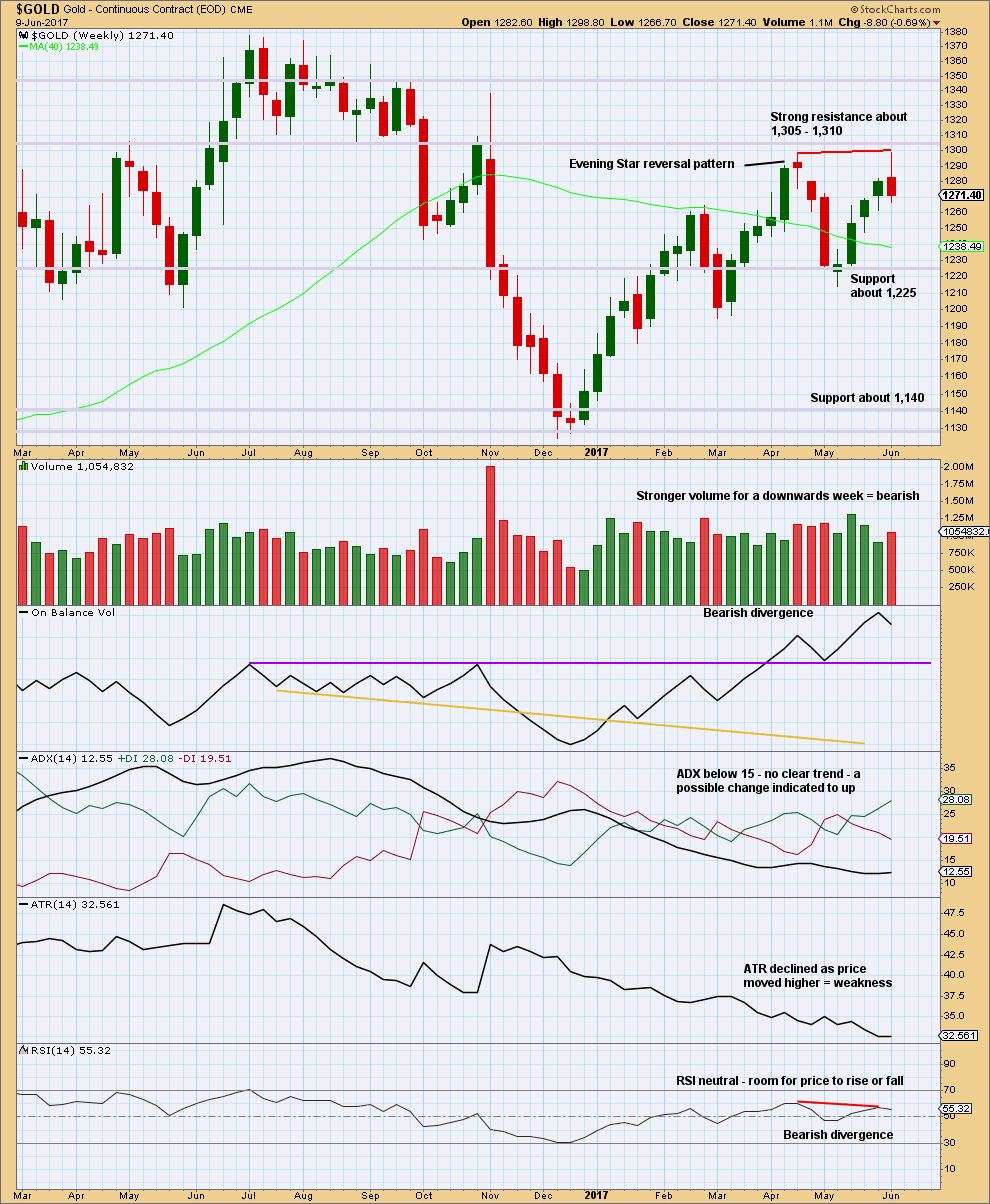
The long upper wick of this weekly candlestick is bearish. Volume is bearish. Divergence between price and RSI at this last high is bearish. ATR is bearish.
Price may have found resistance just below prior strong support at 1,305 to 1,310.
DAILY CHART
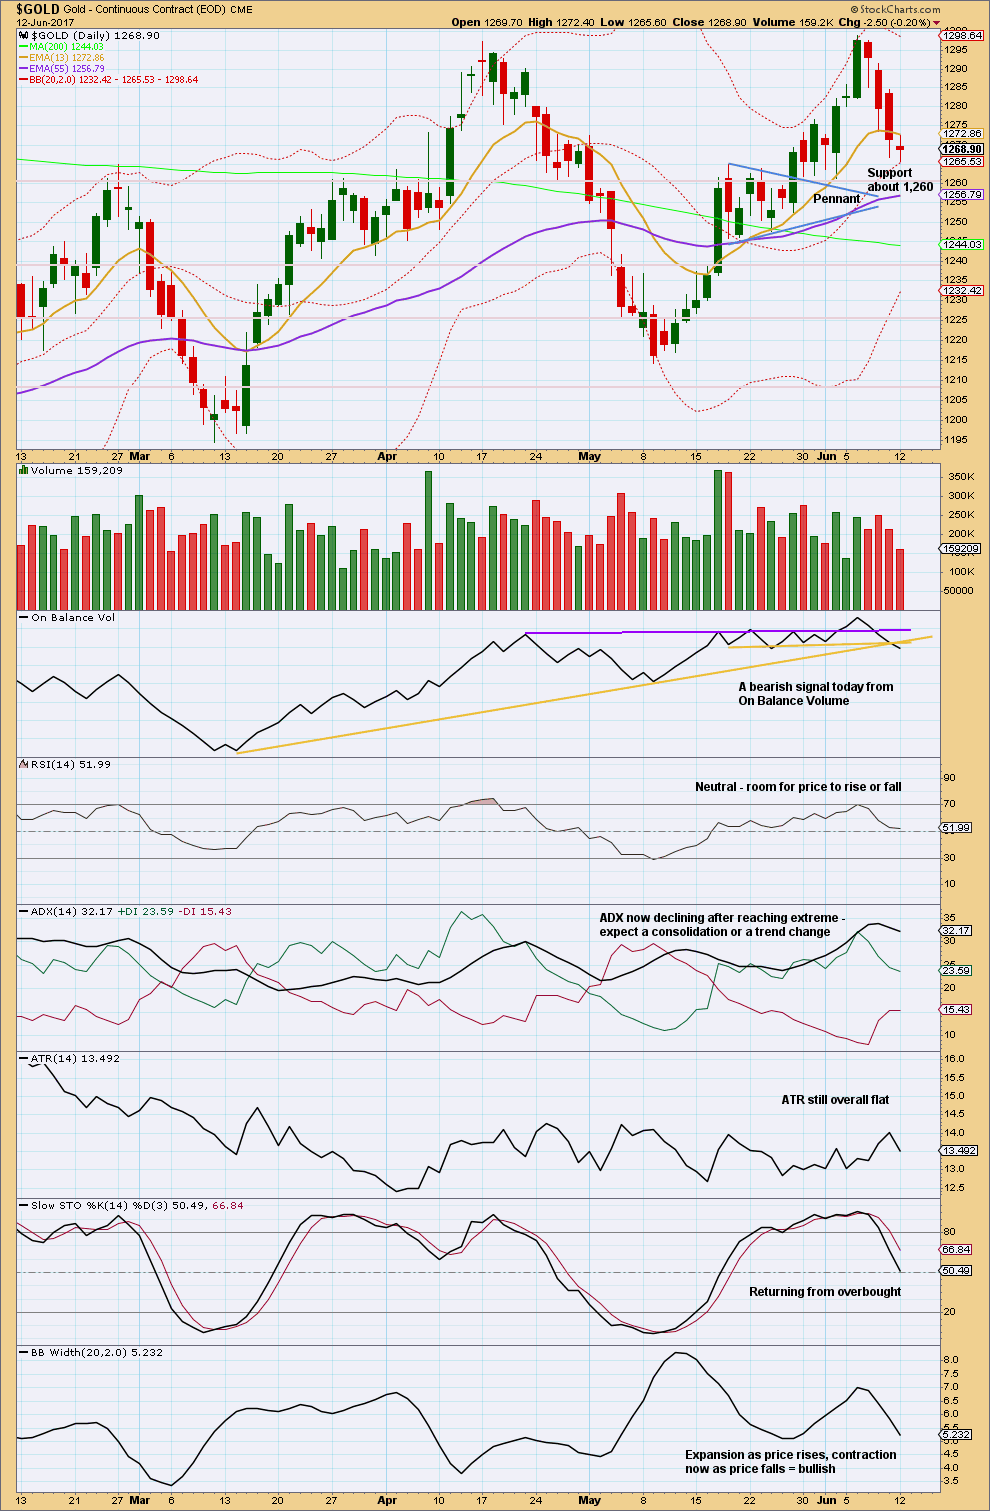
Click chart to enlarge. Chart courtesy of StockCharts.com.
Another downwards day on a further decline in volume looks like bears are tiring, at least temporarily. A doji candlestick shifts the short term trend from down to neutral. Look out for a bounce here.
On Balance Volume gives an important bearish signal today, which will be given reasonable weight in this analysis. It supports the Elliott wave count.
GDX
DAILY CHART

Click chart to enlarge. Chart courtesy of StockCharts.com.
The bearish signal from On Balance Volume should be given weight. The upside for GDX now may be very limited or over.
Declining volume as price moves lower is bullish, at least short term, so look for a bounce.
Declining ADX, declining ATR, and contracting Bollinger Bands indicate that price is still consolidating.
This analysis is published @ 07:19 p.m. EST.
This is what I have so far this morning. It looks like minor 1 has continued lower, coming to a slower end (the slope of the fifth wave is less steep than the third).
The Fibonacci retracement is adjusted. The 0.618 ratio may be reached by minor wave 2 if it lasts long enough.
I’ll still be expecting at least one green daily candlestick for a bounce, to see price test resistance at prior support. If it does that it will offer a perfect entry to go short. I’m waiting patiently for this setup.
If gold price has bottomed at 1261.65 just now, then Minute B = 1.618 * Minute A. In the expanded flat of Minor 2, it is likely that Minute C = 2.618 * Minute A at 1276.39. This ties in rather well with the daily tenkan-sen resistance at 1277.65. A quick scalp maybe?
Hi! I have a low of 1259.81 (Gold Price), 1259.75 (Bar Chart) & 1258.97 (Net Dania). Doubt if Gold price will rise past 1267/1269 in a hurry and may probably be worth playing for a confluence of 50% retrace H 1375/ L 1123 & H 1295 / L 1195 around 1248-46 whereabouts resides the 100dma and the lower band on the daily. Anyhow, will wait for Lara’s wave counts later and play the hand that’s dealt for Wednesday lol. GL to everyone. Have a fine day 🙂
Syed.
Lara’s count may need to be reworked. If 1265.05 has been Minor 1, then Minor 2 with 1265.05 – 1270.68 – 1259.75 – ? would have almost a 2.0 retrace, borderline for an expanded flat. I have an alternative count that sees 1265.05 as only Minute 3 of Minor 1, and 1259.75 ends Minor 1.
Also, I do have a bullish count based on Weekly II that sees a drop to either 1254 (near daily kijun-sen support) or 1245 (bottom cloud support) as the end of the correction. Thereafter, it would be a bullish rebound towards at least 1380. The confirmation point is 1295.65. Who knows, maybe the FOMC may trigger this scenario.
Too many possibilities!
Alan, agree too many possibilities. One has to be cautious. Thanks.
Ichimoku Gold 4-Hourly Analysis
Data as at 7:15 am ET June 13
===========================
The 4-hour Ichimoku Chart paints a more accurate picture of the gold prices as they unfold. Here, gold price has dropped below the cloud. The tenkan-sen had made a negative crossover with the kijun-sen last Thursday. These indicate a bear market in the 4-hour timeframe. The only saving grace is that the cloud remains green. This positive factor may be what is causing prices to consolidate now; prices are likely to form a bottom before rebounding in Minute C as Lara’s EW analysis portends. If so, then it is likely that Minute C would end at the daily tenkan-sen resistance at 1277.65 before again heading south in Minor 3. Prices should then not move higher than 1277.65 as the market is bearish in the short timeframe.
My expectation is that for today and tomorrow, investors will be dragging their feet awaiting the FOMC. The 25-basis point rate hike has already been priced into the market so traders are likely to only react to any clues as to the timing and magnitude of future interest rate increases. As these are virtually unknown, the market will be choppy going forward. I have no interest in trading this sort of market; the stress level is just too high, particularly when dealing with leveraged ETFs. My trigger points are the 1275 region for a bullish long, and the 1245 bottom cloud boundary for a bearish short.
Happy trading, folks. Good luck.
GDX analysis video that I just found. Very similar to my bull triangle idea. I like the “hoop” pattern he shows at the beginning.
https://www.youtube.com/watch?v=sAOpk1Xu5cE
Ichimoku Gold Daily Analysis
Data as at 6:45 am ET June 13
=========================
Gold markets lost ground in light trading on Monday, but did find a bit of support just below. Nothing much is happening in the commodity markets for now as the markets await the FOMC later in the week. It can be expected that gold prices would continue to consolidate in this price region leading up to the meeting.
The Daily Ichimoku Chart shows that the trend remains moderately healthy. Although prices traded sideways to downwards yesterday, gold is still in a bullish trend. The cloud remains green. The tenkan-sen is comfortably camped above the kijun-sen. However, gold price has dropped below the tenkan-sen, the first sign of the emergence of the bear. For now, prices are in a consolidation, trading between tenkan-sen resistance at 1277.65 and kijun-sen support at 1255.23. A break above 1277.65 will point to the likelihood of an uptrend reversal. A drop below 1255.23 will be cushioned by the top cloud boundary, followed by the bottom cloud boundary 1245.30. Any drop below that and we are in entrenched bear territory.
Lara, I’m definitely going to renew my subscription on Thursday. This site is really getting to be my one stop shop for gold trading information. I find myself waiting each evening in anticipation of another update from you about gold.
I realize that the trading room has ended. I really like trading natural gas though. Will you post another natural gas Elliott analysis, if you have time? Thanks so much, for all that you do for us.
That’s great to hear John 🙂
Here’s an updated daily NGas chart.
If price comes down again to touch the maroon trend line expect it to bounce up, that may be a nice entry for a mid term long position.
I’ve drawn that line from the low on February 2016, to the first major swing low of 22nd February 2017 on the chart.
That is nice. Lara’s excellent analysis I can not stay away from day to day. I learn every day new thing about EW rule and guidelines.
Thanks for the supporting the real unemotional reports telling like how she sees EW counts.
John. Glad that you are still with us. I’m just curious though. Do you trade UGAZ or UNG, or something else?
Thanks Alan, I trade UGAZ/DGAZ.
Thanks John.
Anyone watching the $VIX? May go lower yet, but something to watch…
https://www.tradingview.com/x/WnowPvnn/