
Downwards movement continues a little lower, which was not what was expected for Tuesday’s session.
Summary: A second wave bounce may end about 1,281. Thereafter, a third wave down may unfold for a few days. Always use a stop, which should be just above the last high at 1,295.65. Do not invest more than 1-5% of equity on any one trade.
New updates to this analysis are in bold.
Last monthly charts and alternate weekly charts are here, video is here.
Grand SuperCycle analysis is here.
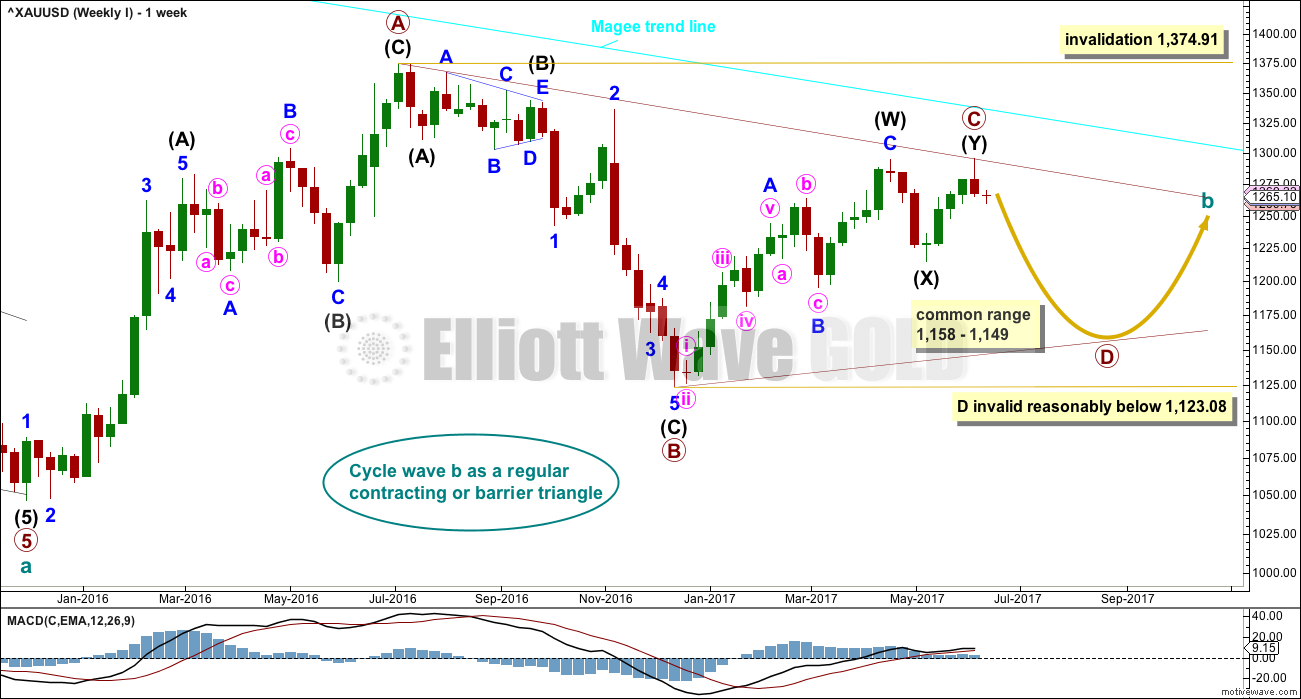
WEEKLY CHART I
Click chart to enlarge.
At this stage, all weekly charts published expect more upwards movement. Because there is no difference in the direction expected, only this one more likely weekly chart will be published on a daily basis.
The Magee bear market trend line is added to the weekly charts. This cyan line is drawn from the all time high for Gold on the 6th of September, 2011, to the first major swing high within the following bear market on the 5th of October, 2012. This line should provide strong resistance.
At this stage, a triangle still looks most likely and has the best fit for cycle wave b.
Within a triangle, one sub-wave should be a more complicated multiple, which may be primary wave C. Primary wave C may not move beyond the end of primary wave A above 1,374.91. This invalidation point is black and white.
At this stage, it looks like primary wave C is now complete at the hourly and daily chart level. However, at the weekly chart level, it looks possible it may continue higher. This possibility must be acknowledged while price remains above 1,214.81. Within intermediate wave (Y), minor wave B may not move beyond the start of minor wave A.
Primary wave D of a contracting triangle may not move beyond the end of primary wave B below 1,123.08. Contracting triangles are the most common variety.
Primary wave D of a barrier triangle should end about the same level as primary wave B at 1,123.08, so that the B-D trend line remains essentially flat. This involves some subjectivity; price may move slightly below 1,123.08 and the triangle wave count may remain valid. This is the only Elliott wave rule which is not black and white.
Primary wave C may end when price comes up to touch the Magee trend line.
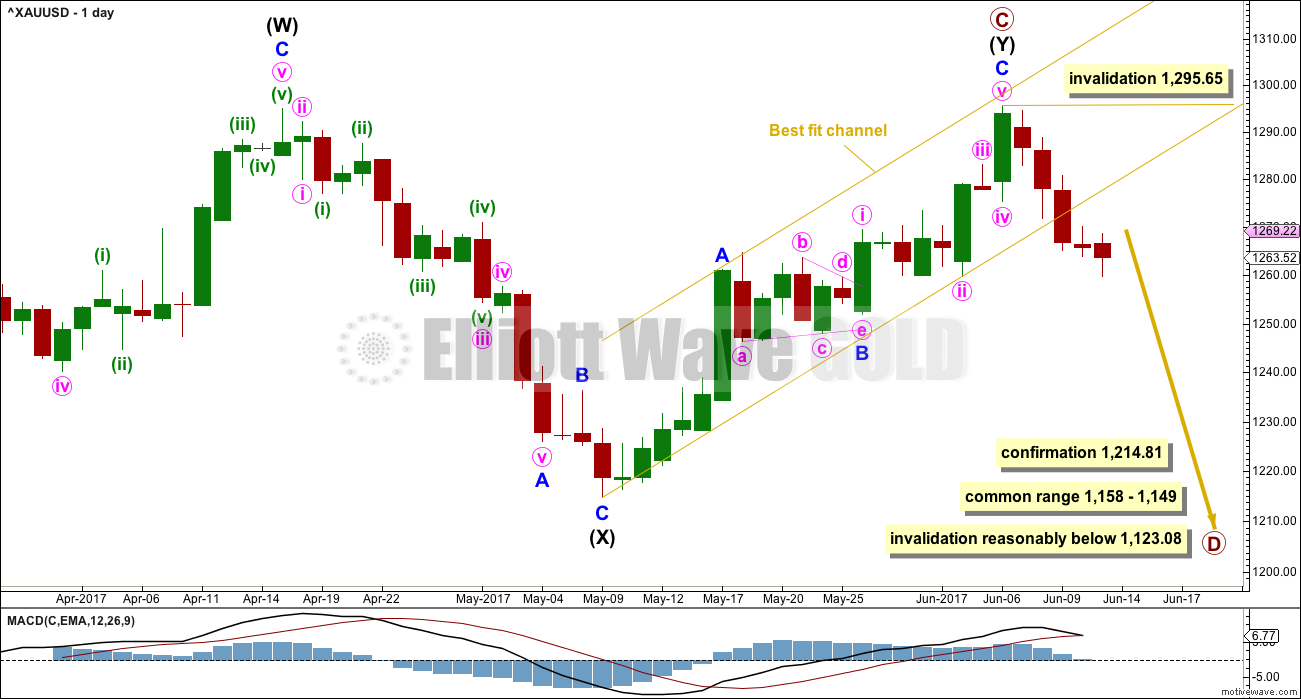
DAILY CHART
Click chart to enlarge.
Intermediate wave (Y) may now be a complete zigzag if it is accepted that a triangle completed in the position labelled minor wave B. This has a perfect fit on the hourly chart. So that all subdivisions can be seen, a 2 hourly chart is provided this week.
The best fit channel about intermediate wave (Y) is now properly breached with two full daily candlesticks below and not touching the lower trend line. This adds a little confidence that a high may be in place.
It is very typical price behaviour to curve back and retest support or resistance after breaking through. This does not always happen, but it happens often enough to be an excellent trade set up. If price now curves upwards, expect it is very likely to come up to touch or get very close to the lower edge of the best fit channel. If price does behave like that, then it would offer a good entry point to go short. Stops should be set just above the last swing high at 1,295.65.
A new low below 1,214.81 could not be minor wave B within intermediate wave (Y) and would provide strong confirmation that intermediate wave (Y) is over. A new low below 1,214.81 would also invalidate all other weekly alternates published in last historic analysis (this is linked to above). This would provide final confirmation of this main wave count.
A common range for triangle sub-waves is from about 0.8 to 0.85 the prior sub-wave, this gives a range for primary wave D from 1,158 to 1,149.
If primary wave C is correctly labelled as a double zigzag, then primary wave D must be a simple A-B-C structure and would most likely be a zigzag. Within primary wave D, minor wave B may not move beyond the start of minor wave A above 1,295.64.
Primary wave A lasted 31 weeks, primary wave B lasted 23 weeks, and primary wave C may have been complete in 25 weeks.
Primary wave D should be expected to last at least 8 weeks (but most likely longer). The next Fibonacci ratio in the sequence would be a Fibonacci 13 and then 21.
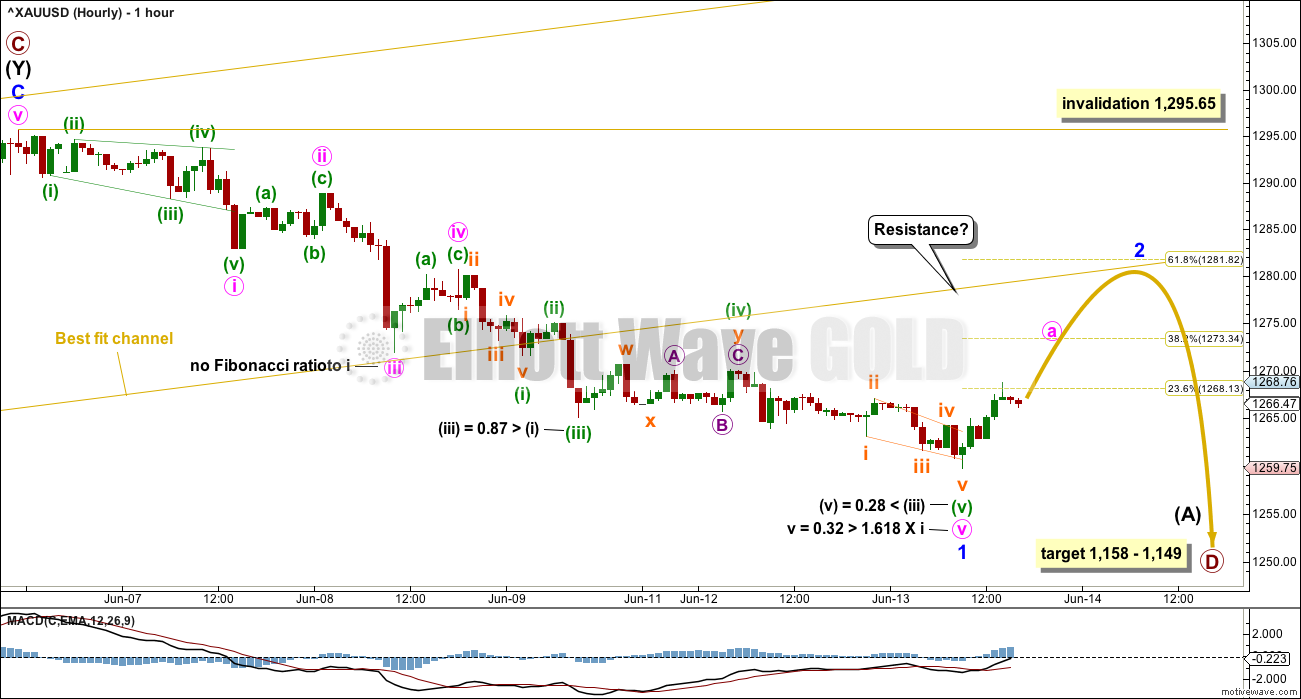
HOURLY CHART
Click chart to enlarge.
Minor wave 1 looks like it has moved slowly lower. There are now good Fibonacci ratios within minor wave 1.
Minor wave 2 may complete about the 0.618 Fibonacci ratio of minor wave 1 at 1,281.82. Minor wave 2 may be any one of more than 20 corrective structures. If it is an expanded flat (these are very common), then it may include a new low below its start at 1,259.75.
Minor wave 1 has lasted five days so far. Minor wave 2 should show up as at least one green daily candlestick or doji, and most likely last about three days, for the wave count to have the right look at the daily chart level. It may be choppy and overlapping.
Minor wave 2 may not move beyond the start of minor wave 1 above 1,295.65.
TECHNICAL ANALYSIS
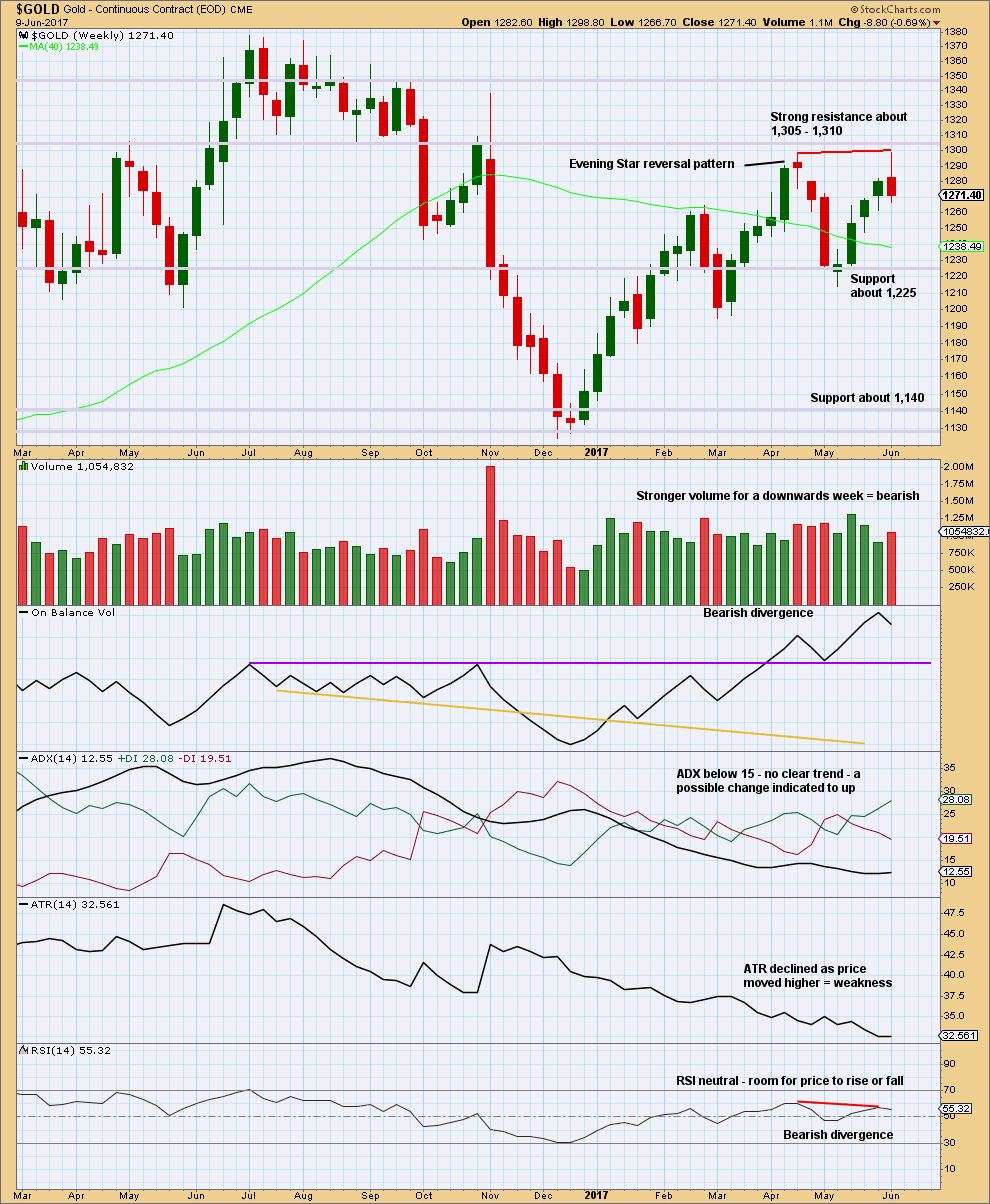
WEEKLY CHART
Click chart to enlarge. Chart courtesy of StockCharts.com.
The long upper wick of this weekly candlestick is bearish. Volume is bearish. Divergence between price and RSI at this last high is bearish. ATR is bearish.
Price may have found resistance just below prior strong support at 1,305 to 1,310.
DAILY CHART
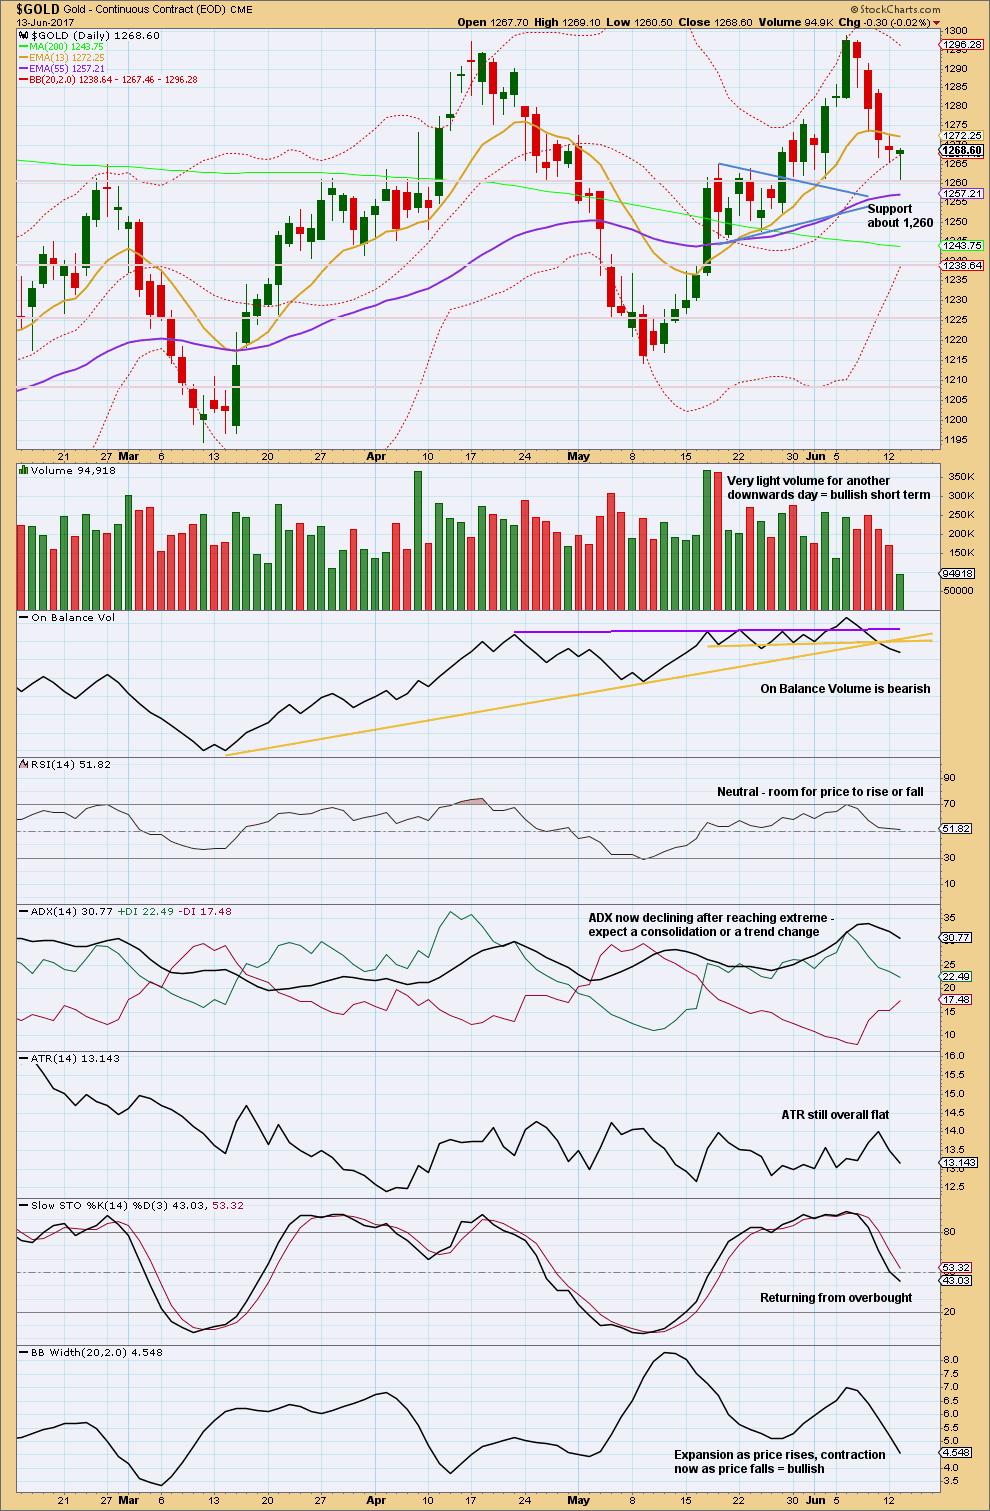
Click chart to enlarge. Chart courtesy of StockCharts.com.
Three days in a row of downwards movement with declining and now very light volume looks bullish. Expect a bounce here off support at 1,260. The long lower wicks of the last three daily candlesticks are bullish, and today’s candlestick completes a hammer reversal pattern.
With On Balance Volume looking very bearish, expect that any upwards movement here is likely a counter trend bounce.
GDX
DAILY CHART
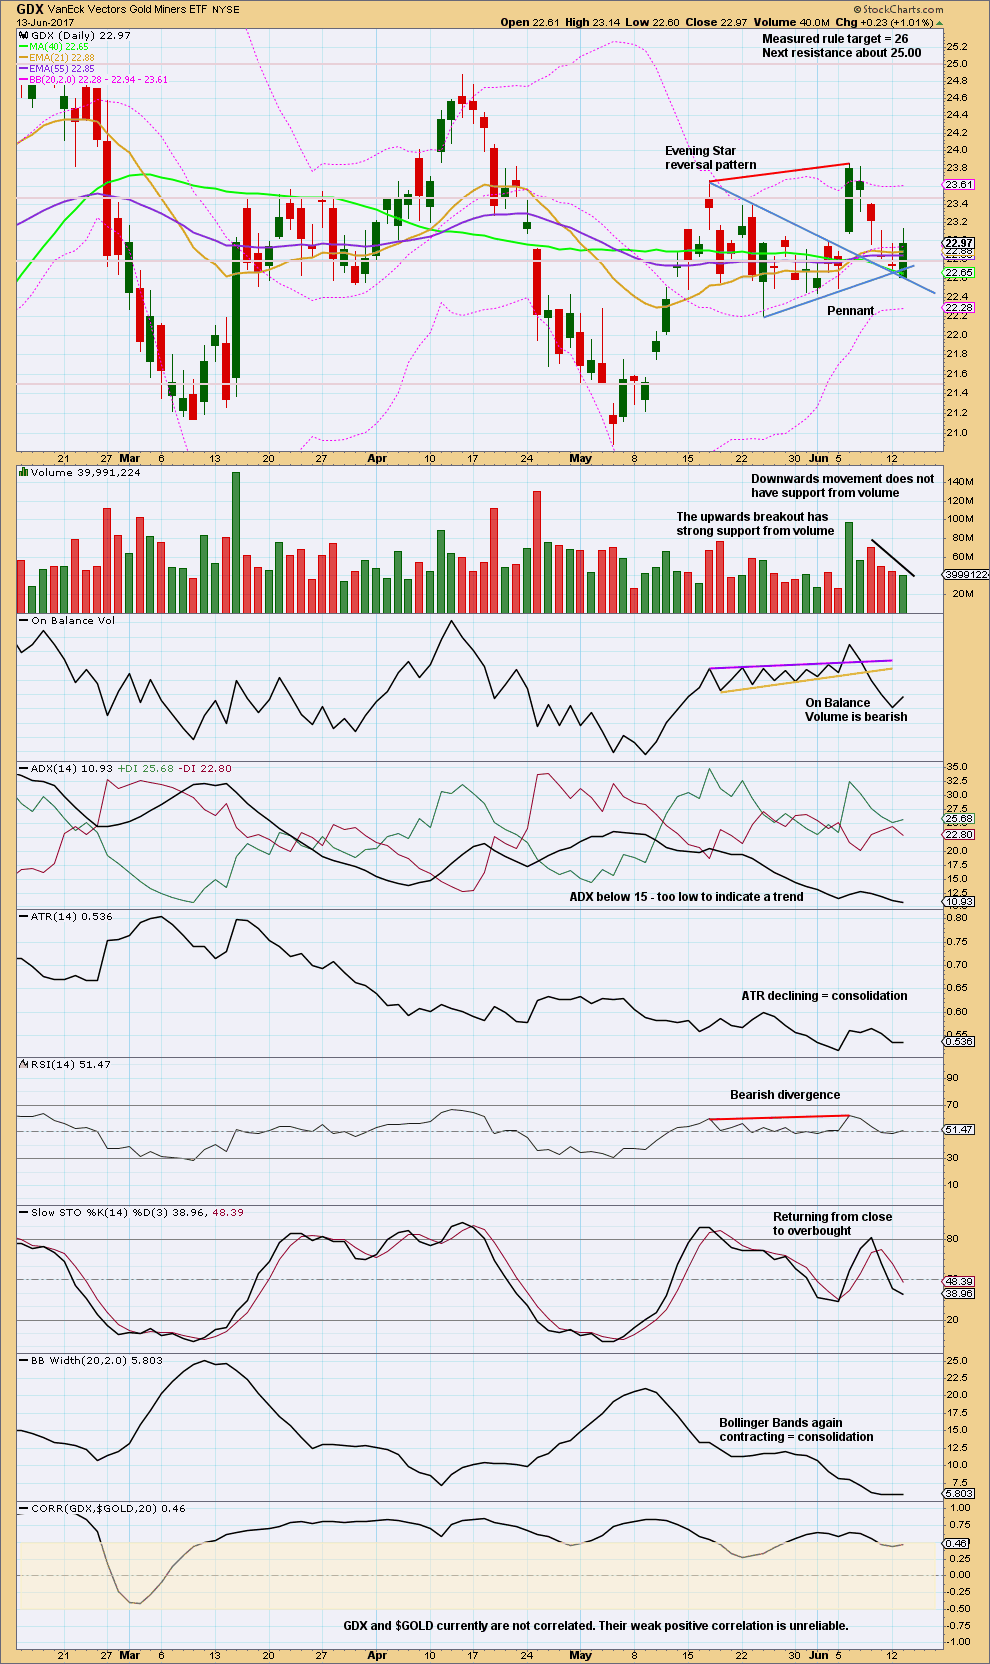
Click chart to enlarge. Chart courtesy of StockCharts.com.
The bearish signal from On Balance Volume should be given weight. The upside for GDX now may be very limited or over.
Declining volume as price moves lower is bullish, at least short term, so look for a bounce.
Declining ADX, declining ATR, and contracting Bollinger Bands indicate that price is still consolidating.
It looks like price has found support today at the upper trend line of the prior pennant.
This analysis is published @ 05:55 p.m. EST.
I published a chart for NZDUSD last on 26th of May in comments.
Here’s an update.
Following a leading diagonal in a first wave position, the second wave correction is usually very deep indeed. Minor 2 may end here or soon. A strong breach of the channel would be the earliest indication it may be over, that may be a reasonable entry to go short now.
Does anyone here trade this pair? Am I the only one?
I’m very interested in this pair Lara – much appreciated 🙂
I trade before, like
Awesome, thanks for the feedback folks.
I’ll keep a close eye on this pair and will post updated charts in comments when I see an entry opportunity.
I just love that set up, it’s my favourite. Breach of a trend line then back test. Which has worked beautifully today.
Price fell very slightly short, but it was close enough I hope to trigger you all to jump in short at todays high. It captured the order I had set to work while I slept so I’m a happy camper today.
Whew! I have to admit, I was sweating bullets on my short trades. The spike up this morning had me going “Uh Oh!”
I was fairly confident Yellen would pull the trigger and we would get a reversal. You can count on the FED to learn nothing from their past mistakes.
Beautiful call Lara. a.k.a “Golden Lady”. 🙂
🙂 Nice, we should all have profits in our accounts today
Great trade indeed. I only watch days like today on higher time frames to not get panic mode ON. So I could see the previous channel bottom and possible channel top. Great work again Lara!!
^ 4 hour chart btw.
Good point. Someone also pointed out that these FED induced spikes were generally short-lived. The fact that price spiked ahead of the actual rate increase was a great hint of a “buy the rumor, sell the news” scenario unfolding.
I hope everyone made or making $$$. Played out perfectly. Thanks to all the contributors to this site.
Yeah, I understand Elliott wave theory and exactly match 。Not on thinking. Is a theory how you apply to bet and play. To someone too.
Dreamer
? on Trading view.
How to remove the bottom panel (screener,Text notes.) below the int chart which lists stocks?
Finely I got it. No need to respond.
Long bonds have been basing for quite some time and have broken out in the last couple weeks. The tech sector led the way most of this year and got taken to the wood shed as of late. Oil charts stink and the dollar chart stinks. Inflation and retail sales are not good. I just don’t see gold dropping forty to sixty bucks any time soon just because it satisfies some count someone THINK fits. Gold is going higher. Markets have a tremendous amount of longer term negative divergence and we are entering a typically difficult period of the year. Defensives also have done really really well. Look at the utilities. I just think everything is pointing to a summer sell off with money flowing into defensives (some of it being gold).
Ivne.
To be fair to Lara and other Ellioticians, wave counts have a sound mathematical basis, and are not just a random fit-the-data “think”. The only thinking employed is to consider the most probable future event based on historical data. It is just like playing blackjack in a casino. Say, you are holding 15, and seeing all the cards of the other players, whether you want to hold or to risk picking another card is an exercise in probability. Sometimes you win, sometimes you lose. But, it is based on sound judgment on your part, I hope, and not just some whimsical “think”.
Ivne, no thanks.
I “THINK” that I’ll look at a good
gold chart and analysis instead.
So interesting. I never cease to be surprised every time I hear someone argue the “fundamentals” case against EW theory. One would expect to encounter it less frequently (particularly here) in view of the volumes that have been written to show it an unreliable argument.
I’ve seen this before. New people come into this membership and make a statement that Elliott wave doesn’t work, or can’t work. It does not usually end well for them, or me.
Why are you here Ivne? This is an Elliott wave technical analysis site.
*Edit to add: I see you’re not a new member, you’ve been here a while. I’m really stumped as to why you appear to have no confidence in Elliott wave but you’re a member for some months? It makes no sense to me.
Lara’s target of 1281 hit and then Gold falls 24 dollars so far, I also wish Lara could be a little more accurate! lol
Yeah that was a pretty legit call. Kudos!
Yes Siree! Next time we will insist that she calls it to the penny! He! He!
TLT looks toppy to moi! 🙂
Alan,
Howdy?
Looks like Minor 2 is over at 9:06 AM, we head lower now after a nice $20+ move in a perfect ZZ?
Hi sandy. I couldn’t reply earlier as the website was unavailable for a while.
It looks like the high of 1279.06 is only wave 3 of Minute C. There should be a drop followed by one more high. Prices appear to head for the 0.618 retrace of Minor 1 as Lara suggested. The target of 1281-1282 is still below the 4-hour top cloud boundary of around 1283, and so there is no bullish breakout. If prices break out and stay above 1283, then the bulls will become encouraged. Otherwise, the rejection would instigate a drop towards 1224 for Minor 3 (1.618 Fib), or 1245 for the bullish count. That would be the interesting action to watch today, especially after the Fed announcement. For now, I’m staying put.
Thanks, agree its been sideways coiling in a (iv) of C for a final high
Interesting perspective. Diamond bottoms anyone?
From a Stocktwits post
Ichimoku Gold 4-Hourly Analysis
Data as at 4:05 am ET June 14
===========================
The 4-hour Ichimoku Chart is not much changed from yesterday. Gold price remains below the cloud. The tenkan-sen had made a negative crossover with the kijun-sen last Thursday. Both of these allude to a bear market in the 4-hour timeframe. The only saving grace is that the cloud remains green. This urged prices to rebound off 1259.75 yesterday. Incidentally, the 50 day SMA was at 1261.23, and a rebound signified that the market was not ready to fall flat yet. Prices are consolidating at the moment, attempting to rise above the 4-hour kijun-sen resistance at 1273.93, and if successful, the bottom cloud boundary at 1277.44. I believe that the 4-hour timeframe bearishness wouldn’t produce sufficient momentum to launch prices above these, and so the 1274-1278 area should prove to be a formidable barrier to upwards price movement for Minor 2. Rejection will send gold heading south, with initial support at 1256.60, the daily top cloud boundary, followed by the daily bottom cloud boundary at 1245.30. However, in the more unlikely event that gold prices surge past the 4-hour top cloud boundary around 1283 (it is constantly changing, so I can’t place an exact figure here), followed by taking out the previous high at 1295.65, then a bullish onslaught would ensue. This would be the bullish scenario that I have been envisaging all along. We shall see if the FOMC can be the springboard for this possibility.
In conclusion, I will sit out the market until the FOMC announcement. As prices could go either direction, insanely higher or violently lower, I am not going to risk my neck on such a high risk-to-profit ratio. My trigger points are the 1275-1278 region for a bullish long, and the 1245 bottom cloud boundary for a bearish short.
Happy trading, folks. Tomorrow’s updates will be slightly late as I have a routine medical appointment to attend to.
GDXJ to Gold breakout is encouraging. Need to see OBV breakout also.
Here’s a look at Gold and GDX price action for the previous Fed increases. The takeaway seems to be that with each increase, the move up has become weaker. Also note that sometimes the move after a rate increase is reversed within days.
I think for a bull breakout to occur in the next few days, the forward looking statements will be most important as Alan has also noted. A dovish look for future rate increases could embolden the bulls.
Best case for the bulls is likely a move down for up to a few days, then a strong reversal up. A move below 1,230ish will embolden the bears.
https://www.tradingview.com/x/petVPm26/
Ichimoku Gold Daily Analysis
Data as at 3:30 am ET June 14
=========================
Gold prices rebounded off the lows at the 1260 level on Tuesday, ahead of the Fed meeting. The 1260 level is an area where we have seen a lot of action in the past. I think the gold markets are trying to set themselves up for what is coming later today, the results of the FOMC meeting. The Fed is widely expected to hike interest rates by 0.25% and this has been factored into the markets. Investors are likely to pay a lot of attention to the accompanying statement, which gives some information where we could be going forward, particularly the number of rate hikes this year as well as an idea of how the Fed is going to reduce its balance sheet. To me, this sentiment makes it dangerous to get involved in the market until the statement comes out later in the day.
The daily picture is not much changed from yesterday. The Ichimoku Chart shows that the trend remains moderately healthy. Although prices largely fell yesterday, gold is still in a bullish trend. The cloud remains green. The tenkan-sen remains comfortably camped above the kijun-sen. However, gold price has dropped below the tenkan-sen. For now, prices have rebounded, and is now trading between tenkan-sen resistance at 1277.50 and kijun-sen support at 1256.60. I am of the opinion that the Minor 2 rebound will not reach above 1277.50. A break above that point will increase the likelihood of the resumption of the strong bullish trend. Many investors are probably camped there, waiting to load up. A drop below 1256.60 will be cushioned by the top cloud boundary, followed by the bottom cloud boundary 1245.30. Any drop below that and we are in entrenched bear territory.
Lara, was looking at this scenario with a Barrier triangle. Seems like .60 cents is essentially flat for the B – D trendline, no?
I get a little concerned when you are down to one count. This would give us a bullish option. The A – C trendline would come in play for point E of the triangle, around 1,230ish more or less. This could at least be something to keep an eye on. Thoughts?
https://www.tradingview.com/x/OrYrF0nQ/
Dreamer. You and I have essentially a bullish count based on a double zigzag for Cycle B. Mine differs from yours somewhat in that I don’t see the Intermediate B movement as a triangle. I see a Primary C with two overlapping 1st and 2nd waves. On second look, your idea may be a closer approximation to what is actually happening. In the scenario which I have been alluding in my daily posts, I have the target as 1380 (Cycle B = 0.382 * Cycle A) or 1451 (Primary Y = Primary W).
Yep. I struggle with the 1-2, 1-2 because of the channel breach, but as you said, the targets are similar. We’ll have to see how the pattern plays out.
There are three bullish counts, I’m just not publishing them on a daily basis.
I’ve charted your idea and yes, it looks mostly okay. I would be very slightly concerned that the B-D trend line appears to have a slight slope, but it does still look essentially flat so I think the count is viable. I don’t think it has a very good probability though.
Thanks for taking a look 🙂