
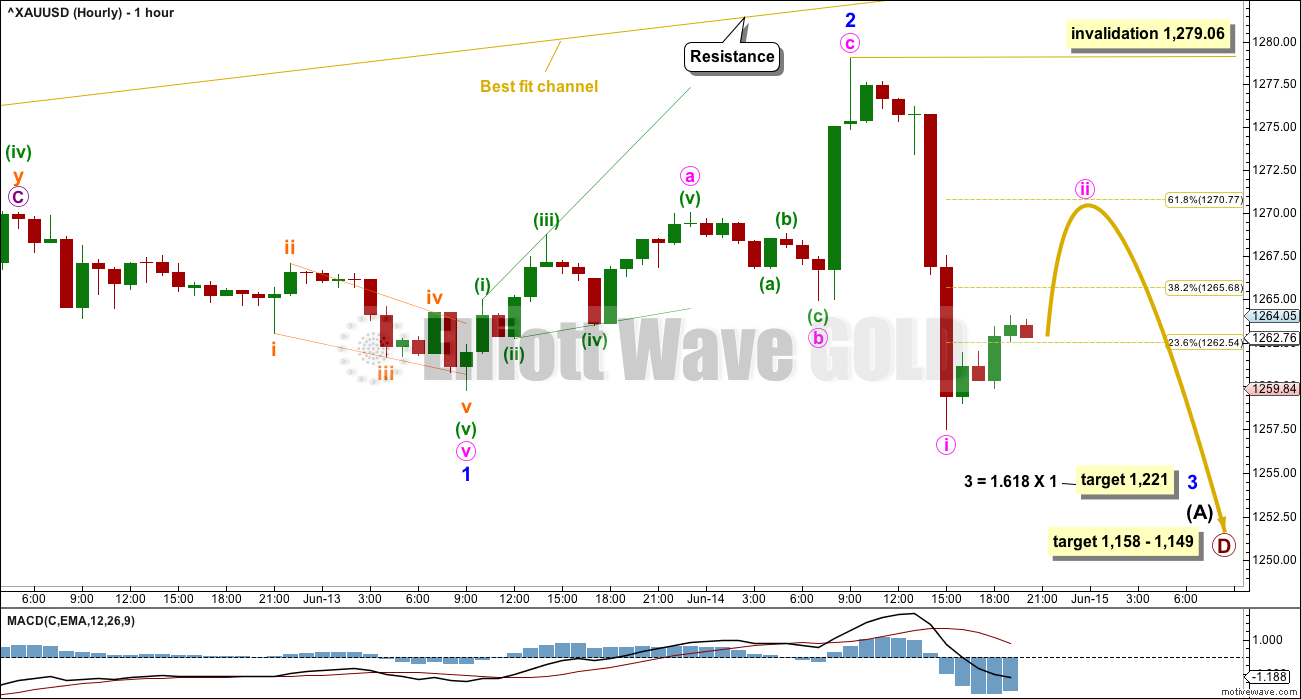
A bounce was expected to end about 1,281. The high for Wednesday’s session fell just 1.94 short of this target to reach 1,279.06. Strong downwards movement was expected following the bounce.
Summary: A small third wave down may be beginning. Stops for short positions may be set just above today’s high or at breakeven if the entry point was close to the high. The target range is 1,158 to 1,149, but this may be too low for profits. There should be a B wave bounce along the way down.
Always use a stop. Invest only 1-5% of equity on any one trade.
New updates to this analysis are in bold.
Last monthly charts and alternate weekly charts are here, video is here.
Grand SuperCycle analysis is here.
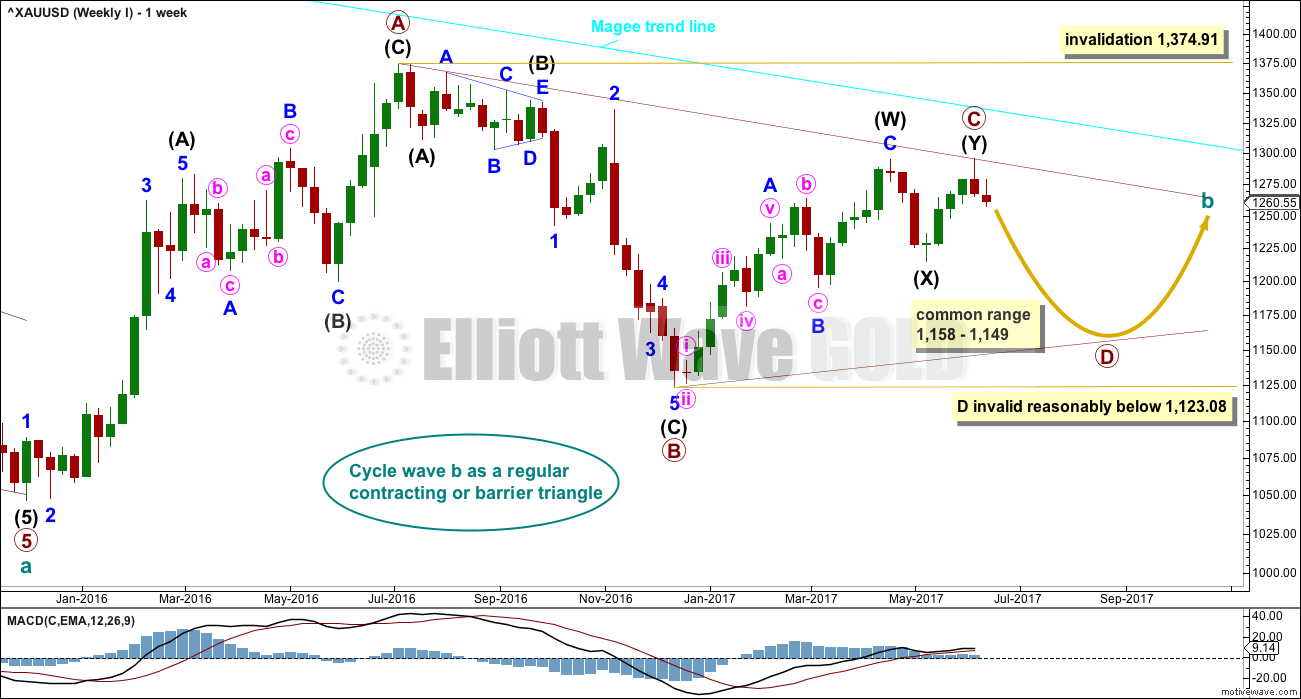
WEEKLY CHART I
Click chart to enlarge.
The Magee bear market trend line is added to the weekly charts. This cyan line is drawn from the all time high for Gold on the 6th of September, 2011, to the first major swing high within the following bear market on the 5th of October, 2012. This line should provide strong resistance.
At this stage, a triangle still looks most likely and has the best fit for cycle wave b.
Within a triangle, one sub-wave should be a more complicated multiple, which may be primary wave C. Primary wave C may not move beyond the end of primary wave A above 1,374.91. This invalidation point is black and white.
At this stage, it looks like primary wave C is now complete at the hourly and daily chart level. However, at the weekly chart level, it looks possible it may continue higher. This possibility must be acknowledged while price remains above 1,214.81. Within intermediate wave (Y), minor wave B may not move beyond the start of minor wave A.
Primary wave D of a contracting triangle may not move beyond the end of primary wave B below 1,123.08. Contracting triangles are the most common variety.
Primary wave D of a barrier triangle should end about the same level as primary wave B at 1,123.08, so that the B-D trend line remains essentially flat. This involves some subjectivity; price may move slightly below 1,123.08 and the triangle wave count may remain valid. This is the only Elliott wave rule which is not black and white.
Primary wave C may end when price comes up to touch the Magee trend line.
There are three alternate wave counts that have been published in the last historic analysis, which is linked to above. They are all very bullish. Members may like to review them at this stage. They will only be published on a daily basis if price shows them to be true with a new high now above 1,295.65.
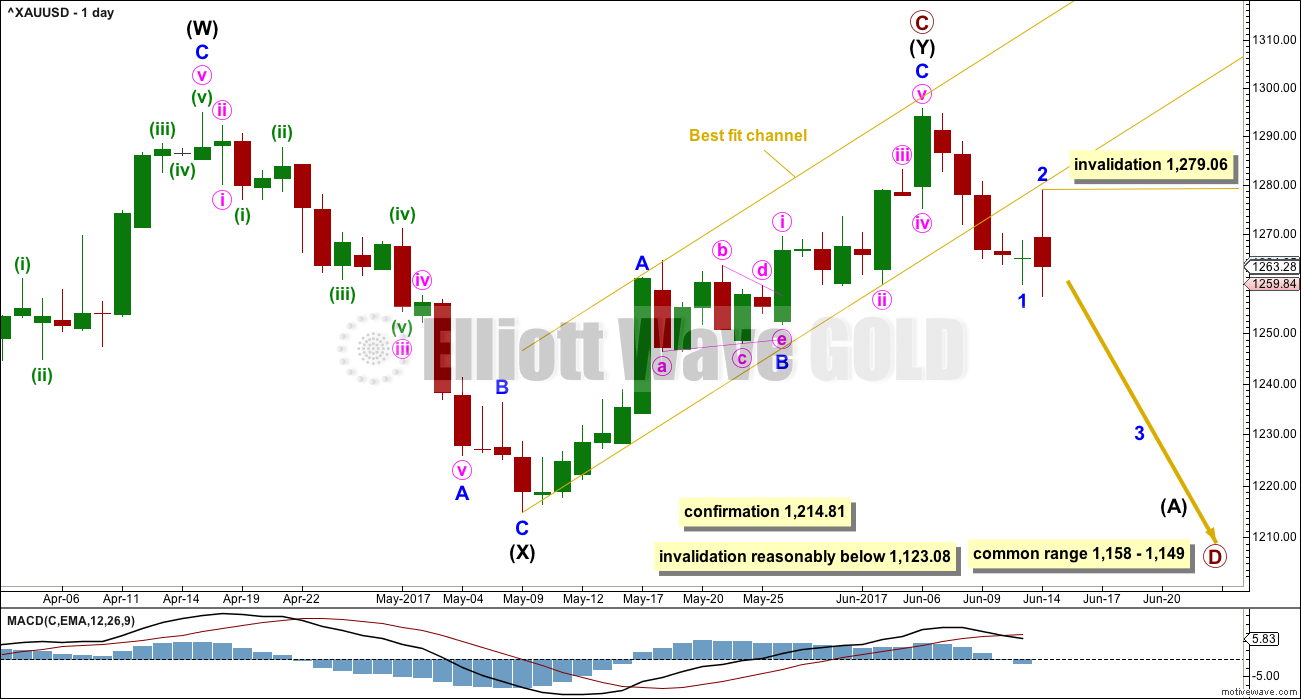
DAILY CHART
Click chart to enlarge.
Intermediate wave (Y) may now be a complete zigzag if it is accepted that a triangle completed in the position labelled minor wave B. This has a perfect fit on the hourly chart.
The best fit channel about intermediate wave (Y) is now properly breached with three full daily candlesticks below and not touching the lower trend line. This adds a little confidence that a high may be in place.
After the channel breach, price has now curved up to retest resistance at the lower edge of the channel. Thereafter, price moved strongly lower. Resistance has held and is now strengthened. The invalidation point may now be moved down. Within minor wave 3, no second wave correction may move beyond its start above 1,279.06.
A new low below 1,214.81 could not be minor wave B within intermediate wave (Y) and would provide strong confirmation that intermediate wave (Y) is over. A new low below 1,214.81 would also invalidate all other weekly alternates published in last historic analysis (this is linked to above). This would provide final confirmation of this main wave count.
A common range for triangle sub-waves is from about 0.8 to 0.85 the prior sub-wave, this gives a range for primary wave D from 1,158 to 1,149.
If primary wave C is correctly labelled as a double zigzag, then primary wave D must be a simple A-B-C structure and would most likely be a zigzag. Within primary wave D, minor wave B may not move beyond the start of minor wave A above 1,295.64.
Primary wave A lasted 31 weeks, primary wave B lasted 23 weeks, and primary wave C may have been complete in 25 weeks.
Primary wave D should be expected to last at least 8 weeks (but most likely longer). The next Fibonacci ratio in the sequence would be a Fibonacci 13 and then 21.
HOURLY CHART
Click chart to enlarge.
Minor wave 2 fits as a deep 0.54 zigzag, falling a little short of the 0.618 Fibonacci ratio of minor wave 1 and a little below the lower edge of the best fit channel.
Minor wave 3 may only subdivide as a simple impulse. After counting the subdivisions on the five minute chart, it looks like minute wave i was complete at today’s low. Minute wave ii may end about either the 0.382 or 0.618 Fibonacci ratios of minute wave i. Minute wave ii may not move beyond the start of minute wave i above 1,279.06.
When minute wave ii is complete, then an increase in downwards momentum should be expected for minute wave iii of minor wave 3.
A target is provided today for minor wave 3, but be aware that the following correction for minor wave 4 may be shallow and very brief.
TECHNICAL ANALYSIS
WEEKLY CHART
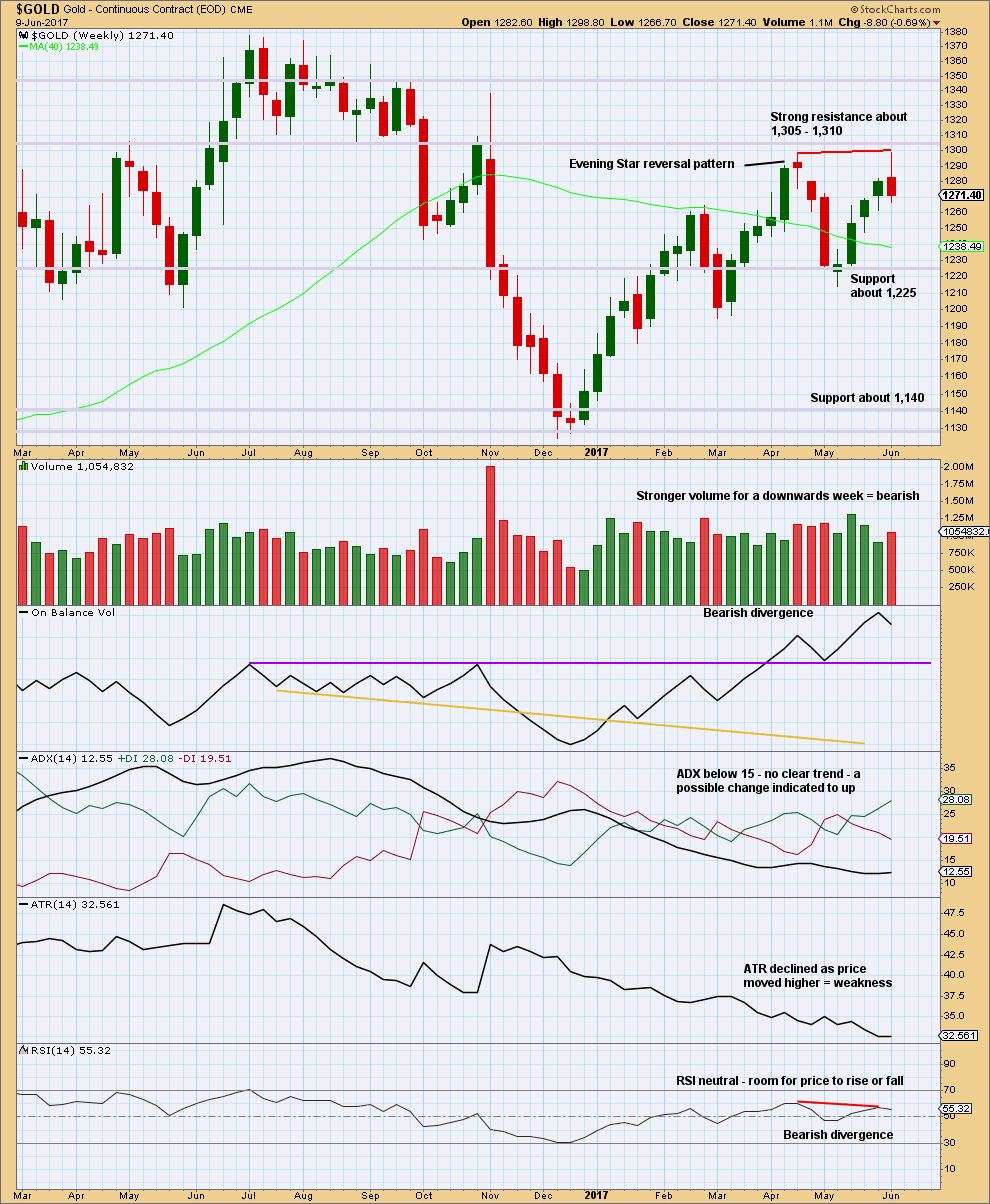
Click chart to enlarge. Chart courtesy of StockCharts.com.
The long upper wick of this weekly candlestick is bearish. Volume is bearish. Divergence between price and RSI at this last high is bearish. ATR is bearish.
Price may have found resistance just below prior strong support at 1,305 to 1,310.
DAILY CHART
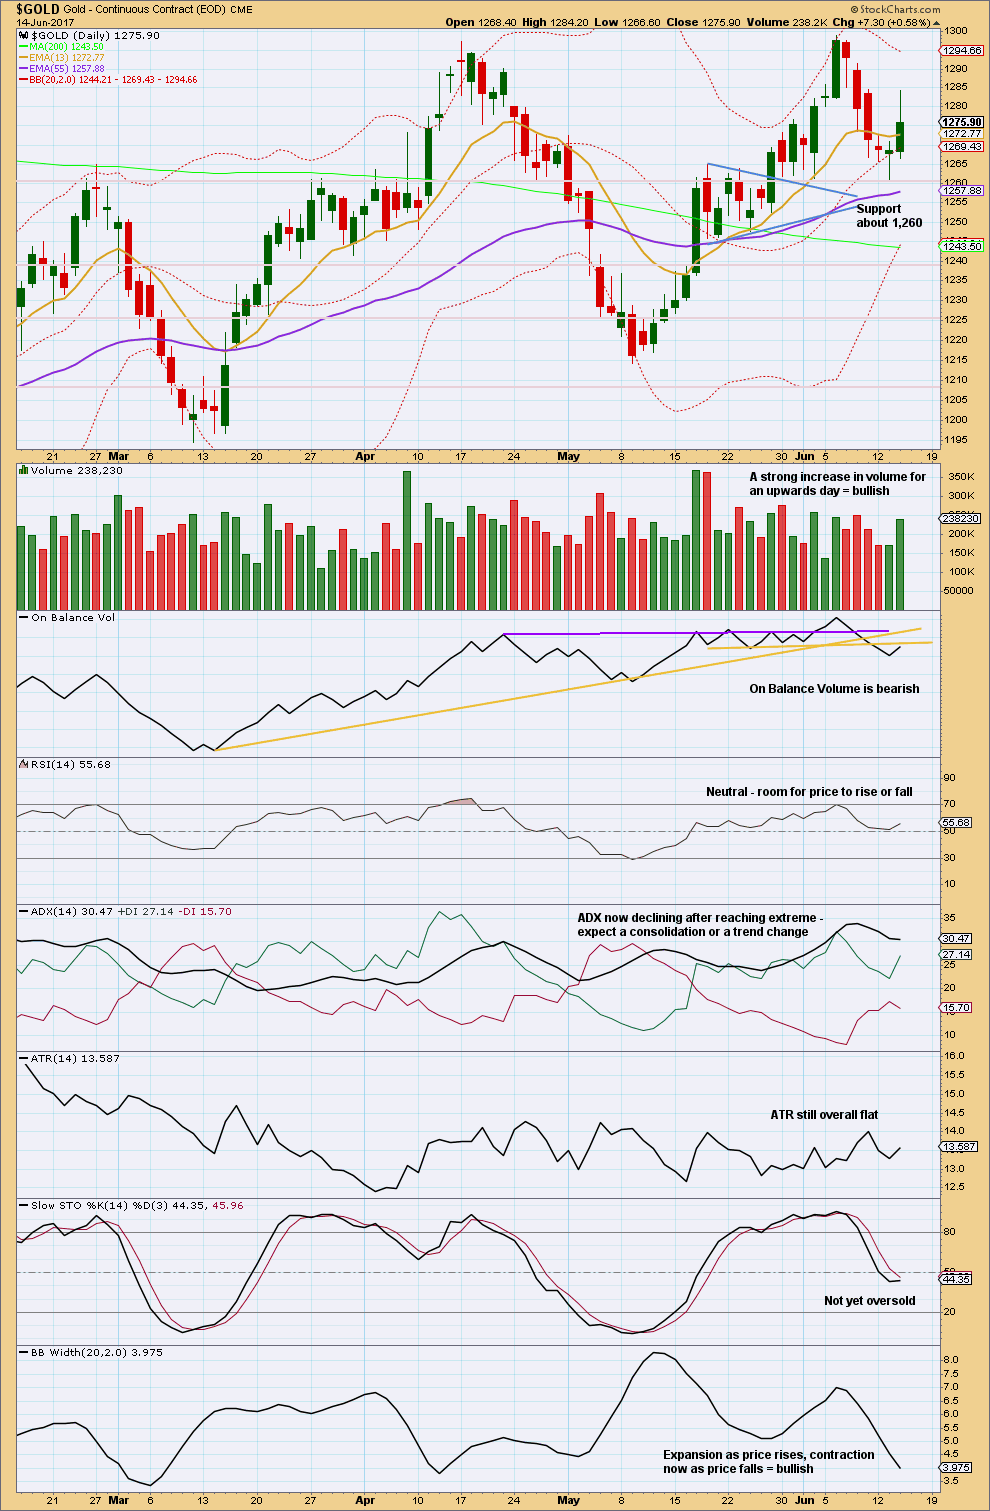
Click chart to enlarge. Chart courtesy of StockCharts.com.
On this chart, what the last daily candlestick does not show is the strong fall in price to a new low in the final two hours of the New York session. I am suspicious that this last daily candlestick may change in coming hours by StockCharts. If it does, then it would make a difference to the volume profile.
The long upper wick on this last daily candlestick is bearish.
On Balance Volume may be at resistance; the last signal it gave was bearish. Give this some reasonable weight.
The only concern for the Elliott wave count is contracting Bollinger Bands as price moves lower. Normally, for a healthy trend Bollinger Bands should expand. They may yet do so.
GDX
DAILY CHART
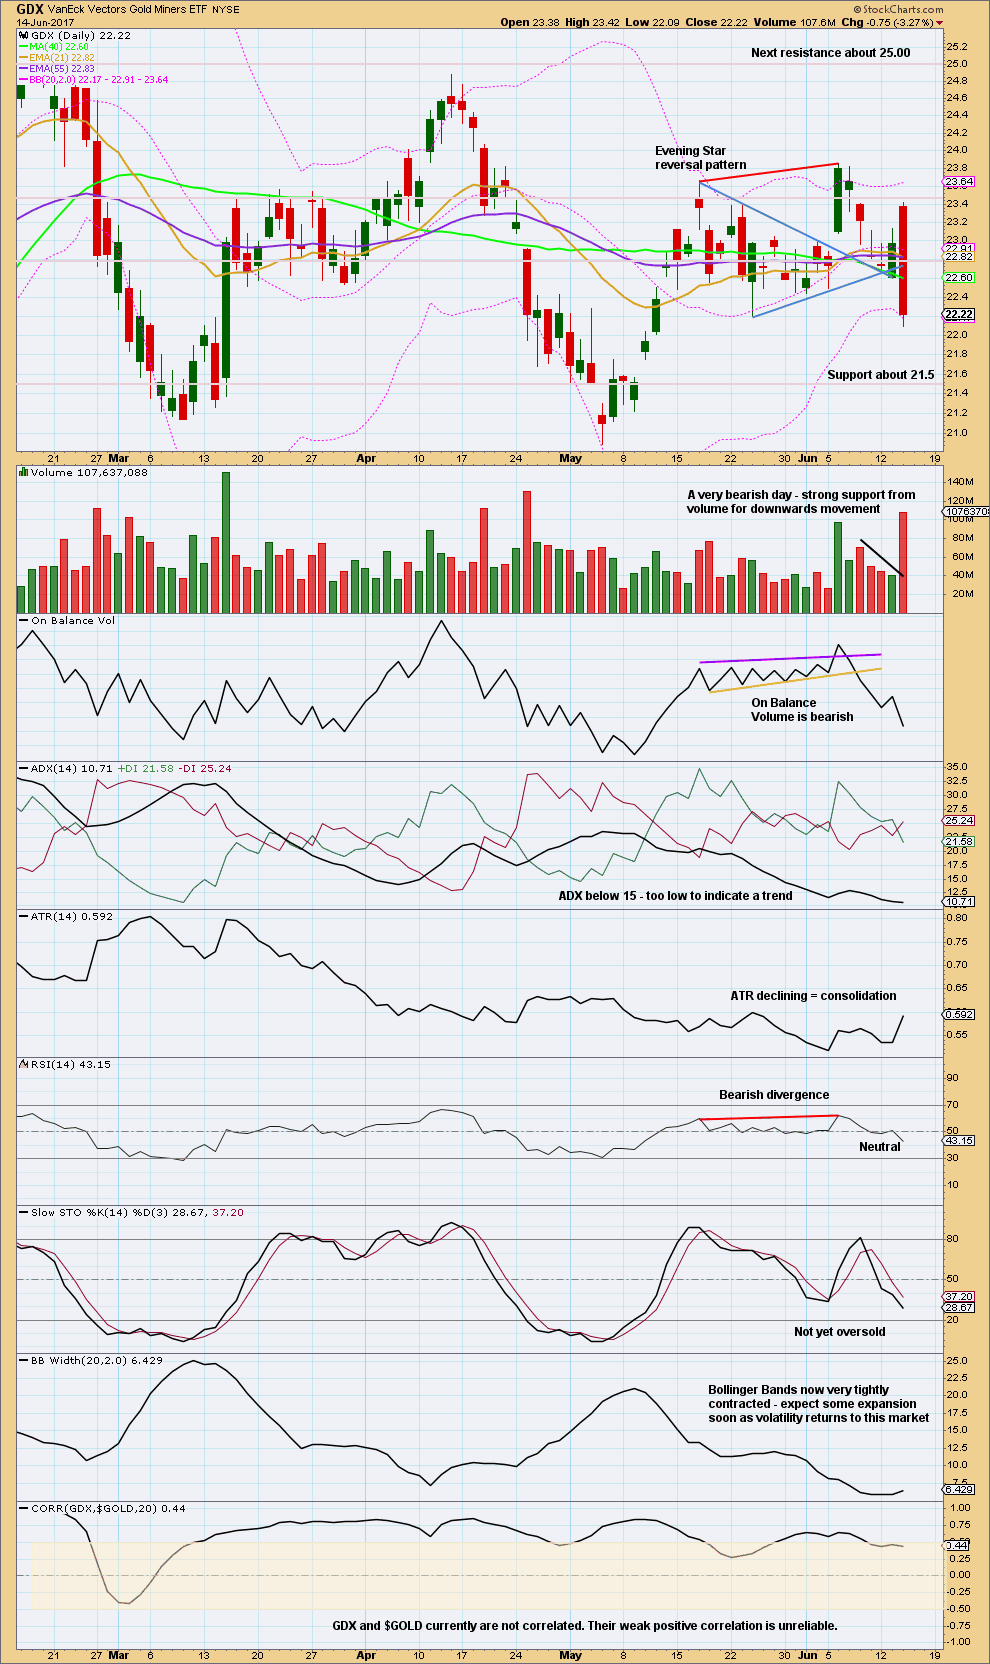
Click chart to enlarge. Chart courtesy of StockCharts.com.
On Balance Volume and volume both look very bearish today. A downwards trend may be beginning for GDX.
This analysis is published @ 09:11 p.m. EST.
For members short on Oil:
I updated charts and gave some advice there yesterday, in the last Oil post.
Oil moved lower today but I am not sure if wave D went lower than wave B for the triangle. I expect the triangle is still in play?
Yep. Still looks viable. So far price is down to 44.32. B is at 43.76. So the B-D trend line still has a positive slope.
Sorry folks, that last second wave correction ended close to 0.382 and didn’t continue any higher to the 0.618 ratio as I had expected it to. The drop today could be part of an expanded flat, but the probability is getting lower and it just doesn’t look quite right.
I should probably chart and publish it as an alternate.
For now I want this to be my main wave count. Price is now at the lower edge of the base channel. A third wave should have the power to break through, and once below should stay below. Should. It doesn’t always work this way, just more often than not.
Target for minor 3 still the same, but beware, if you are like me and prefer to hold positions for a few days to weeks rather than jumping in and out, then minor 4 may be too brief and shallow to see shorts closed. I’ll be expecting to hold on while it unfolds, and when it’s done I’ll calculate a target for minor 5 to end intermediate (A). That’s where I expect to close my shorts.
sandy.
What if the high at 1266.43 at 9:15 am ET had been Minute 2? If the bearish downtrend is strong, it should force second waves to be brief. Then the move down towards 1251.83 could be Minuette 1. If this is correct, then the Minuette 2 rise cannot go higher than 1266.43. In that scenario, I will just short for Minuette 3 once Minuette 2 ends.
If you plan to go long at the low around 1251.83 then be aware of this possibility. Let’s see how this works out.
That’s what I’m going with Alan.
Alan,Lara
Thanks
Alan,
At 7:23 AM low, would you it was the low for a Minute [i] of Minor 3 down?
Or as Lara mentioned it was yesterday 3:55PM?
sandy.
I can’t really tell for sure. Lara said she has gone through a 5-minute chart to work out Minute 1, so I trust she’s correct.
If so, then it looks like Minute 2 is an expanded flat, with the B wave currently at 1.618 Fib. It does mean that the C wave would yield a huge 2.618 Fib rise targeting 1275-1277 which is in line with analysis. The B wave would only be invalidated if it goes much lower.
Thanks Alan, makes sense 1275.70 target is very real.
Do you know the level where it confirms the Wave(c) of Minute [ii] is in progress? TIA
I’ll use candlestick patterns to get an indication. Currently, wave B is already at 1.618 Fib, which is a common point for a reversal. I think the change to the C wave should be any time now.
The $1,278 bounce high was at the Asia market open last night.
It looks down from here, imo.
Ichimoku Gold 4-Hourly Analysis
Data as at 6:35 am ET June 15
=========================
Gold price reached the Ichimoku cloud resistance at the 1280 level as expected and got rejected. This rejection implies that the entire corrective move is not over. It is a very bearish sign for gold and we should expect to see prices fall below the 1259 area and target the 1245-1250. But for today, this drop will only occur after a rebound which is the common reaction to a knee-jerk huge drop following the FOMC antics.
The 4-hour Ichimoku Chart shows prices trading below the cloud. The tenkan-sen had made a negative crossover with the kijun-sen last Thursday, June 8. The tenkan-sen and the kijun-sen have now converged at 1268.93, and whether a positive crossover happens is indecisive at the moment. Should the crossover happens, then price would be encouraged to rise to test the crossover point, and if successful, the bottom cloud boundary at 1277.44. I believe that the 4-hour timeframe bearishness wouldn’t produce sufficient momentum to launch prices above 1277.44. This would be the highest that prices can go for Minor 2. It meshes well with the analysis at the Daily timeframe. Minor 3 then ensues.
My trading strategy for today:
Entry point for a short (DUST) = Minor 2 high at 1277.44 / 1278.90.
Stop = 1279.06, Lara’s invalidation point.
Critical points to monitor = (a) 1256.55, Daily kijun-sen support; (b) Daily top cloud boundary, currently 1248.86.
First target = 1245.30, Daily bottom cloud boundary
Second target = around 1235, 1.618 Fib (the exact value is unknown because Minor 2 has not completed yet).
Use trailing stops for these targets, but definitely take profits at the second target unless something weird happens which sends prices cascading lower.
Happy trading, folks. May your profits continue to grow, following on yesterday’s huge gains.
Pooh bear was out for a walk in the woods and ponders what day is it. It is today says the Piglet. Ah, my kind of day exclaims Pooh… I was thinking I may be over thinking so I wont think! lol… Imo needs a sustained break below 1251 to open up 1243 and possibly lower… // Nice work Alan, thanks so much, keeps us all honest I guess // 🙂
Ha ha. Thanks Syed for the compliments.
Pooh is a “bear with very little brain”, according to A. A. Milne. He believes in whatever was told to him. It would be a different story if he meets Tigger (the perennial optimist) or Eeyore (the forever pessimist).
Ichimoku Gold Daily Analysis
Data as at market close June 14
==========================
Gold prices initially moved up on Wednesday until the release of the Fed statement. Once the Fed stated hawkishly that they will go ahead with reducing the balance sheet despite inflation and retail sales data coming in much weaker than expected, prices crashed to the lows and continues to be weak as of this writing. Investors seem to be searching for an equilibrium, and the 1260 level, where we have seen a lot of action in the past, again will become important.
At the daily timeframe, the Ichimoku Chart shows that the trend remains moderately healthy. Although prices fell hard yesterday, gold is still in a bullish trend. The cloud remains green. The tenkan-sen remains comfortably ensconced above the kijun-sen. However, gold price has dropped below the tenkan-sen. For now, prices have rebounded off the lows at 1257.48, and is now trading between tenkan-sen resistance at 1278.90 and kijun-sen support at 1256.55. I am of the opinion that the Minor 2 rebound will not reach above the 1278.90 kijun-sen resistance. Lara has the invalidation point as 1279.06, which correlates extremely well. A break above that point will increase the likelihood of the resumption of the strong bullish trend. Many investors are probably camped there, waiting to load up. A drop below the 1256.55 kijun-sen support will be cushioned by the top cloud boundary, followed by the bottom cloud boundary at 1245.30. Any drop below that and we are in entrenched bear territory.
It is still difficult to prognosticate whether the bearish or the bullish scenario will come to pass. Analysts have been aligned on both sides. In one camp, those advocates working with cycles swear that gold will re-test the 1200 psychological round number. In another, the drop will only last until the bottom cloud boundary at 1245.30, or in the worst case scenario, around the 1220s, where there is cluster of supports. Only time can tell. If the Daily Ichimoku chart is of any indication, the cloud turns red briefly next week, followed by a return to the green. For us day traders, I guess our best strategy is to bury our nose in the immediate price action and take it one day at a time.
Yep. One day at a time. A good idea.
Thank you very much Alan for sharing your analysis and chart.
Two possible bullish patterns in play here for GDX:
1) An almost 5 year Rounded Bottom. A Rounded Bottom is a variation of an Inverted Head & Shoulders pattern
2) A Descending Broadening Wedge (79% bullish breakout odds)
Look them both up at thepatternsite.com or another site as desired.
https://www.tradingview.com/x/fHhRsN92/
Thank you for the chart and pattern ideas Dreamer.
Isn’t it interesting how the Magee bear market trend line is not working for GDX.
Just a nice example of how these techniques most often work, but not always.
Now…. if we could just find one thing that always works, we’d be very rich indeed!
Yes, deception is the name of the game. No sure thing 🙃😗
Dreamer, thank you for sharing your work here. You are an inspiration. This bigger picture is another piece of the pie. Appreciate your pointing it out.
Question for you, are the GDX charts from 6-12-17 still good; I’m watching the invalidation points there as a trigger. Much appreciated.
Yes, I have a bull and bear triangle for GDX that are dueling it out. We may get a breakout any day now. I keep looking for an edge as to which one may be correct, very difficult. Will update the charts later. 🙂
No worries. Good to know.