
Overall more downwards movement was expected and did happen, but a small bounce was expected to end about 1,270 first and that did not happen.
Summary: A small third wave down should continue tomorrow. Expect any price shocks to be to the downside, with upside limited to no further than 1,266.43. The short term target is 1,221 but that may be too high a point to exit shorts. The longer term target at 1,158 – 1,149 may be too low. Move stops down to protect some profit now and hold on.
Always use a stop. Invest only 1-5% of equity on any one trade.
New updates to this analysis are in bold.
Last monthly charts and alternate weekly charts are here, video is here.
Grand SuperCycle analysis is here.
WEEKLY CHART I
Click chart to enlarge.
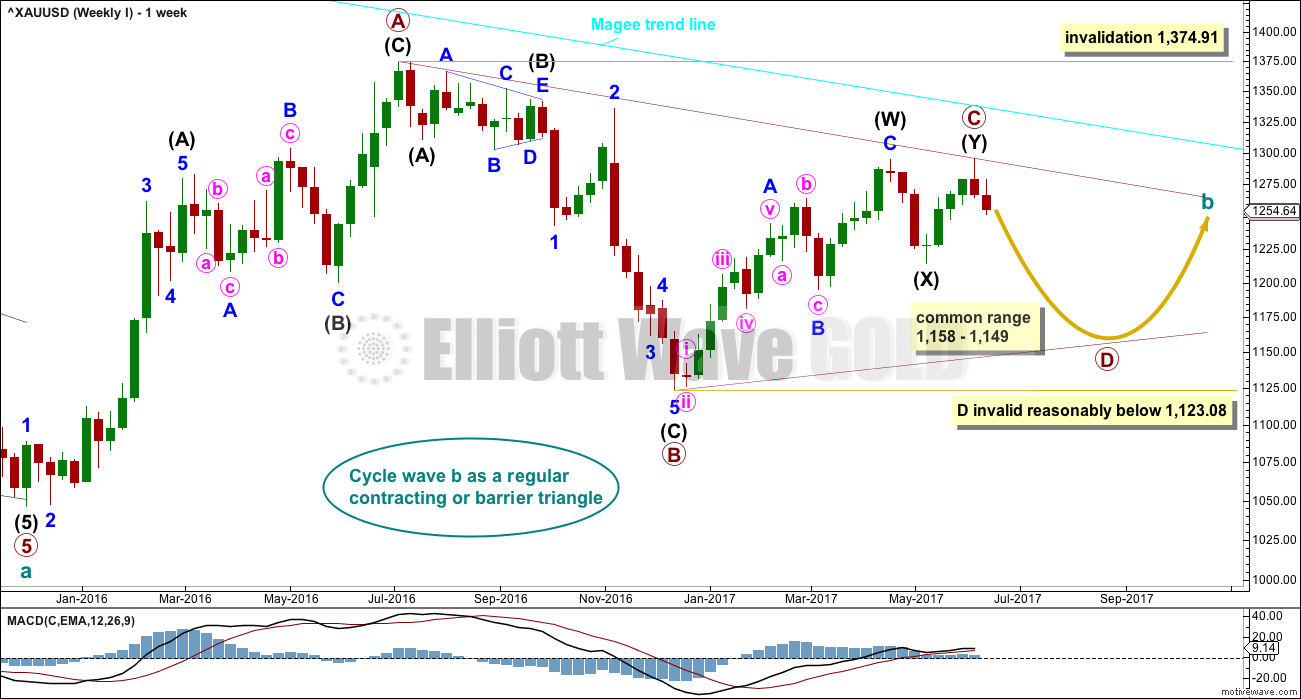
The Magee bear market trend line is added to the weekly charts. This cyan line is drawn from the all time high for Gold on the 6th of September, 2011, to the first major swing high within the following bear market on the 5th of October, 2012. This line should provide strong resistance.
At this stage, a triangle still looks most likely and has the best fit for cycle wave b.
Within a triangle, one sub-wave should be a more complicated multiple, which may be primary wave C. Primary wave C may not move beyond the end of primary wave A above 1,374.91. This invalidation point is black and white.
At this stage, it looks like primary wave C is now complete at the hourly and daily chart level. However, at the weekly chart level, it looks possible it may continue higher. This possibility must be acknowledged while price remains above 1,214.81. Within intermediate wave (Y), minor wave B may not move beyond the start of minor wave A.
Primary wave D of a contracting triangle may not move beyond the end of primary wave B below 1,123.08. Contracting triangles are the most common variety.
Primary wave D of a barrier triangle should end about the same level as primary wave B at 1,123.08, so that the B-D trend line remains essentially flat. This involves some subjectivity; price may move slightly below 1,123.08 and the triangle wave count may remain valid. This is the only Elliott wave rule which is not black and white.
Primary wave C may end when price comes up to touch the Magee trend line.
There are three alternate wave counts that have been published in the last historic analysis, which is linked to above. They are all very bullish. Members may like to review them at this stage. They will only be published on a daily basis if price shows them to be true with a new high now above 1,295.65.
DAILY CHART
Click chart to enlarge.
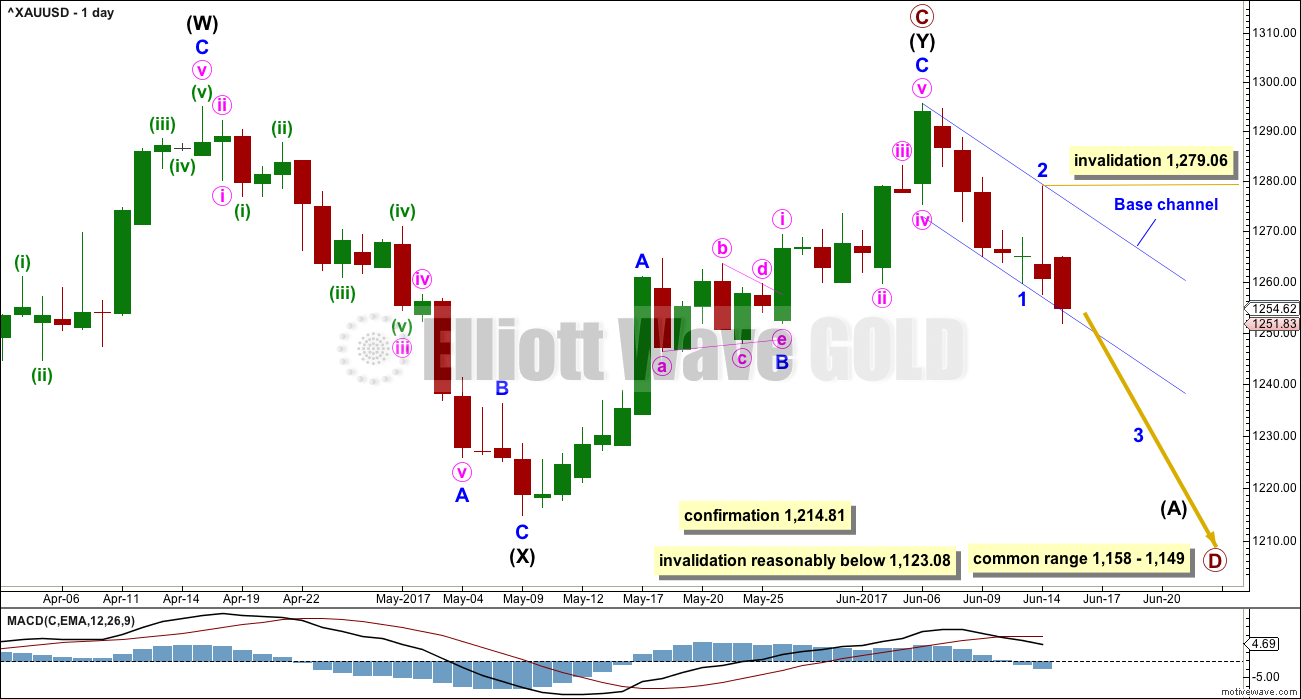
Intermediate wave (Y) may now be a complete zigzag if it is accepted that a triangle completed in the position labelled minor wave B. This has a perfect fit on the hourly chart.
Within minor wave 3, no second wave correction may move beyond its start above 1,279.06.
A new low below 1,214.81 could not be minor wave B within intermediate wave (Y) and would provide strong confirmation that intermediate wave (Y) is over.
A common range for triangle sub-waves is from about 0.8 to 0.85 the prior sub-wave, this gives a range for primary wave D from 1,158 to 1,149.
If primary wave C is correctly labelled as a double zigzag, then primary wave D must be a simple A-B-C structure and would most likely be a zigzag. Within primary wave D, minor wave B may not move beyond the start of minor wave A above 1,295.64.
Primary wave A lasted 31 weeks, primary wave B lasted 23 weeks, and primary wave C may have been complete in 25 weeks.
Primary wave D should be expected to last at least 8 weeks (but most likely longer). The next Fibonacci ratio in the sequence would be a Fibonacci 13 and then 21.
HOURLY CHART
Click chart to enlarge.
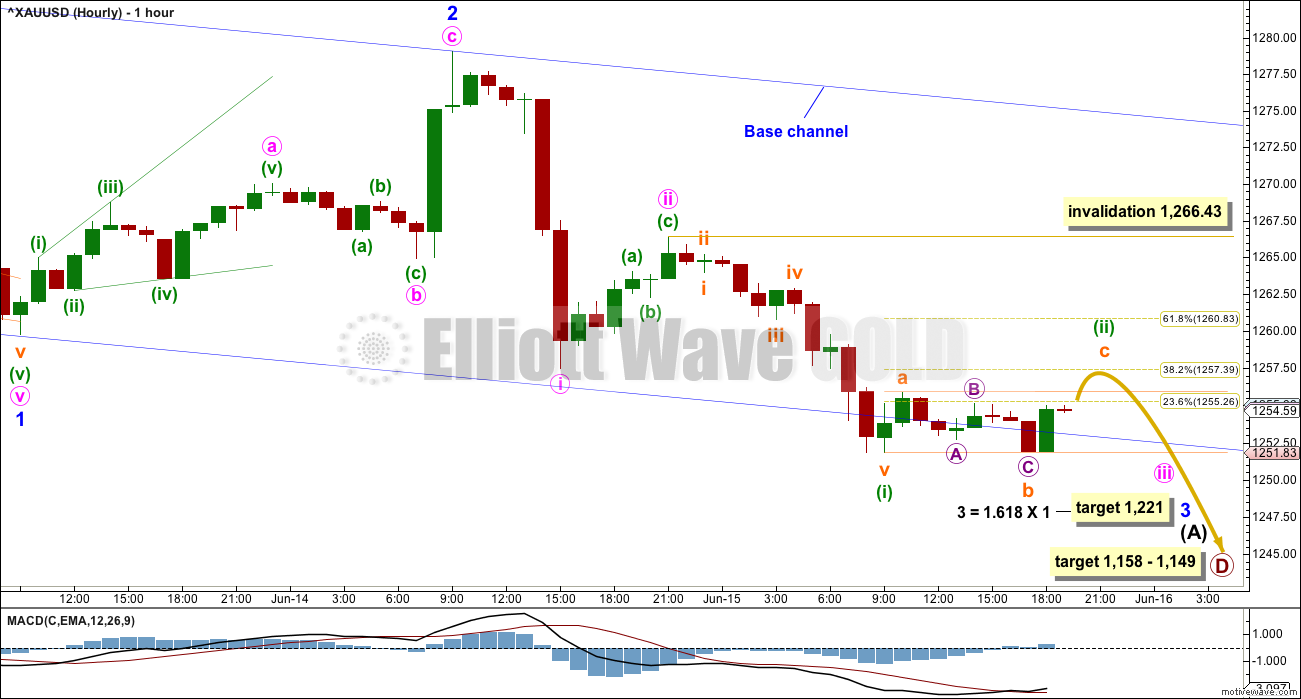
Minor wave 2 fits as a deep 0.54 zigzag, falling a little short of the 0.618 Fibonacci ratio of minor wave 1 and a little below the lower edge of the best fit channel.
Minor wave 3 may only subdivide as a simple impulse. So far, within minor wave 3, minute waves i and ii are complete. It is also possible now that minute wave iii could be complete at today’s low; the following and current correction has so far remained below minute wave i price territory at 1,267.53. Although that labelling would be valid, it would see minute wave iii much shorter than minute wave i. This is possible, but the probability is very low. What looks much more likely so far is only minuette wave (i) is complete within minute wave i.
So far there would now be three first and second waves complete. This suggests a further and strong increase in downwards momentum to come very soon. There may be a price shock on a news release within the next 24 hours. If there is, then it may see an initial short lived upwards spike to end about 1,257 or 1,261 followed by strong downwards movement to new lows.
Minuette wave (ii) may be completing as either a regular flat or a zigzag. It may not move beyond the start of minuette wave (i) above 1,266.43.
A target is provided for minor wave 3, but be aware that the following correction for minor wave 4 may be shallow and very brief.
TECHNICAL ANALYSIS
WEEKLY CHART
Click chart to enlarge. Chart courtesy of StockCharts.com.
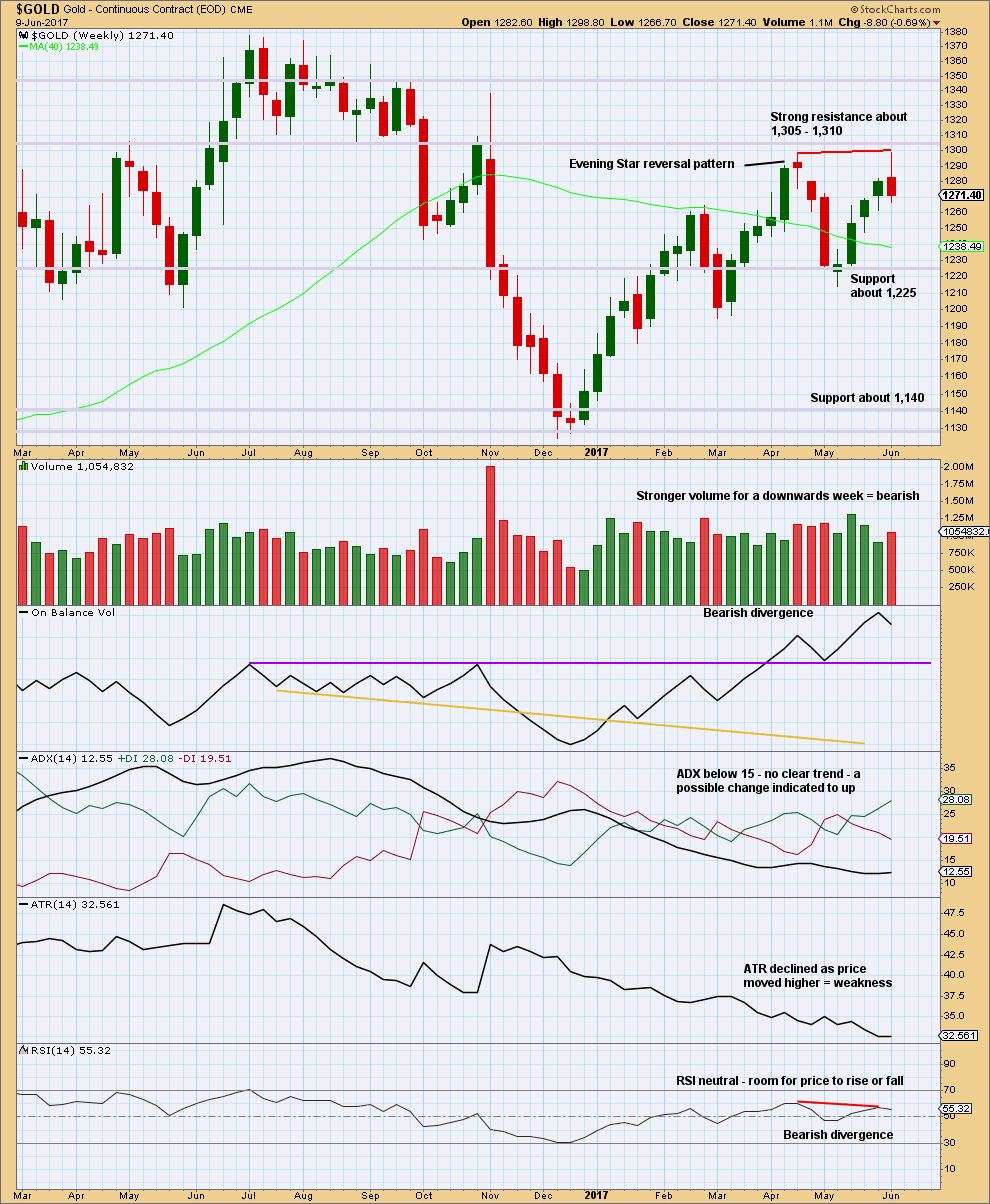
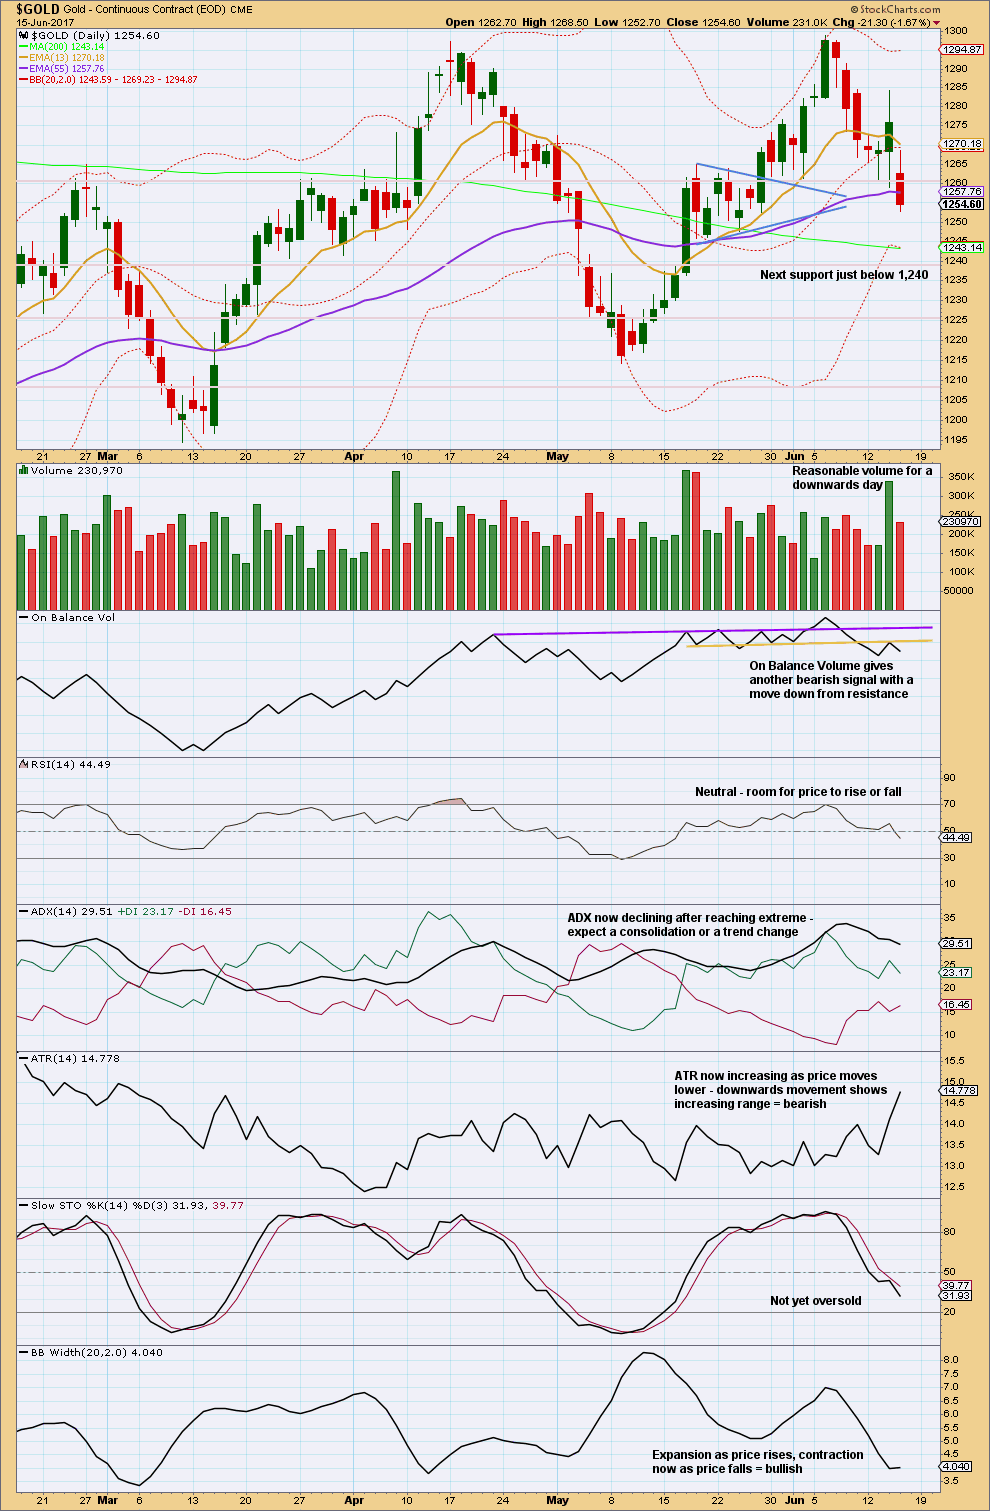
The long upper wick of this weekly candlestick is bearish. Volume is bearish. Divergence between price and RSI at this last high is bearish. ATR is bearish.
Price may have found resistance just below prior strong support at 1,305 to 1,310.
DAILY CHART
Click chart to enlarge. Chart courtesy of StockCharts.com.
Support about 1,260 has given way. Next strong support is just below 1,240.
The long upper wick on today’s candlestick is bearish. There is some support from volume.
Give weight to bearish signals from On Balance Volume.
There is room for price to fall. RSI and Stochastics are still in neutral territory.
GDX
DAILY CHART
Click chart to enlarge. Chart courtesy of StockCharts.com.
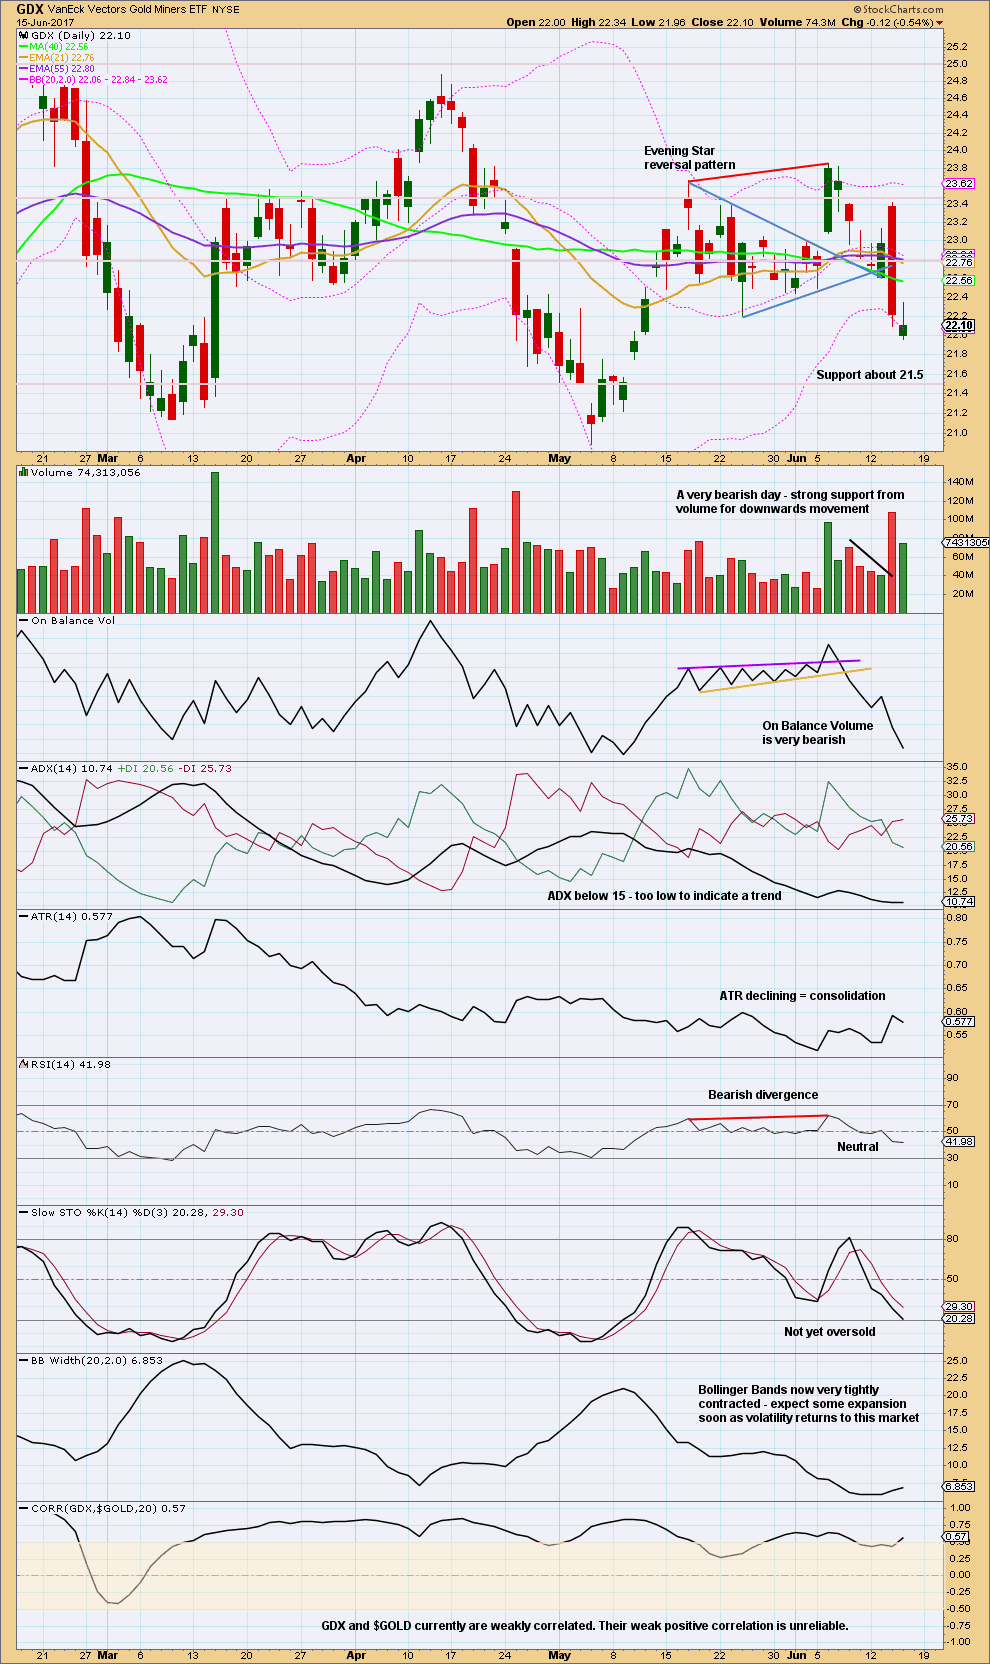
The upper wick on today’s candlestick is bearish. Some support from volume is bearish.
Give reasonable weight to On Balance Volume because it is very bearish. Next support is about 21.50.
This analysis is published @ 08:37 p.m. EST.
With a green daily candlestick today this small correction now shows up on the daily chart. Minor 2 also shows up nicely on the daily chart as a spike.
With both showing up on a higher time frame it looks like they are corrections of the same degree.
This means that minor 3 would be shorter than minor 1. This means that minor 5 will be limited to no longer than 27.23 so that minor 3 is not the shortest and the core EW rule is met.
Redraw the channel. Note the invalidation point changes.
I’m still hanging in there to see a five down complete, then I’ll exit only when a channel is breached or a target is met.
When minor 4 is over then I’ll calculate a target for minor 5 for you. It will probably be about 1,230.
I took profits today on my GLD bearish call credit spreads (118.50/120.50) and rolled into SLV 15/16 call credit spreads. I opted for a more conservative trade as I was expecting a bit more momentum for a third wave down. The rather torpid price action I think argues that a triangle is indeed in play so I pushed my spreads out a few weeks to ride the long leg of the spread up at the end of wave D.
How are you guys trading the move down?
Jordan is bearish
https://thedailygold.com/video-update-downside-risk-increasing/
Jordan is bearish
https://thedailygold.com/video-update-downside-risk-increasing/
Ichimoku Gold 4-Hourly Analysis
Data as at 4:25 am ET June 16
=========================
Yesterday’s analysis at the 4-hour timeframe pondered whether gold prices could make a positive crossover of the tenkan-sen with the kijun-sen. As you can see from the chart, it didn’t happen, and of course the bearish overtones sent prices lower. As Lara put it succinctly in her post at 3:38 pm, “that last second wave correction ended close to 0.382 and didn’t continue higher to the 0.618 ratio as I had expected it to (sic)”. In fact, a few hours after market close, the tenkan-sen broke the convergence and continued south so that the status quo of tenkan-sen lying below kijun-sen again manifested. Also, price trades below these two lines. At the same time, the 4-hour cloud turned red. These signify that the trend is bearish, and more drops would be expected of the gold price today. The downtrend is gathering strength since all price rebounds are attenuated. In Lara’s Main Count, the third wave at 3 degrees (Minor, Minute and Subminuette) will soon be underway once the muted price rise in Subminuette C of Minuette 2 is completed.
The next port of call would be the Daily Ichimoku cloud support at 1245.30, where important support is found. How well the weakened bull defends that position will determine whether a stronger bearish trend sets in or a strong reversal to return to bullishness will emerge. I would be watching that level closely, and be ready to take profits from my short gold positions should the wind changes direction.
Trading strategy for those who have short positions:
(1) Monitor
(1a) Daily top cloud boundary, currently 1248.90, but which drops to cloud bottom over the weekend.
(1b) Daily bottom cloud boundary, 1245.30.
(2) Be ready to take profits should a bullish reversal occurs. I will use the top cloud boundary at 1248.90 as the decision point. A rise through that and I’m out.
(3) If 1245.30 succumbed easily, load up on shorts for the bearish onslaught towards the 1220s.
Happy trading, folks. Hope this helps.
Thank you very much Alan for sharing.
I’ll just add that any members taking Alan’s trading advice do so entirely at your own risk.
Manage that risk carefully please. Disciplined risk management is the single most important aspect of trading. You should all know my two Golden Rules by now 🙂
Yes. I do advocate the same advice that Lara gave. The trading strategy I post is what I see at a given moment in time, one that I use for my own trades. Members are urged to do their own due diligence. There is no plan that fits everyone. I put up my ideas so that others may check and discuss. I’m sure there are many people with much better plans than I do, and if they can share them it would be great. Our moral obligation as members of a community is to try to make trading life easier for everyone. If we have friends to exchange ideas it would be much easier than to trade on our own. Trading very often is a lonely process, emotionally frustrating at times, and fraught with hidden pitfalls.
I was a bit confused about your comment regarding a rise through 1248.90 as we gave yet to breach that price point. Did I miss something?
( I suspect you meant 1290.48 🙂 )
Sorry Verne, I did not make myself clear. What I meant is that if prices do rebound off the 1245.30 support, then it could be time to bail out because the bull could take off from there and I don’t want to leave money on the table, only to see it vaporise. But what if it is a false alarm, and prices continue to fall? This type of scenario have played out time and time again. The crux of the matter is: when should one exit a trade? I do not want to panic and exit any old how. There has to be a scientific approach. My recourse is to decide on a point that the trade isn’t going to work in my favour, and get out from there. It’s much like a stop. In this case, the last support at 1248.90 ought to become resistance to the rise in price. If that point is breached, it means price is going to run away. To me, it is a convenient marker for an exit. This strategy is sort of like an insurance. Don’t get out in a haste, but have a plan. Hope this makes sense.
Got it! Thanks.
With regard to timing exits, I like to take my cue from Silver. After it got rejected at its own 200 dsma, I was fairly confident Gold would follow it down. I expect Silver will also lead the reversal.
Bulls and Bears trying to settle their differences amicably
This is what happens when there is a monkey manipulating them.
This is so true. The real question though, is who’s the monkey?
Fed – Yellen? ECB – Draghi?
With leverage, both get slaughtered.
That’s easy. The monkey is Mr. Market!
And he is an absolute master at monkey business. 🙂
Here’s the bull count
https://www.tradingview.com/x/OSAKmX2r/
Still watching 2 triangle scenarios for GDX. A breakout appears imminent within the next few days. This is the bear count
https://www.tradingview.com/x/p8qlbNIJ/
Totally agree, Dreamer.
I reckon the slugfest would occur either today or early next week. My battle lines are 1245.30, or failing that, the 1220s.
Ichimoku Gold Daily Analysis
Data as at market close June 15
==========================
The much-hoped-for bounce on the day following the Fed statement died down in a whimper. The bullish stance from the Fed caught the markets by surprise. That they had chosen to brush aside weak economic numbers as just a one-off event fazed investors. We saw prices continue to fall, first towards the 1260-1265 region, which had been staunch support, and then towards the next support at 1256.55, yesterday’s daily kijun-sen support. Prices did not last long there and have since fallen further towards the next support at 1248.86, yesterday’s top cloud boundary. This ought to hold prices for the moment.
At the daily timeframe, the Ichimoku Chart shows that the bullish trend is now under considerable pressure. Although the cloud remains green with the tenkan-sen still comfortably ensconced above the kijun-sen, gold price has dropped below the tenkan-sen and is now straddling the kijun-sen which is 1257.85 at the daily timeframe. This is the second bear warning. Should prices continue to fall unabated, the top cloud boundary, followed by the bottom cloud boundary at 1245.30, would be the last lines of defence. Any drop below that and we are in entrenched bear territory.
Dreamer had also echoed that it is still difficult to determine whether the bearish or the bullish scenario will come to pass. At the moment, the second stage Tercio de Banderillas has begun. Some sharp barbed sticks had already been planted into the bull’s shoulders (courtesy of the Fed, of course). I can visualise the bears licking their chops at 1245.30. That would be the final stage, Tercio de Muerte. Their first target would be to harass the bull to the 1220s where there is a cluster of supports. Then, whether an indulto is granted to the bull remains to be seen. If no pardon is granted to the bull at the 1220s, it would be estocada. Lara envisions 1158 or 1149 for that.
On the other hand, some of us have bullish counts. For mine, we are in the 5th wave of the correction which should complete at 1245.30, if not the 1220s should the 5th wave be extended. The Daily Ichimoku chart shows the cloud turning red briefly next week, followed by a return to the green. In that scenario, the bull had pulled a great upset over the plans of the matadors. He lives to fight again another day.
Note: No animals have been hurt during the proceedings. This is the privilege of paper trading over the real thing.
Great analysis and fun Alan. As always, thanks for sharing!
Well done, felt like I just got a lesson in bull fighting.
LOL
Thanks for the laugh Alan
Thanks people. I hate lonely and dull environments like those when trading. I believe in having fun while working. It makes life easier. Yes, good clean fun. By the way, here’s wishing all a nice weekend.