
A little sideways movement was expected to be followed by more downwards movement. This is mostly what happened, although price did not move any higher first.
Summary: Downwards movement in the short term should be limited to 1,229.88. The target is now 1,235, which may be met in one more session. Thereafter, a multi-day to multi-week bounce should begin for wave B.
Always use a stop. Invest only 1-5% of equity on any one trade.
New updates to this analysis are in bold.
Last monthly charts and alternate weekly charts are here, video is here.
Grand SuperCycle analysis is here.
WEEKLY CHART I
Click chart to enlarge.
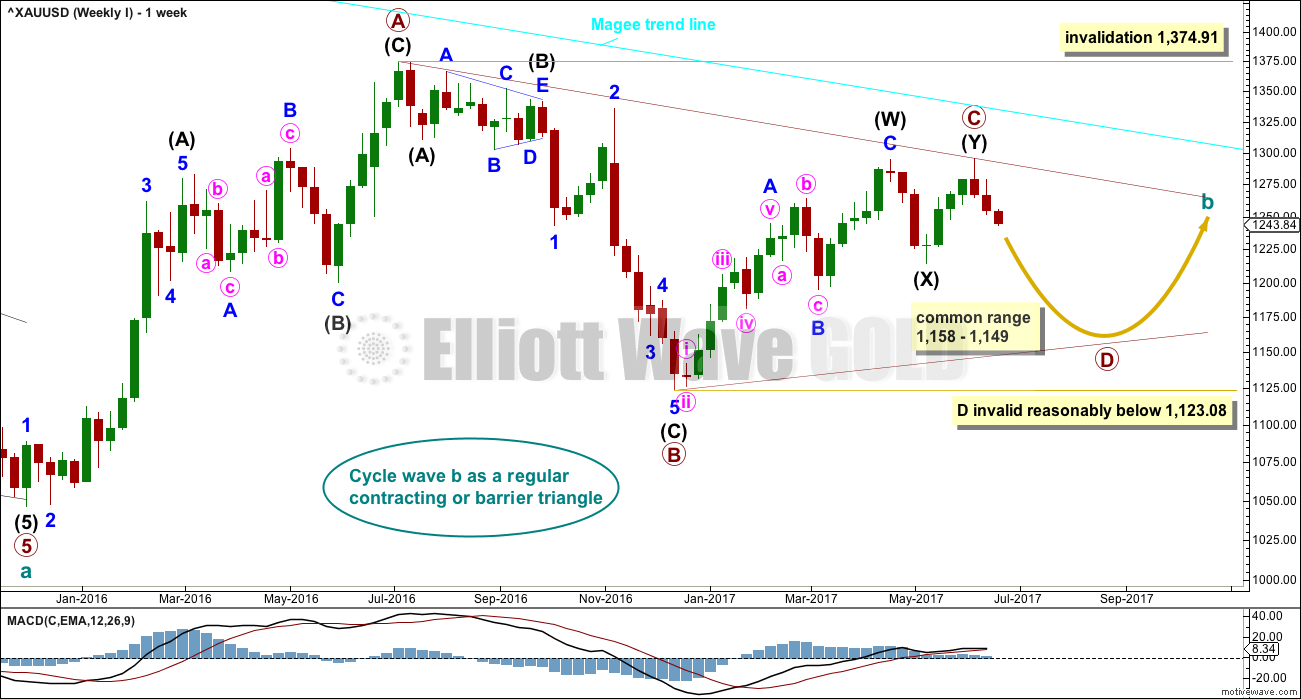
The Magee bear market trend line is added to the weekly charts. This cyan line is drawn from the all time high for Gold on the 6th of September, 2011, to the first major swing high within the following bear market on the 5th of October, 2012. This line should provide strong resistance.
At this stage, a triangle still looks most likely and has the best fit for cycle wave b.
Within a triangle, one sub-wave should be a more complicated multiple, which may be primary wave C. Primary wave C may not move beyond the end of primary wave A above 1,374.91. This invalidation point is black and white.
At this stage, it looks like primary wave C is now complete at the hourly and daily chart level. However, at the weekly chart level, it looks possible it may continue higher. This possibility must be acknowledged while price remains above 1,214.81. Within intermediate wave (Y), minor wave B may not move beyond the start of minor wave A.
Primary wave D of a contracting triangle may not move beyond the end of primary wave B below 1,123.08. Contracting triangles are the most common variety.
Primary wave D of a barrier triangle should end about the same level as primary wave B at 1,123.08, so that the B-D trend line remains essentially flat. This involves some subjectivity; price may move slightly below 1,123.08 and the triangle wave count may remain valid. This is the only Elliott wave rule which is not black and white.
Primary wave C may end when price comes up to touch the Magee trend line.
There are three alternate wave counts that have been published in the last historic analysis, which is linked to above. They are all very bullish. Members may like to review them at this stage. They will only be published on a daily basis if price shows them to be true with a new high now above 1,295.65.
DAILY CHART
Click chart to enlarge.
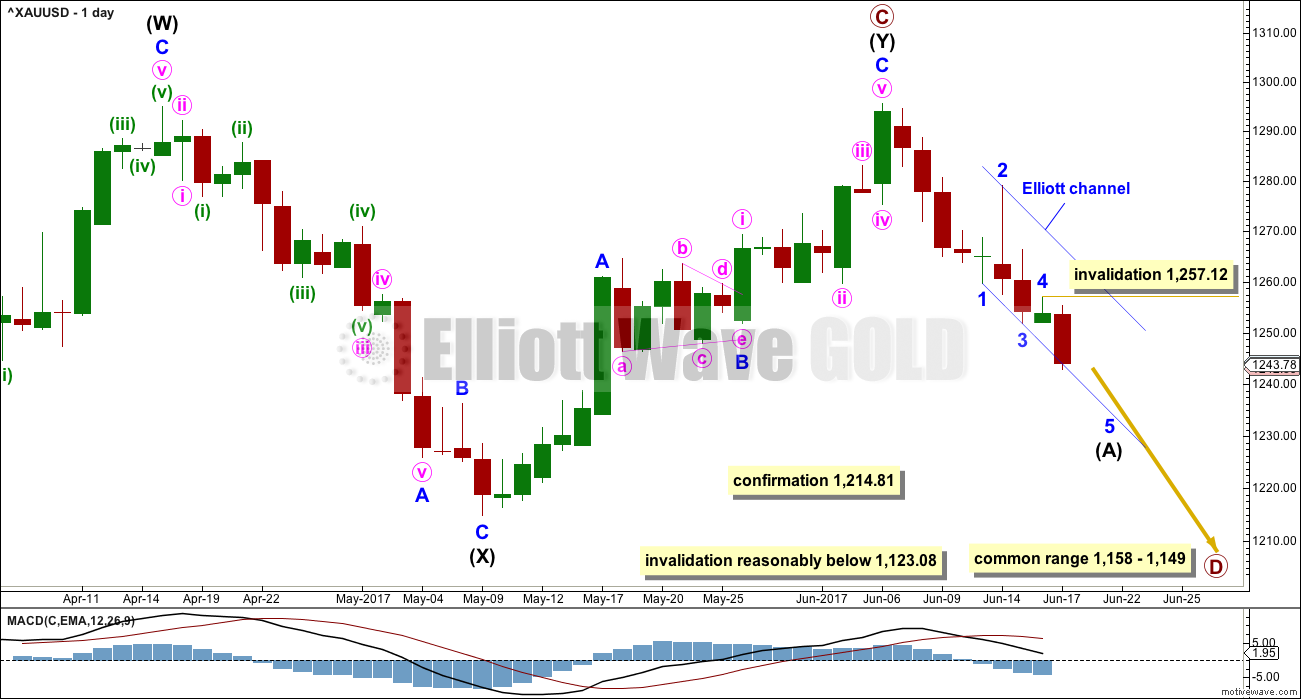
Intermediate wave (Y) may now be a complete zigzag if it is accepted that a triangle completed in the position labelled minor wave B. This has a perfect fit on the hourly chart.
A new low below 1,214.81 could not be minor wave B within intermediate wave (Y) and would provide strong confirmation that intermediate wave (Y) is over.
A common range for triangle sub-waves is from about 0.8 to 0.85 the prior sub-wave, this gives a range for primary wave D from 1,158 to 1,149.
If primary wave C is correctly labelled as a double zigzag, then primary wave D must be a simple A-B-C structure and would most likely be a zigzag. Within primary wave D, minor wave B may not move beyond the start of minor wave A above 1,295.64.
So far a five down looks to be almost complete, which may be intermediate wave (A). Within intermediate wave (A), minor waves 1 through to 4 now look complete at the daily and hourly chart levels. Within minor wave 5, no second wave correction may move beyond its start above 1,257.12.
Draw an Elliott channel about intermediate wave (A) and copy it over to the hourly chart. Price is finding support at the lower edge.
Primary wave A lasted 31 weeks, primary wave B lasted 23 weeks, and primary wave C may have been complete in 25 weeks.
Primary wave D should be expected to last at least 8 weeks (but most likely longer). The next Fibonacci ratio in the sequence would be a Fibonacci 13 and then 21.
HOURLY CHART
Click chart to enlarge.
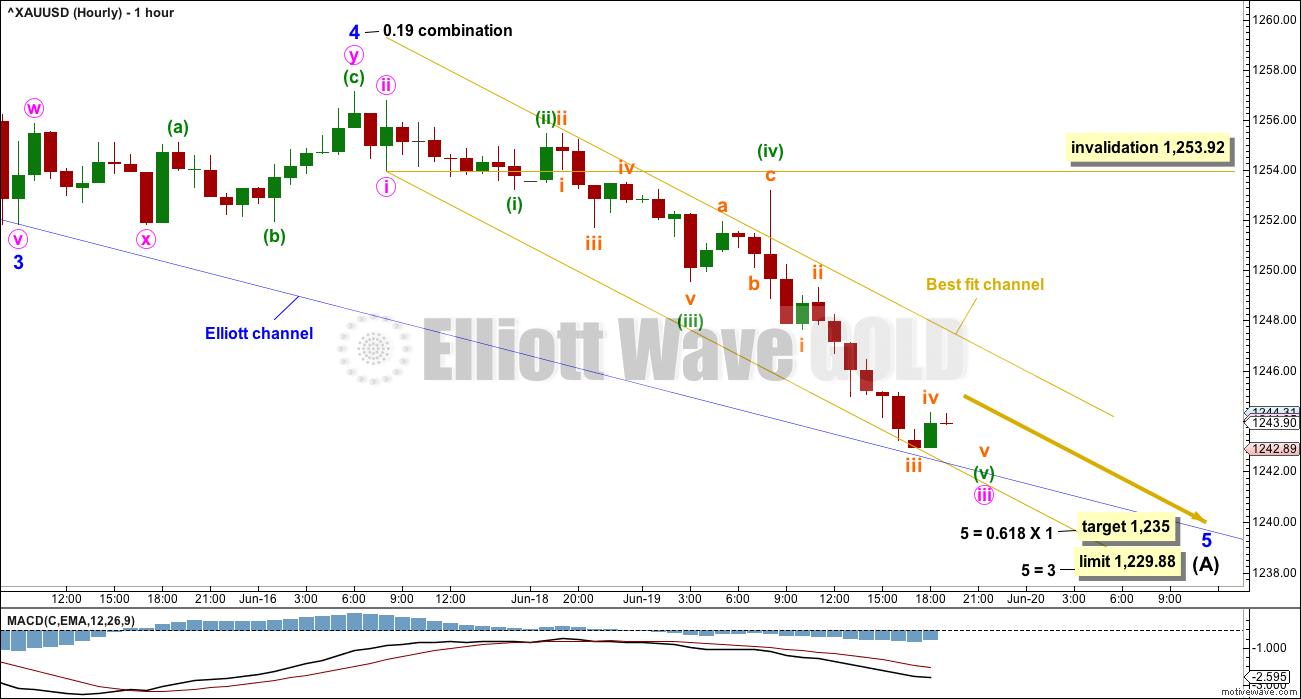
Minor wave 3 was shorter than minor wave 1. This limits minor wave 5 to no longer than equality in length with minor wave 3, so that minor wave 3 is not the shortest actionary wave within the impulse. This limit is at 1,229.88.
There is perfect alternation between the deep zigzag of minor wave 2 and the shallow combination of minor wave 4.
Fifth waves most often exhibit Fibonacci ratios to first waves. The target calculated expects this.
Within minor wave 5, the correction of minute wave iv may not move into minute wave i price territory above 1,253.92.
A best fit channel is drawn about minor wave 5. When this channel is breached by upwards movement, that may be the earliest indication that minor wave 5 would be over.
Members may like to exit short positions either when the target at 1,235 is met, or when the best fit channel is breached by upwards movement.
TECHNICAL ANALYSIS
WEEKLY CHART
Click chart to enlarge. Chart courtesy of StockCharts.com.
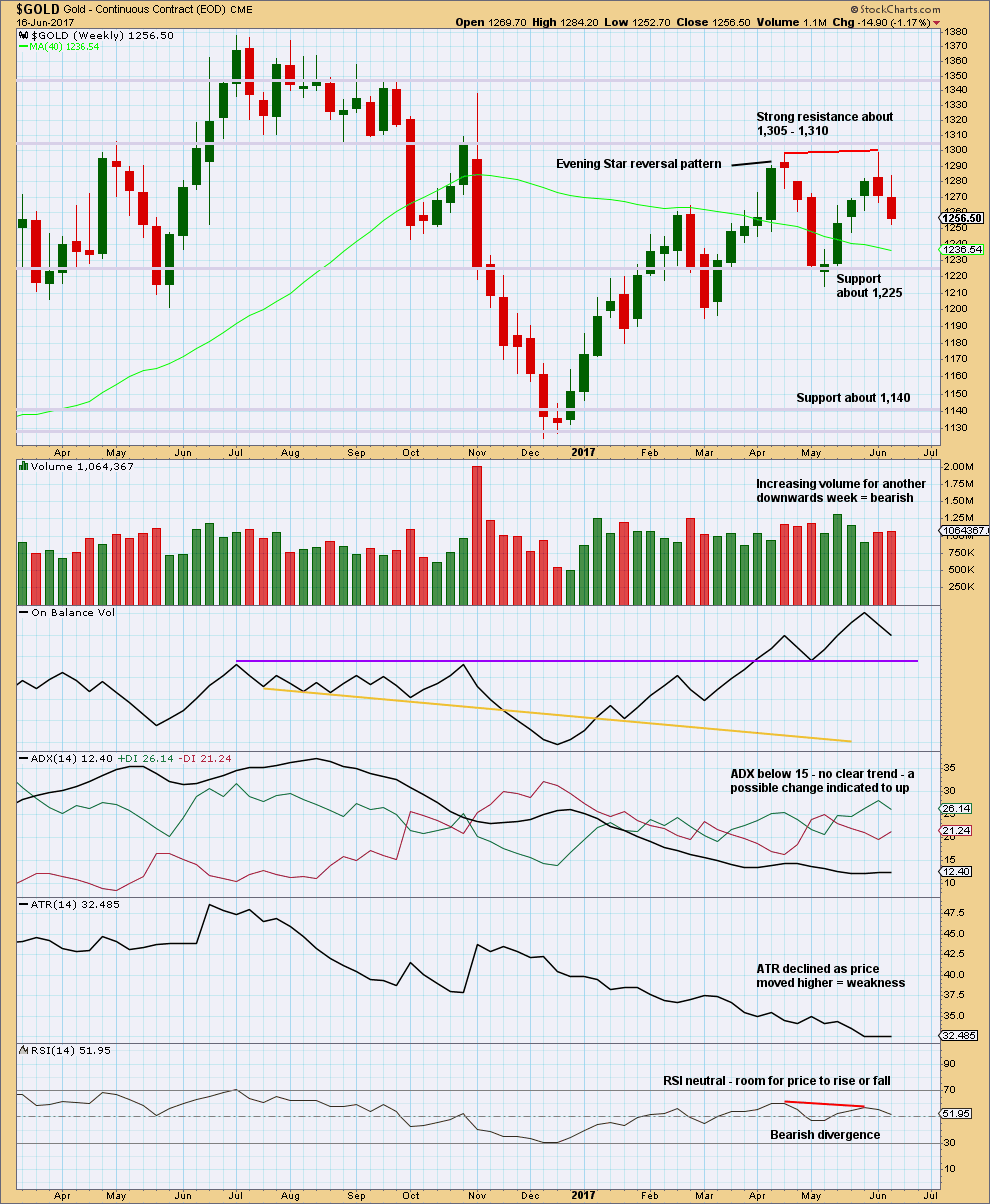
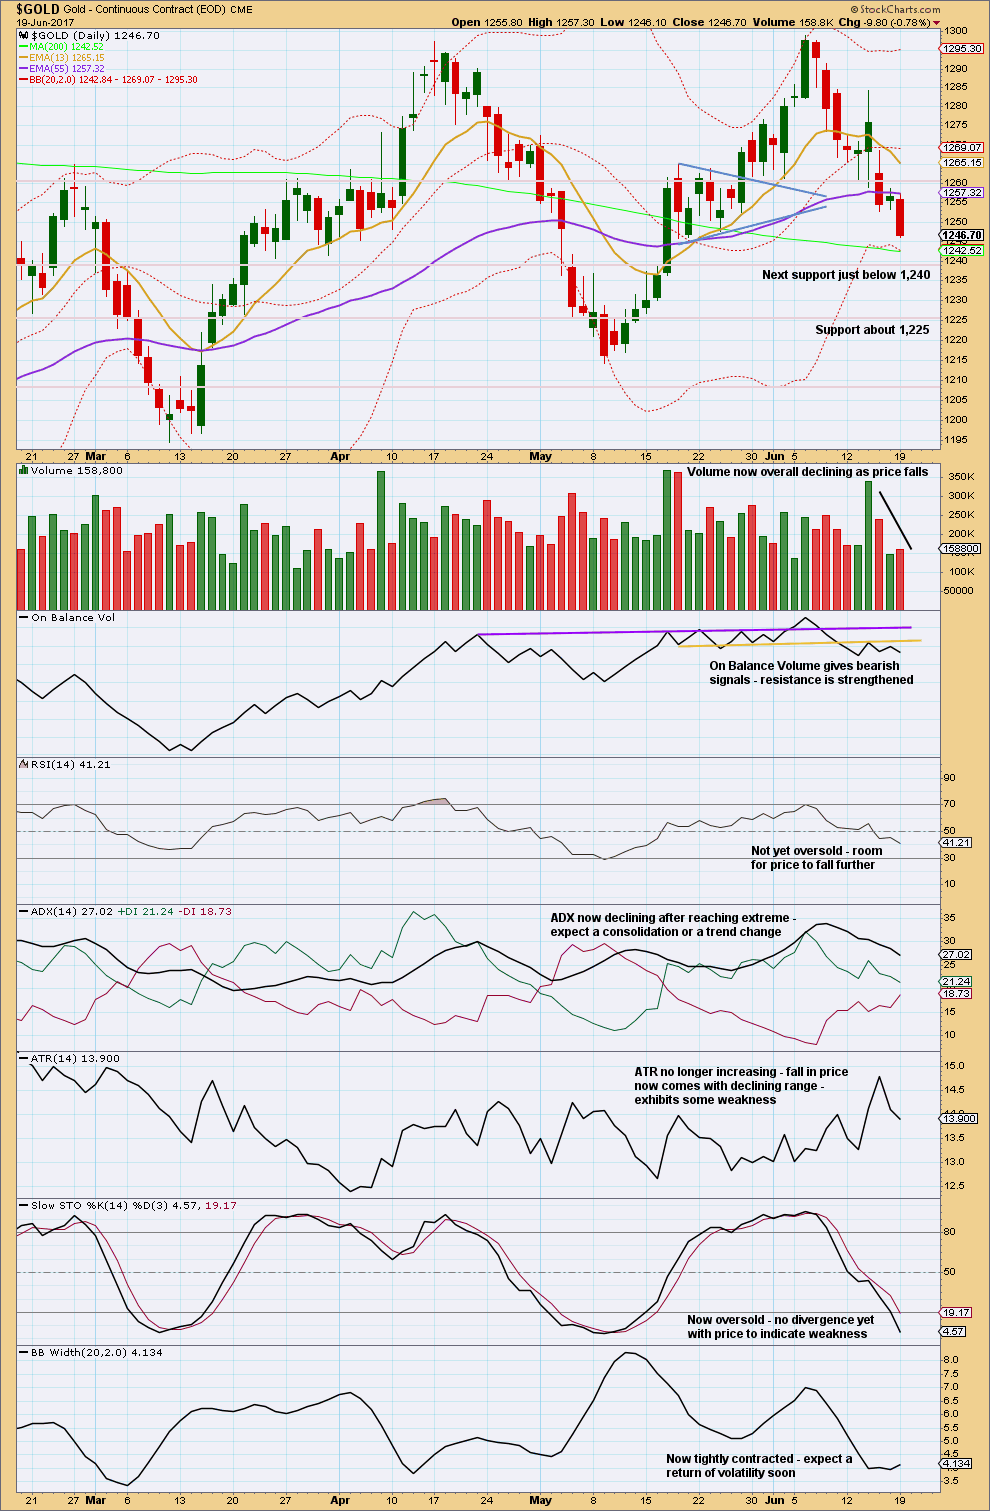
The long upper wicks on the last two weekly candlesticks are bearish. Volume supports the downwards movement in price, so this is not suspicious.
Declining ATR fits with the Elliott wave count at the weekly chart level; this is normal for triangles.
DAILY CHART
Click chart to enlarge. Chart courtesy of StockCharts.com.
Next support is just below 1,240, which aligns reasonably well with the Elliott wave target at 1,235.
Volume is slightly increased for Monday’s downwards day and On Balance Volume gives another bearish signal. Overall, volume is now declining and the fall may end soon when price finds good support. The 200 day moving average is now close by.
This chart is still bearish, but the fall in price is now showing some small weakness. Expect price to keep falling but look out for a bounce soon.
GDX
DAILY CHART
Click chart to enlarge. Chart courtesy of StockCharts.com.
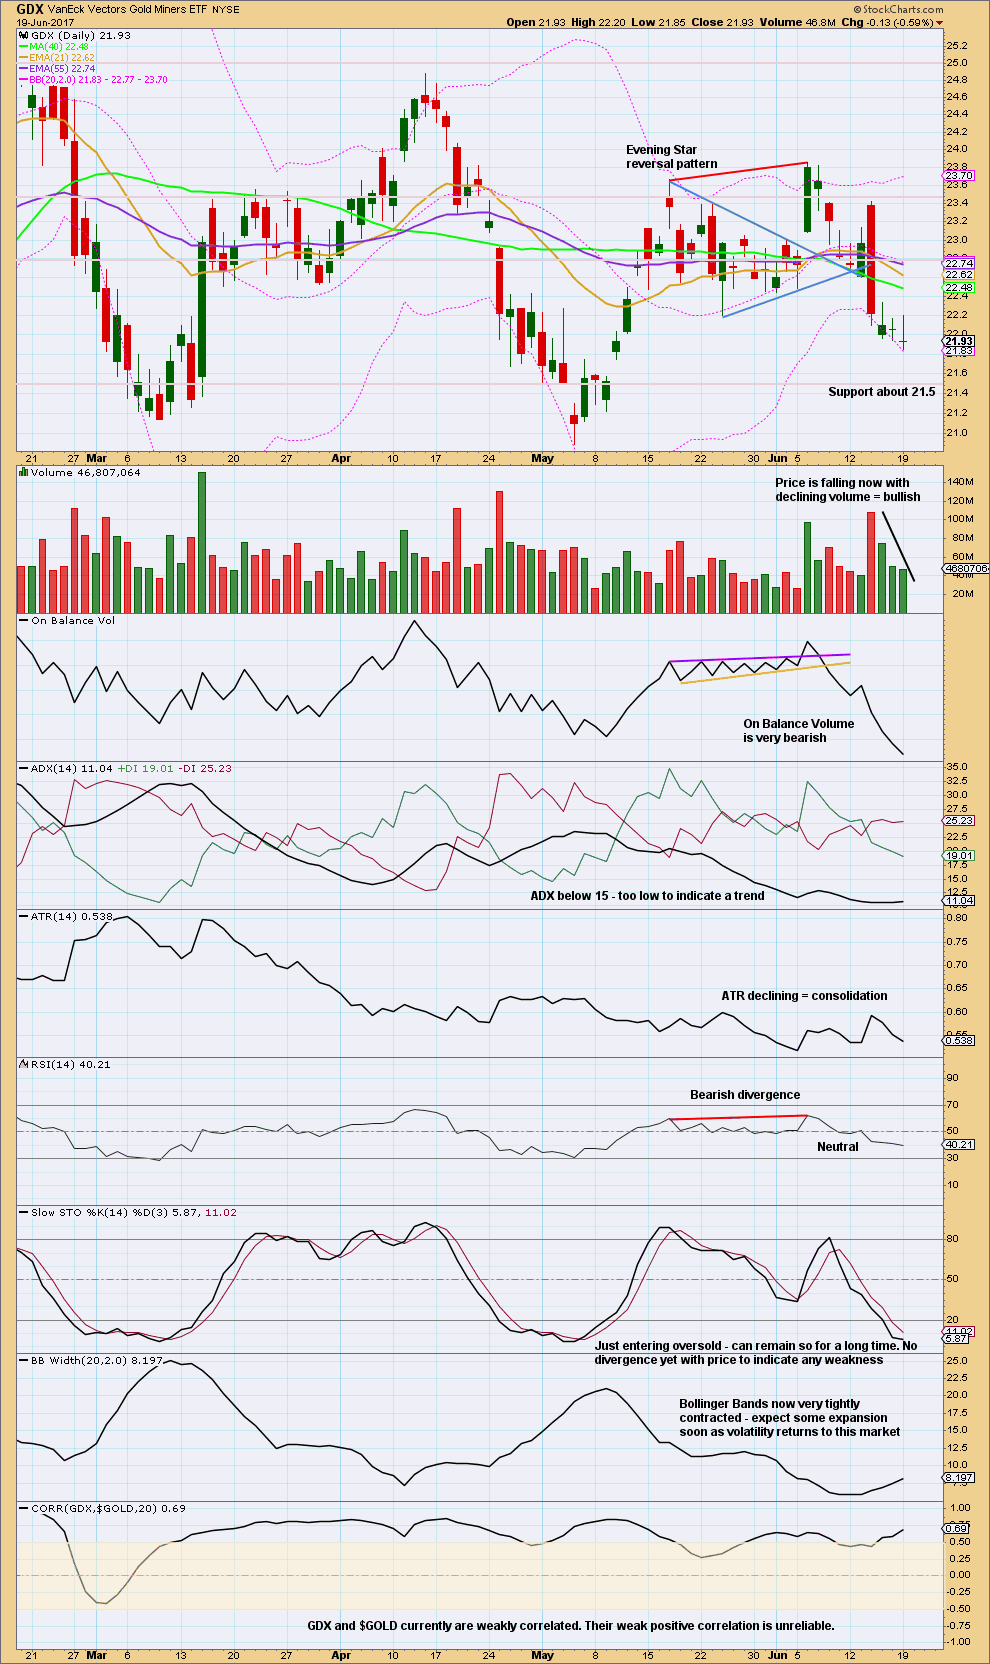
GDX keeps falling. Look now for support about 21.5. Downwards movement is showing some weakness but may not be done yet. There is no divergence with price and Stochastics, and RSI is not yet oversold.
This analysis is published @ 07:43 p.m. EST.
I’m not so happy with the disproportion between minute waves ii and iv now. But I don’t think this new low today is part of intermediate (B), that just looks worse.
For now this is what I have. It may change.
Bottom line, the target is still… well, on target.
I’m happy to be out and have banked profit for now. I’ll wait and see what happens next. What I won’t be doing is entering long while price is falling. Trading against a trend is a sure way to wipe out your account. Don’t do it.
I suspect Gold will do the same thing oil did today- end with a sharp move down before reversing.
GLD closed slightly below its 200 dmsa. I was looking for a sharp bounce and that did not happen. This increases the odds that we are going to slip beneath in before we see a reversal. If we put in a big red candle below it that would be uber bearish.
Dreamer, I am hoping you will be sharing your update and thoughts on GDX count. I want to be sure the 20.89 invalidation point is off the table before adding to this . Will you keep us in-the-know as soon as something pivotal occurs? Also, is GDXJ in a similar count do you know? Thank you for your help. Looking forward to your next post.
Thank you Alan for the timing of your work; I understood you this a.m. regarding the scenario two. Your information is most helpful. (and reassuring). I see we’ve had the drop to 1241 area but I am deciding to wait a bit, making sure GDX invalidation point 20.89 is OFF the table. And inquire of Dreamer of course for his excellent work. Happy Day to you. 😉
GLD 200 d sma providing support. I think a short term bounce is in order. Next move down should breach it as SLV already has.
With a drop below the low of 1242.89, it looks like my Scenario Two is correct. Minute 4 had corrected up to 1247.77 which is less than 0.382 Fib. (The other possibility is that Minute 4 morphs into a combination expanded flat). Let’s see how it works out. I exited my shorts at 1241.68 but prices would still go lower. That was only the third wave of C. Current low target = 1240.29 or 1239.19.
Apologies. Typo.
“Third wave of C” should read “Third wave of Minute 5”.
Sorry folks, my errand took a bit longer than I envisaged. Yes, so much has transpired within the space of six hours since my Technical Analysis. I’m glad I’m doing the Ichimoku now. It does appear that the price action followed my premonition yesterday at 11:01 am that “if Minor 5 = 0.618 * Minor 3, then Minor 5 would target 1240.28. (sic)”.
=========================
Ichimoku Gold Daily Analysis
Data as at 6:59 am June 19
=========================
Gold price has dropped below the bottom cloud boundary at 1245.30. This point has prevailed since May 23. On the Daily Chart, it can be observed that the cloud bottom has now dropped to 1241.38, which would be the target for tomorrow (June 21).
The Ichimoku Chart shows that the trend is still bullish, only barely just, with the tenkan-sen lying barely above the kijun-sen. Gold price is decidedly below both the tenkan-sen and the kijun-sen which means that the bear pressure is still strong. The technical analysis picture, which I have posted earlier today, greatly favours the bear trend. My inference is that the current price rise is just a correction to the bear trend, and not the start of a new bullish trend.
I can see two ways of looking at this price action. The breach of the best fit channel points to Minor 5, and hence Intermediate A, being completed. It implies therefore that Intermediate B is underway. If Intermediate B = 0.618 * Intermediate A, then the target would be 1275.50, which brings us back to a previous resistance cluster. Overhead resistance at the moment is 1263.31 kijun-sen, and 1265.76 tenkan-sen.
The other possibility is that we have completed only Minute 3 at today’s low of 1242.89, ignoring the channel breach. The price rise will be small. This is because Minute 2 was a very deep correction, and so, Minute 4 should be shallow. The possible targets are 1248.19 (0.382 Fib) or 1251.47 (0.618 Fib). It cannot go into Wave 1 territory above 1253.92. Absolute invalidation point is 1257.12, where Minor 5 began. If this is correct, a small drop in Minute 5 towards the bottom cloud support at 1241.38 would subsequently take place. This would be followed by Intermediate B. This sequence of events follows the Ichimoku script to the letter.
However, nothing in trading is cast in stone, and so both scenarios are possible. The first scenario is confirmed at 1257.12, the invalidation point of the second. My trade entry today, for a long, would be the first dip after 1257.12 is breached. But, if the second scenario is correct, then I will enter long at the low of Minute 5. Happy trading, folks.
Alan
While you are away find gold cloud chart below.
Thanks Papudi. I didn’t want to use StockCharts because they have not updated their chart yet. The chart is not accurate as at market close.
For those of you that have followed the GDXJ holdings issue over the last few months, it appears that the rebalancing is now complete. In a nutshell, GDXJ had grown too big and was forced to buy too big of a % of miners that met it’s size requirements. To solve this, GDXJ changed its prospectus so that it could buy miners more in the “medium” size based on capitalization.
This all appeared to feed into the social mood and became the “reason” for the hard sell off over the last few months. Looking forward, we should now expect GDXJ to once again outperform GDX.
Here’s the current holdings of GDXJ for those interested:
https://www.vaneck.com/etf/equity/gdxj/holdings/
The best fit channel has just been breached by upward movement. Perhaps it is time to go long…
My channel still holds and has room.
Yes, the channel is breached. I’m closing my shorts and standing aside.
The bears have been emboldened by a token resistance to the hawkish tone of the Fed being delivered last week following their decision to raise interest rates, and especially with some details thrown in as to the manner in which the balance sheet would be reduced in the near future.
From a technical analysis standpoint, prices had fallen below the 50 day MA, and is heading towards longer term support at the 200 day coming in at 1242.56. If prices break below this, the classical inference is that a bear market ensues. A test of the May 9 low at 1214.80 would be on the cards. Momentum had turned negative as MACD generated a crossover sell signal the day before the Fed release. The MACD histogram is showing a downward sloping trajectory which points to lower price for gold. Also, the RSI broke down moving lower with price action which reflects accelerating negative momentum.
The near-term price action and possible targets, which of course all of us day traders are most concerned with, unfortunately cannot be gleaned from this technical analysis. It just paints the overall picture. I will have to use Ichimoku to deal with it. However, I’ll have to do so in a separate post as StockCharts had not updated their charts to reflect the position at the close yesterday. The Ichimoku analysis will be posted by 7 am ET latest as I have an errand to run. Moreover, a update later on in the day would include more recent price information, and hence better reflect the market position. Your indulgence is much appreciated.
Thank you Alan. Your contribution is much appreciated 🙂