
Further downwards movement was expected from the Elliott wave count. The target remains the same.
Summary: Downwards movement may be over for the short term. Confidence in this view may be had if price moves into the upper half of the Elliott channel on the hourly chart. If a bounce has just begun, then it may end about 1,262 or 1,275.
Accept it is possible price may move lower while it remains in the lower half of the Elliott channel. The limit is at 1,229.88.
New updates to this analysis are in bold.
Last monthly charts and alternate weekly charts are here, video is here.
Grand SuperCycle analysis is here.
WEEKLY CHART I
Click chart to enlarge.
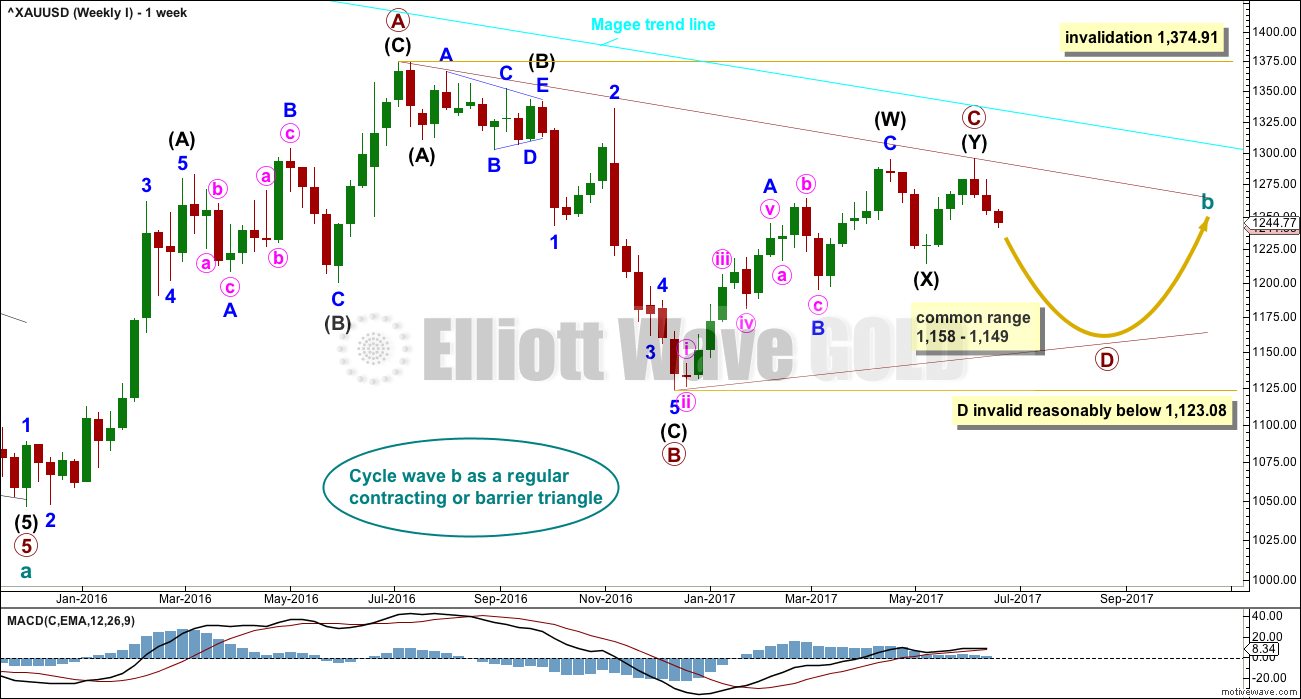
The Magee bear market trend line is added to the weekly charts. This cyan line is drawn from the all time high for Gold on the 6th of September, 2011, to the first major swing high within the following bear market on the 5th of October, 2012. This line should provide strong resistance.
At this stage, a triangle still looks most likely and has the best fit for cycle wave b.
Within a triangle, one sub-wave should be a more complicated multiple, which may be primary wave C. Primary wave C may not move beyond the end of primary wave A above 1,374.91. This invalidation point is black and white.
At this stage, it looks like primary wave C is now complete at the hourly and daily chart level. However, at the weekly chart level, it looks possible it may continue higher. This possibility must be acknowledged while price remains above 1,214.81. Within intermediate wave (Y), minor wave B may not move beyond the start of minor wave A.
Primary wave D of a contracting triangle may not move beyond the end of primary wave B below 1,123.08. Contracting triangles are the most common variety.
Primary wave D of a barrier triangle should end about the same level as primary wave B at 1,123.08, so that the B-D trend line remains essentially flat. This involves some subjectivity; price may move slightly below 1,123.08 and the triangle wave count may remain valid. This is the only Elliott wave rule which is not black and white.
Primary wave C may end when price comes up to touch the Magee trend line.
There are three alternate wave counts that have been published in the last historic analysis, which is linked to above. They are all very bullish. Members may like to review them at this stage. They will only be published on a daily basis if price shows them to be true with a new high now above 1,295.65.
DAILY CHART
Click chart to enlarge.
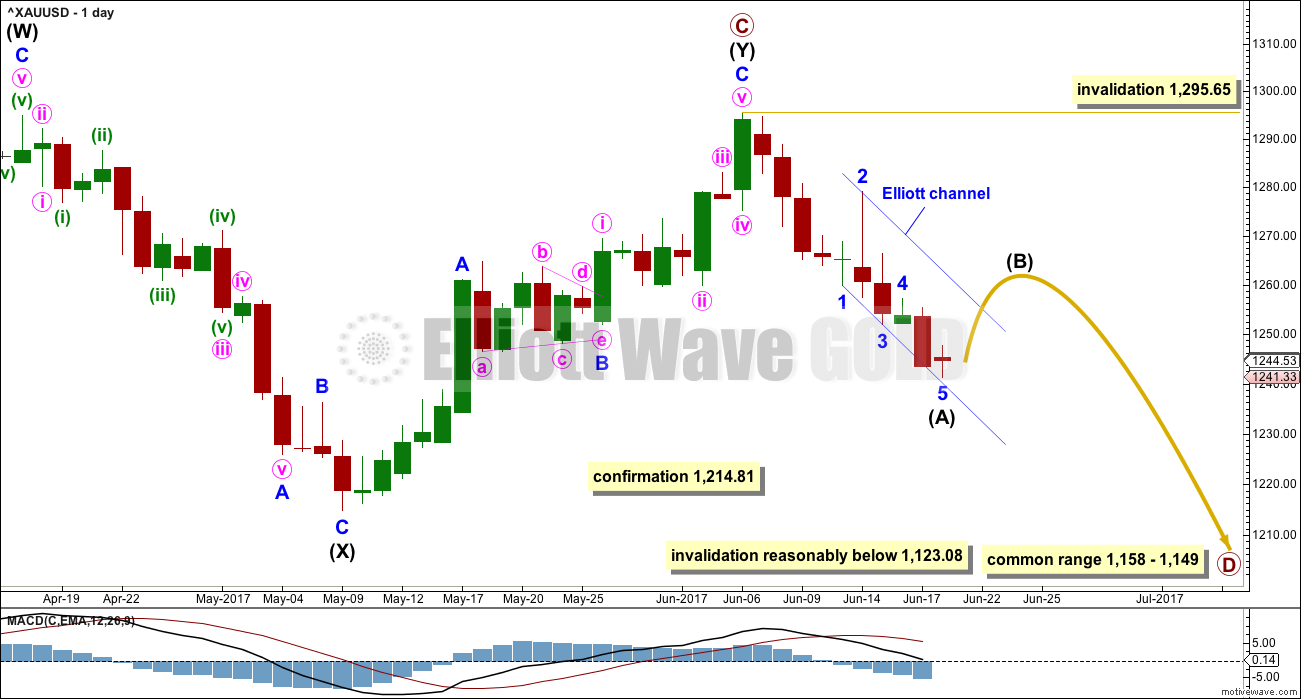
Intermediate wave (Y) may now be a complete zigzag if it is accepted that a triangle completed in the position labelled minor wave B. This has a perfect fit on the hourly chart.
A new low below 1,214.81 could not be minor wave B within intermediate wave (Y) and would provide strong confirmation that intermediate wave (Y) is over.
A common range for triangle sub-waves is from about 0.8 to 0.85 the prior sub-wave, this gives a range for primary wave D from 1,158 to 1,149.
If primary wave C is correctly labelled as a double zigzag, then primary wave D must be a simple A-B-C structure and would most likely be a zigzag. Within primary wave D, minor wave B may not move beyond the start of minor wave A above 1,295.64.
At the hourly chart level, intermediate wave (A) may now be complete. However, this view requires some upwards movement from price before confidence may be had in it. If intermediate wave (A) is over, then it would have lasted 10 days (not a Fibonacci number). For the wave count to have the right look intermediate wave (B) may be at least even in duration with intermediate wave (A).
Intermediate wave (B) may be any one of more than 23 possible corrective structures. It may be a swift sharp zigzag with a strong upwards slope, or it may be a shallow sideways complicated combination, triangle or flat. It is impossible until it is almost complete to know with confidence what structure it has taken. B waves exhibit the greatest variety in price behaviour and structure, so they do not present good trading opportunities.
Only the most experienced of traders should attempt to trade B waves, even at intermediate degree. If members choose to attempt to trade intermediate wave (B) upwards, it is my strong advice to reduce risk to only 1-3% of equity. It is essential that stops are always used.
Primary wave A lasted 31 weeks, primary wave B lasted 23 weeks, and primary wave C may have been complete in 25 weeks.
Primary wave D should be expected to last at least 8 weeks (but most likely longer). The next Fibonacci ratio in the sequence would be a Fibonacci 13 and then 21.
HOURLY CHART
Click chart to enlarge.
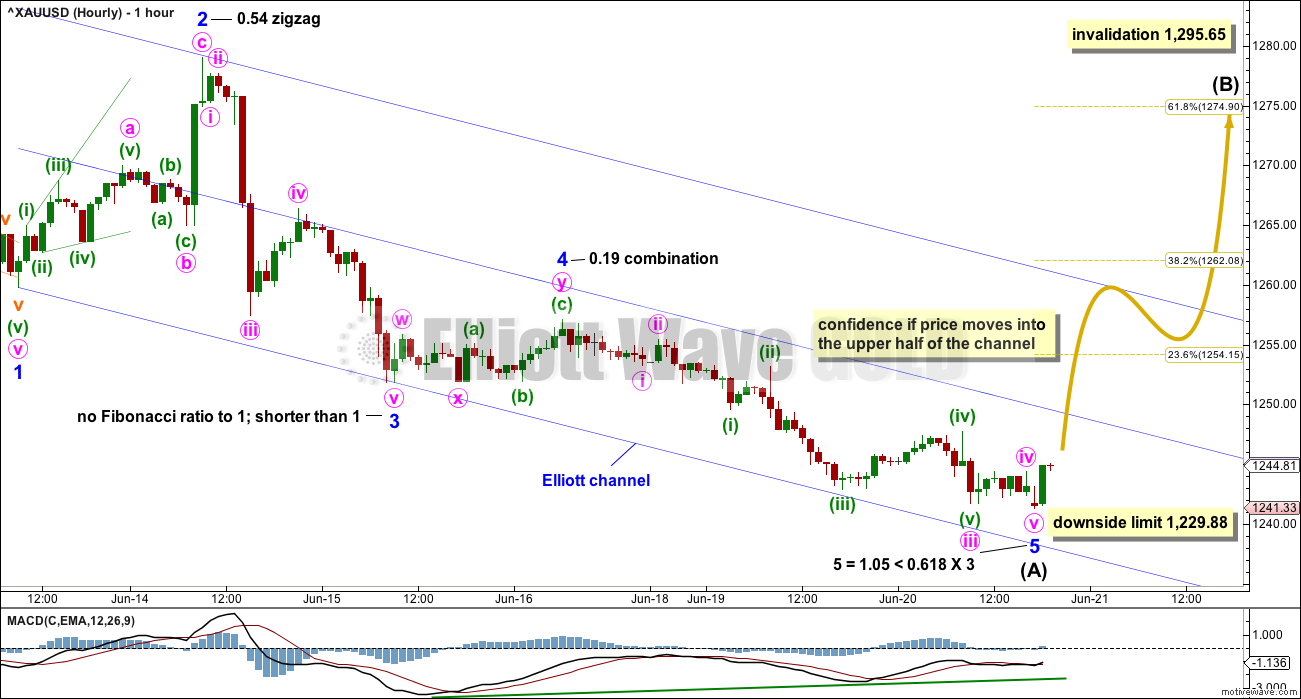
Minor wave 3 was shorter than minor wave 1. This limits minor wave 5 to no longer than equality in length with minor wave 3, so that minor wave 3 is not the shortest actionary wave within the impulse. This limit is at 1,229.88.
There is perfect alternation between the deep zigzag of minor wave 2 and the shallow combination of minor wave 4.
Minor wave 5 may have ended with a Fibonacci ratio to minor wave 3 and not minor wave 1, which was expected. The bullish engulfing candlestick pattern at the low offers a very small support to this view.
Because minor wave 5 sat within the lower half of the Elliott channel, if price returns to the upper half of the channel that would be a strong indication that minor wave 5 may be over. A breach of the upper edge of the channel may be taken as confirmation of a trend change.
Intermediate wave (B) may end about either the 0.382 or 0.618 Fibonacci ratios of intermediate wave (A). Neither is favoured; they have an even probability.
TECHNICAL ANALYSIS
WEEKLY CHART
Click chart to enlarge. Chart courtesy of StockCharts.com.
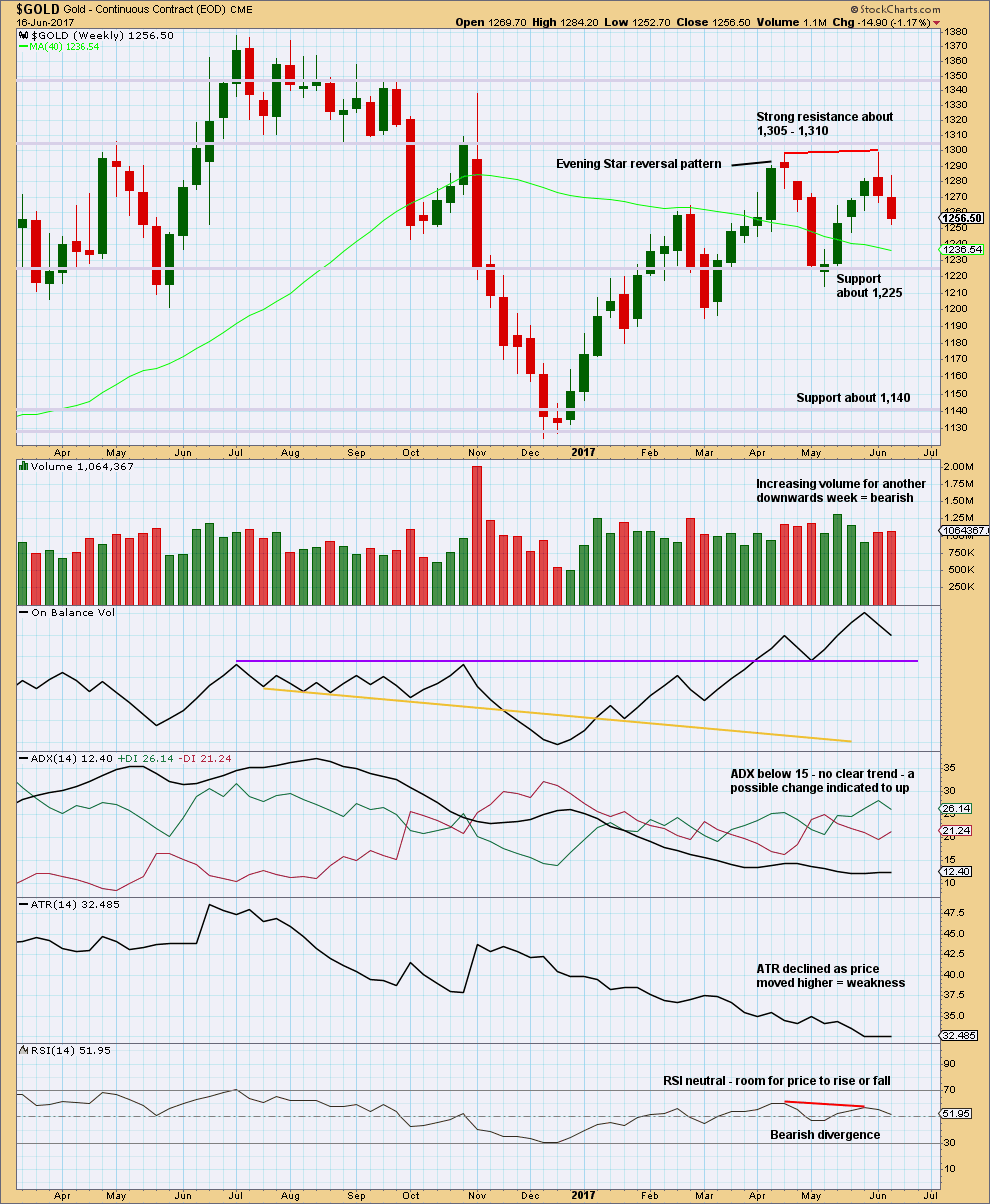
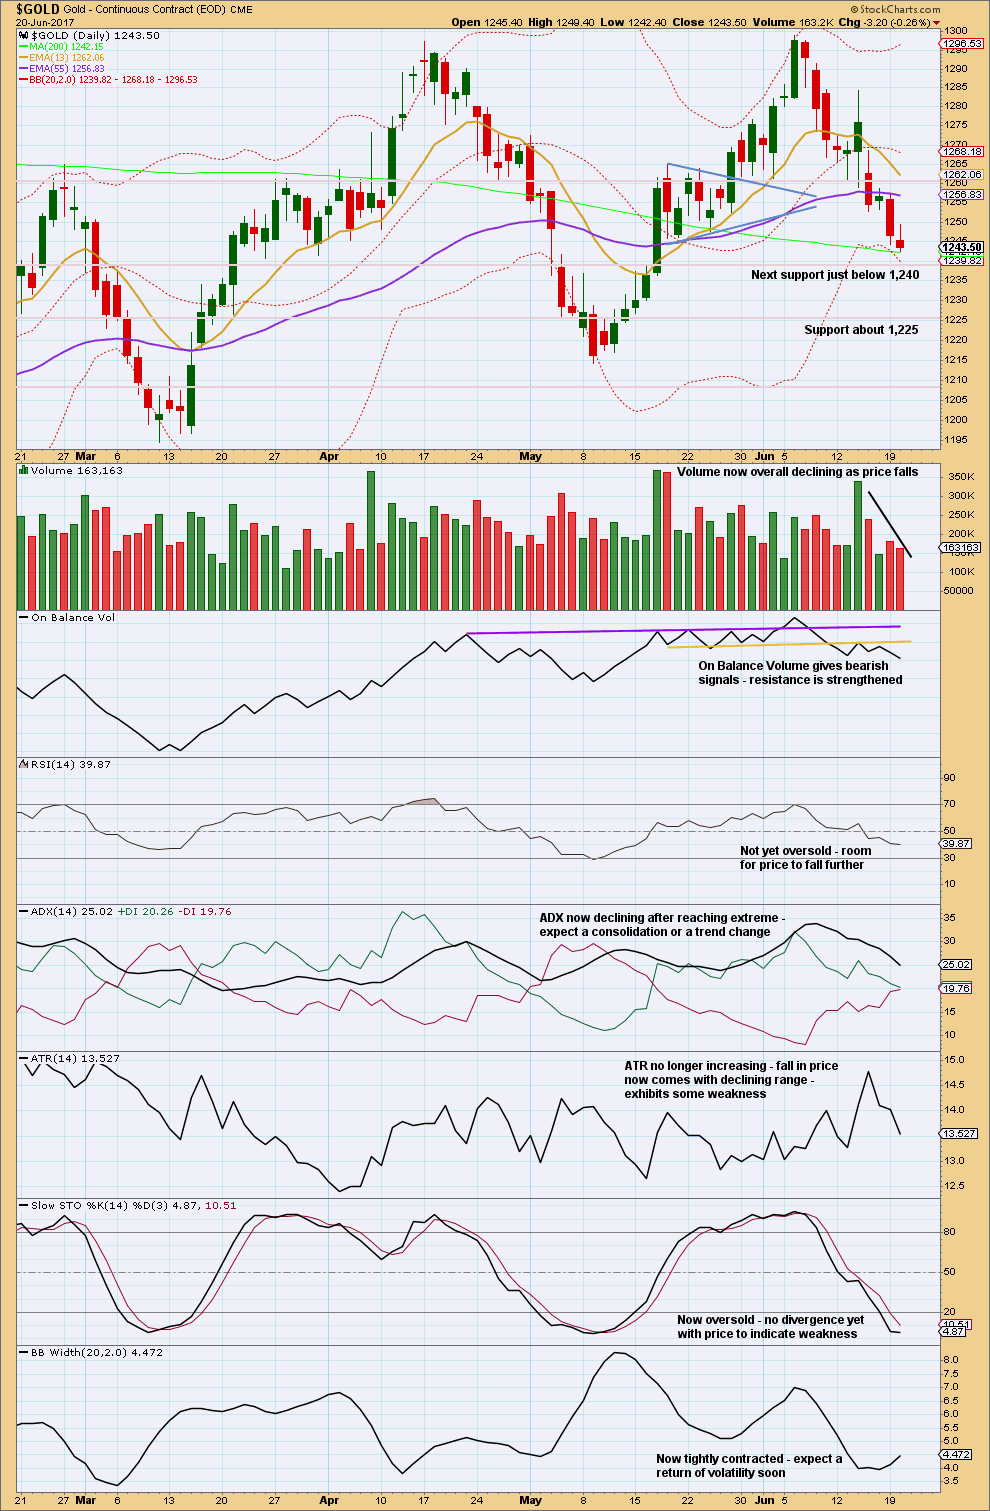
The long upper wicks on the last two weekly candlesticks are bearish. Volume supports the downwards movement in price, so this is not suspicious.
Declining ATR fits with the Elliott wave count at the weekly chart level; this is normal for triangles.
DAILY CHART
Click chart to enlarge. Chart courtesy of StockCharts.com.
A small range day with lighter volume finds strong support at the 200 day moving average. It would be reasonable to expect some bounce about here. This supports the hourly Elliott wave count.
Resistance is about 1,260.
There is room for price to keep falling. RSI is not extreme and Stochastics does not exhibit divergence with price.
GDX
DAILY CHART
Click chart to enlarge. Chart courtesy of StockCharts.com.
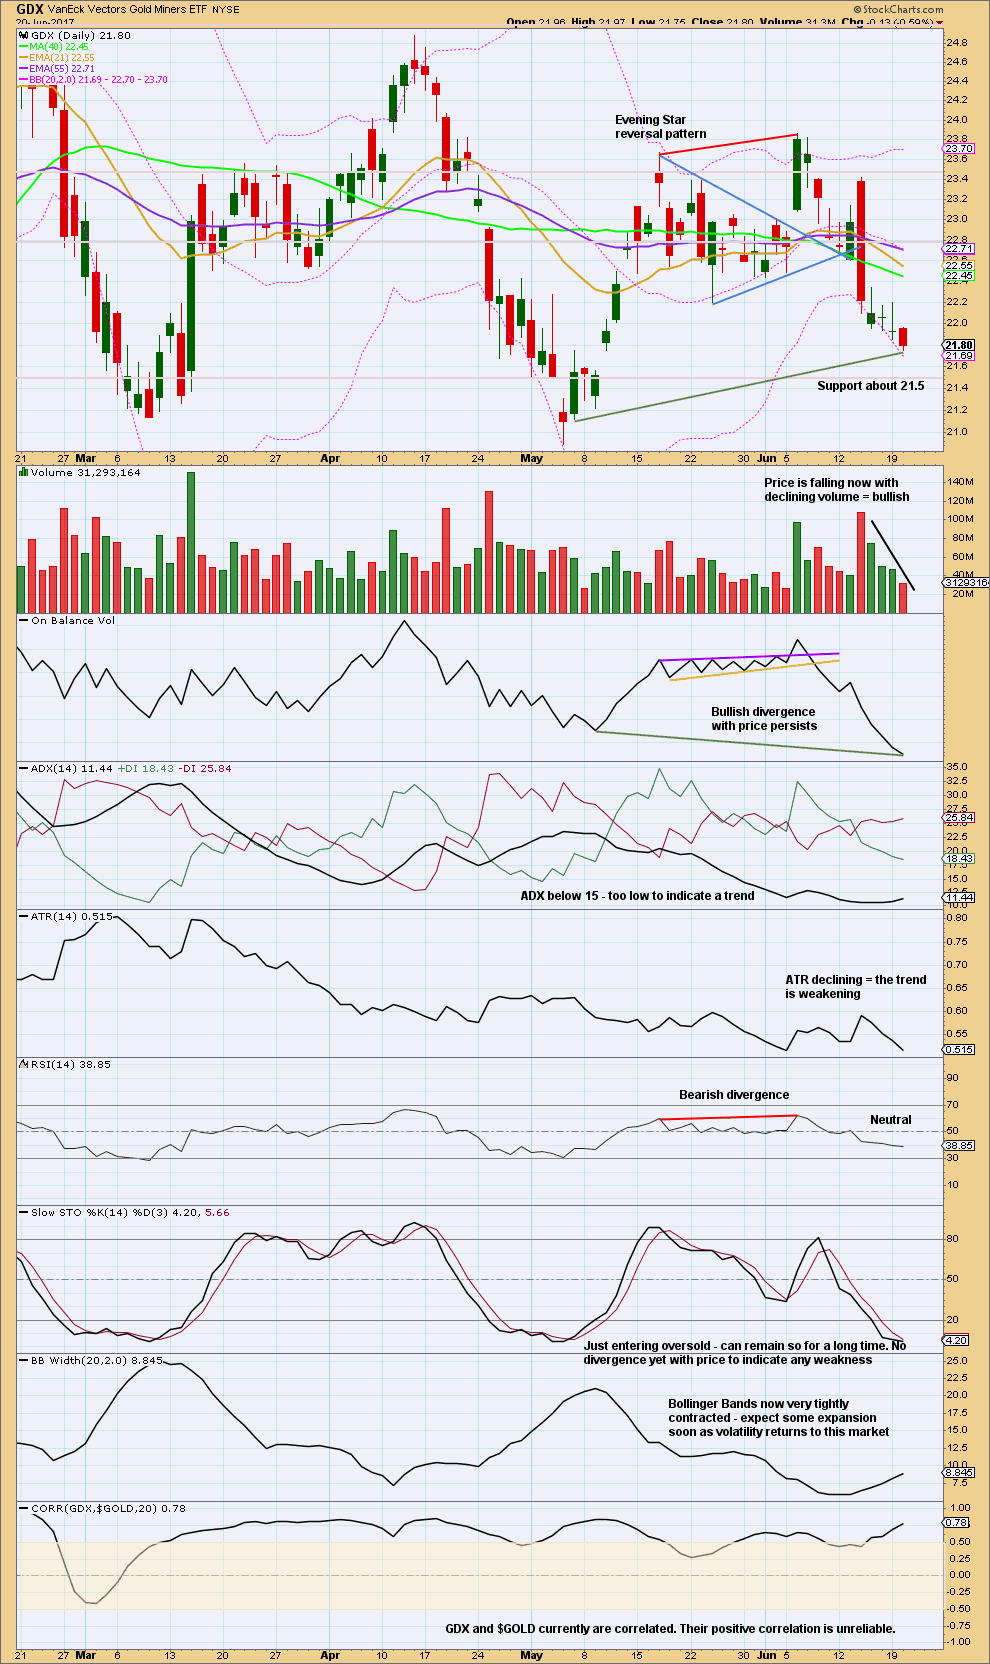
Bullish divergence between price and On Balance Volume has persisted for two days. This does not mean price must stop falling here. It only indicates some weakness in downwards movement.
ATR also signals increasing weakness. Volume indicates the market is falling of its own weight.
Look out now for a bounce in GDX here or very soon.
This analysis is published @ 08:16 p.m. EST.
Hourly chart updated:
No change.
See the new alternate idea from Alan below.
Ichimoku Gold Hourly Analysis
Data as at 5:45 am ET June 21
=========================
Given that gold had dropped to the bottom cloud boundary at 1241.33, where the 200 day SMA also resides, at least a short-term bounce to test the important 1260-1270 resistance should be on the cards.
The Hourly Ichimoku Chart shows that gold remains in a bearish trend. The cloud is red. However, prices are attempting a bullish reversal. Tenkan-sen had made a positive crossover of the kijun-sen five hours ago, and price is trying to enter the cloud. If prices can break above the cloud at 1249.87, then a bigger upward reversal is in the offing. But, if prices get rejected by the cloud, then I’m afraid the bleak scenario I have alluded to in today’s Daily Analysis, that prices would fall, targeting a test of the uptrend line, will come to pass.
To a trader, the worst scenario is one of uncertainty. That’s when it is most difficult to make any money. So, let’s hope that this impasse dies down quickly and gold moves with conviction either up or down. Today being the estival solstice, let not the events turn out to be a comedy of errors as in Shakespeare’s Midsummer’s Night Dream. Let’s ban Puck for today.
Ichimoku Gold Daily Analysis
Data as at 3:15 am ET June 21
=========================
Having reached a low of 1241.68 pre-market, gold initially tried to rally but fell and reached down to a lower low of 1241.33. This is very very close to the cloud bottom at 1241.38, as well as the 200 day SMA. After the US market closed, prices bounced as a result.
The Daily Ichimoku Chart presents a neutral picture. Price is sitting right smack at the bottom cloud boundary. Tenkan-sen had made a bearish crossover with kijun-sen, alerting lower prices to come. The saving grace is that the near-future cloud shows green. The bounce after market close can either be a correction to the strong downtrend, sort of like a dead cat bounce before prices resume falling a little bit lower, or it can be a harbinger of a trend change.
Taking a look outside Ichimoku for hints of the near future price action, I observe that MACD histogram is still sloping downwards, favouring a continued price drop. Gold price is still some distance from SMA 50, which continues to exert negative pressure on it. Fundamentally, the market is continuing to grapple with the idea of the Fed raising interest rates a couple of times over the next year as well as the announced reduction of their balance sheet, and that of course works against the value of gold in general.
The way I look at the market, the lack of juicy geopolitical headlines, the downing of the Syrian jet notwithstanding, means that there is no urgency for gold price to rise. Short-sellers continue to drive the market forward while longer-term traders are waiting in the wings nibbling at value. At the moment, I don’t feel comfortable entering the market either way. As long as gold trades below the last high of 1253.17, prices can continue sideways. If prices do drop past the low at 1241.33, a lower low is favoured, targeting a test of the uptrend line shown in my Weekend Analysis, and which resides near Lara’s 1235 price point. Perhaps, the situation may become clearer further in the day.
Lara.
Is it possible that Minute 3 ended only where you have located Minor 5 and hence Intermediate A?
If so, then the price rise is only Minute 4, and there is one more low targeting 1235.
I think that is a real possibility. The precious metals, like oil, tend to end their trends with sharp spikes followed by reversals and I still expect Gold to spike down before a bounce begins.
Like this? Yes, possible. Except the end of minor 3 would have an uncharacteristic weakness, looking at MACD.
I’ll publish it as an alternate.
It gives us a nice price point at 1,259 to tell what’s happening; if the correction remains below that point and then price turns lower, this alternate would be correct.
The main count would see price move above 1,259
NZDUSD is looking like it may have potentially have had a trend change…. I’ll open a short position here with a stop just above the high.
That long upper wick on the candlestick for the 19th June is really bearish.
Green shows GDXJ strength vs GDX [Bullish] and Red shows the weakness [Bearish]
dsprospering,
Looking at GDXJ, it also looks like there are a couple of triangle options. While GDXJ was very weak compared to GDX, it has once again been stronger than GDX since the beginning of June. This is a slight bullish signal.
https://www.tradingview.com/x/UUnJdRbz/
Thank you Dreamer.
I do not know where you are located, but where I am, the summer heat is hitting over 100 degrees today with tomorrow projected worse. — I am sweating things out in more ways than one without A/C! Cheers 🙂
I think it was about 103 today in the suburbs north of Los Angeles. Yes, very warm indeed!
Hello neighbor (in malibu)! Not quite that warm here but inland is intense I hear.
Nice Joey… love those cool ocean breezes. We get down there every once in a while for a good meal – Paradise cove, Malibu seafood, Ollo, Dukes, Geoffrey’s
Welcome to summer (BTW, today is summer solstice).
In Singapore, we have perennial summer. Our seasons are hot, hotter, hottest, and wet, wetter, wettest. Temperatures in the 90s are an everyday affair, but out in the open where there are no trees, it can go up to the 100s. Worse still, except for the monsoon months, we hardly have any wind. So, hot days are a norm. We’d be happy if there is no haze. These blow over from Indonesia where there is rampant indiscriminate clearing of the forests by setting fire to them; they use kerosene for the job. Poor forest animals, rendered homeless!
New Zealand may be the best place to be right now, cool weather.
🙂 Here in Northland it’s only cool, not really cold. About 16 celsius, which is about 60 fahrenheit. It can get cold in the early morning.
It’s really windy and a bit stormy, the Pacific now thinks it’s a washing machine. Now for the wind to switch offshore and give me some waves….
We don’t have cold winters where I live. Summer gets somewhat hot, but not too bad. Overall pretty good really!
Now where my sister lives in Dunedin in the deep south, that’s another story. Freezing.
I wish that I could be more confident in GDX breaking out to the upside, but with this bear count valid, caution is still advised. That said, at minimum, a bounce is expected here.
https://www.tradingview.com/x/QshA12u8/
The pause of GLD at the 200 dmsa I think is auspicious for the miners; at least in the short term. I think it will be an intermediate bounce though with further downside for the metals. I am expecting to see a low in metals co-incident with a high in equities. We will no doubt get an initial strong move to the upside as the markets begin to tank in the conventional flight to perceived safety. The mother of all margin calls that is coming when this bloated market implodes is going to force a lot of selling of anything of remaining value. Gold will not escape the ensuing deflationary fire-storm. For us long term bulls, it is going to be the buying opportunity of a life-time…
Looking at the Daily chart for the GDX Triangle Bull count shows that Primary wave E is right on the triangle trend line. A move up is expected now or very soon for this count.
The invalidation point remains at 20.89
https://www.tradingview.com/x/F7kHX8iQ/
My GDX Triangle Bull count is at the point where we should be looking for the triangle to be complete.
https://www.tradingview.com/x/5bFnbnl6/