Some upwards movement was expected from last analysis. An inside day neither fits expectations nor invalidates the Elliott wave count. A new alternate is provided today.
Summary: A new high above 1,259.75 would indicate a bounce to last about two weeks has begun. A new low below 1,241.33 would indicate downwards movement is not over yet; the first target for it to end is at 1,225.
While price remains below 1,259.75 and above 1,241.33, the balance of probability will still favour a bounce in its early stages.
New updates to this analysis are in bold.
Last monthly charts and alternate weekly charts are here, video is here.
Grand SuperCycle analysis is here.
WEEKLY CHART I
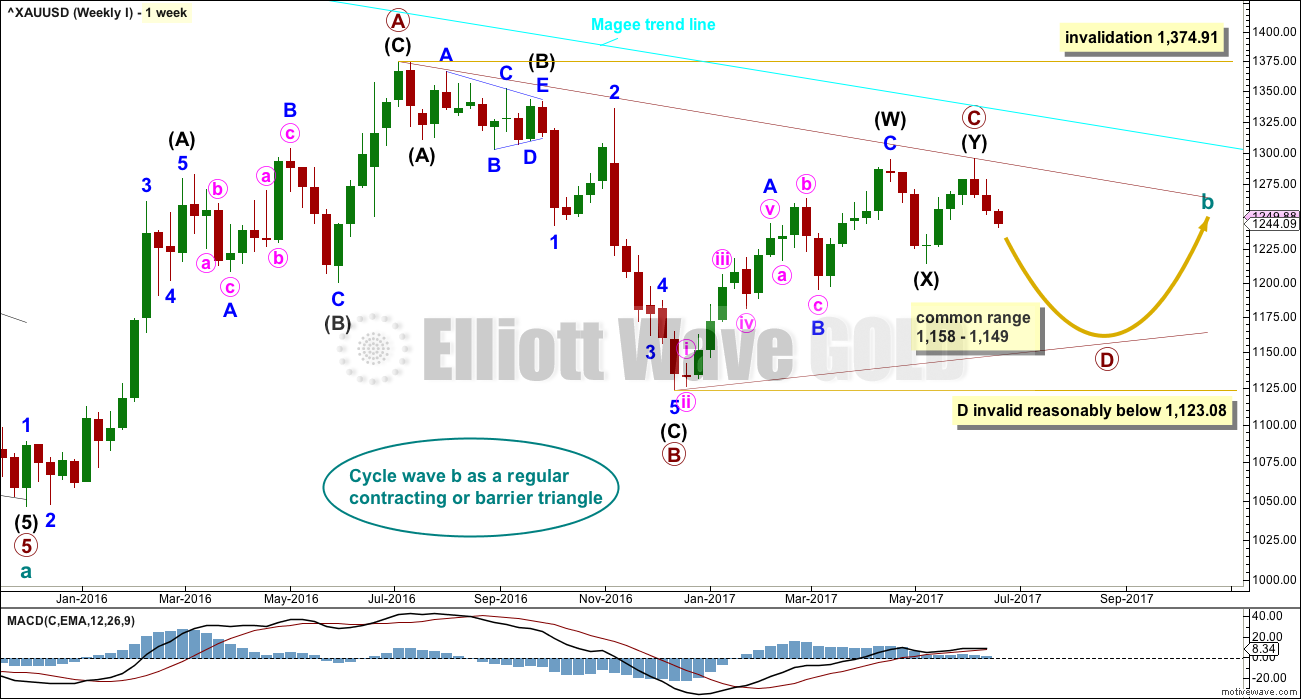
The Magee bear market trend line is added to the weekly charts. This cyan line is drawn from the all time high for Gold on the 6th of September, 2011, to the first major swing high within the following bear market on the 5th of October, 2012. This line should provide strong resistance.
At this stage, a triangle still looks most likely and has the best fit for cycle wave b.
Within a triangle, one sub-wave should be a more complicated multiple, which may be primary wave C. Primary wave C may not move beyond the end of primary wave A above 1,374.91. This invalidation point is black and white.
At this stage, it looks like primary wave C is now complete at the hourly and daily chart level. However, at the weekly chart level, it looks possible it may continue higher. This possibility must be acknowledged while price remains above 1,214.81. Within intermediate wave (Y), minor wave B may not move beyond the start of minor wave A.
Primary wave D of a contracting triangle may not move beyond the end of primary wave B below 1,123.08. Contracting triangles are the most common variety.
Primary wave D of a barrier triangle should end about the same level as primary wave B at 1,123.08, so that the B-D trend line remains essentially flat. This involves some subjectivity; price may move slightly below 1,123.08 and the triangle wave count may remain valid. This is the only Elliott wave rule which is not black and white.
Primary wave C may end when price comes up to touch the Magee trend line.
There are three alternate wave counts that have been published in the last historic analysis, which is linked to above. They are all very bullish. Members may like to review them at this stage. They will only be published on a daily basis if price shows them to be true with a new high now above 1,295.65.
DAILY CHART
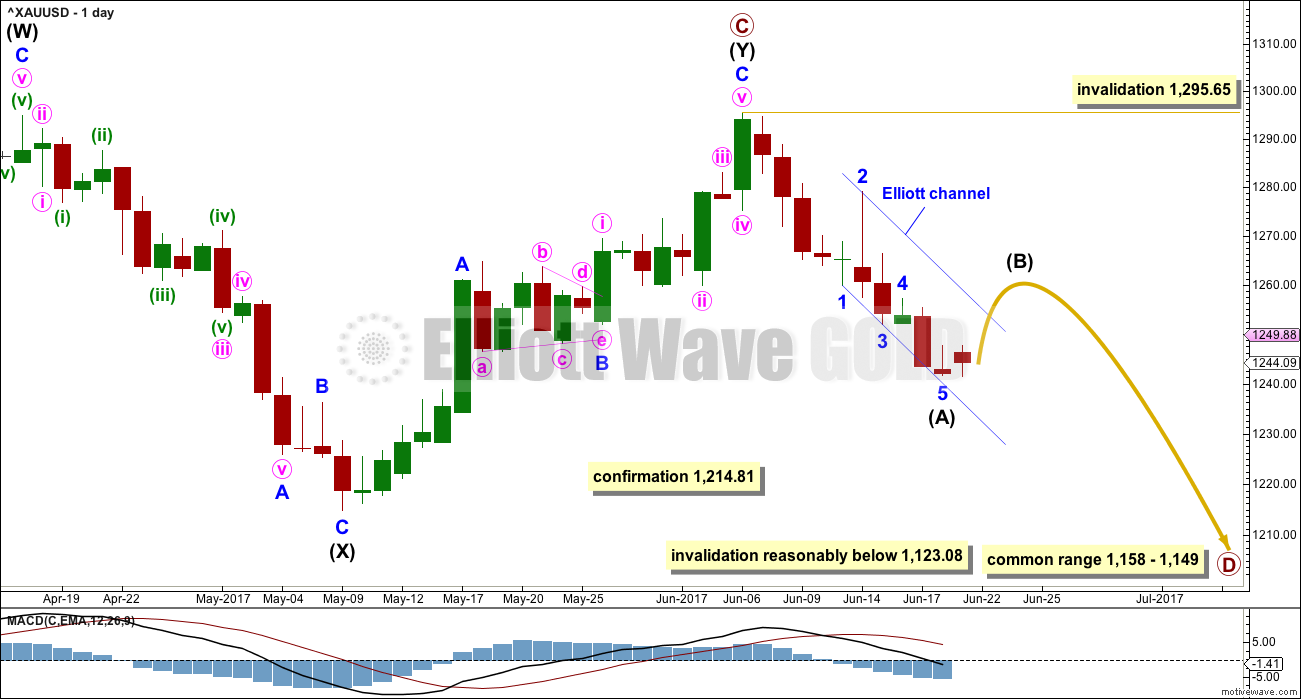
Intermediate wave (Y) may now be a complete zigzag if it is accepted that a triangle completed in the position labelled minor wave B. This has a perfect fit on the hourly chart.
A new low below 1,214.81 could not be minor wave B within intermediate wave (Y) and would provide strong confirmation that intermediate wave (Y) is over.
A common range for triangle sub-waves is from about 0.8 to 0.85 the prior sub-wave, this gives a range for primary wave D from 1,158 to 1,149.
If primary wave C is correctly labelled as a double zigzag, then primary wave D must be a simple A-B-C structure and would most likely be a zigzag. Within primary wave D, minor wave B may not move beyond the start of minor wave A above 1,295.64.
At the hourly chart level, intermediate wave (A) may now be complete. However, this view requires a new high above 1,259.75 now before confidence may be had in it. If intermediate wave (A) is over, then it would have lasted 10 days (not a Fibonacci number). For the wave count to have the right look intermediate wave (B) may be at least even in duration with intermediate wave (A).
Intermediate wave (B) may be any one of more than 23 possible corrective structures. It may be a swift sharp zigzag with a strong upwards slope, or it may be a shallow sideways complicated combination, triangle or flat. It is impossible until it is almost complete to know with confidence what structure it has taken. B waves exhibit the greatest variety in price behaviour and structure, so they do not present good trading opportunities.
Only the most experienced of traders should attempt to trade B waves, even at intermediate degree. If members choose to attempt to trade intermediate wave (B) upwards, it is my strong advice to reduce risk to only 1-3% of equity. It is essential that stops are always used.
Primary wave A lasted 31 weeks, primary wave B lasted 23 weeks, and primary wave C may have been complete in 25 weeks.
Primary wave D should be expected to last at least 8 weeks (but most likely longer). The next Fibonacci ratio in the sequence would be a Fibonacci 13 and then 21.
HOURLY CHART
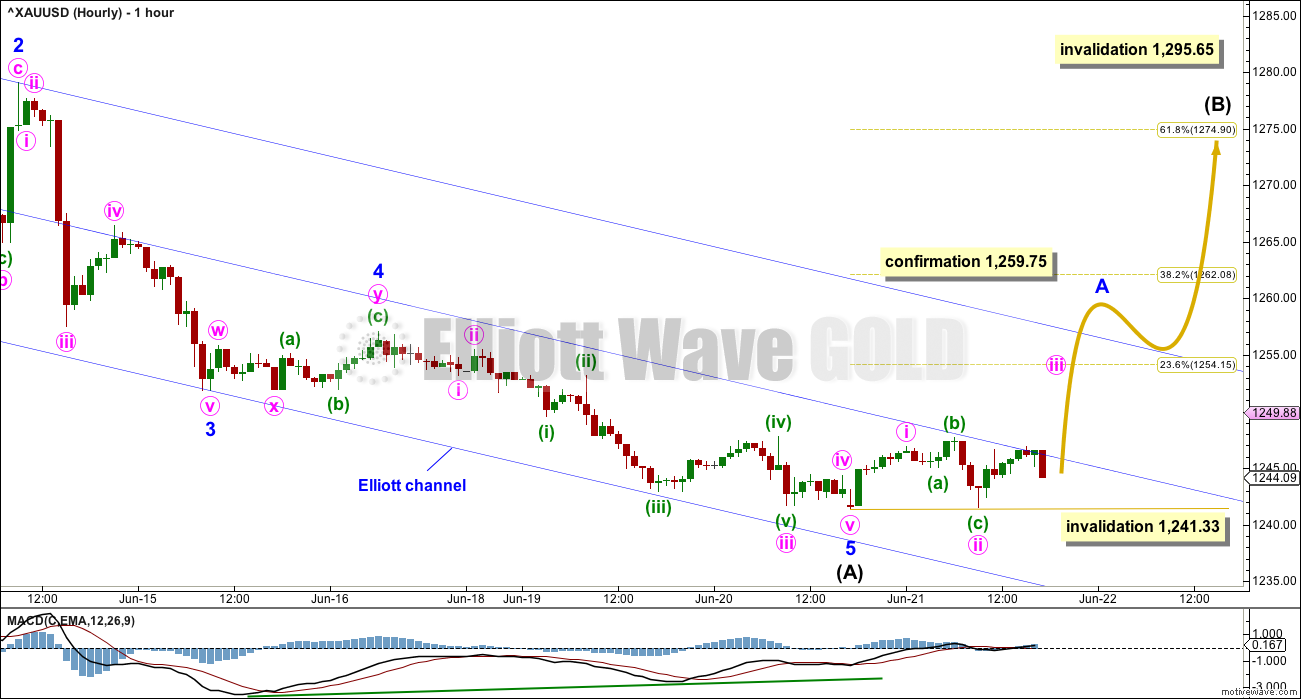
If intermediate wave (A) is complete, then a new wave up at intermediate degree should start with a five wave structure upwards on the hourly chart. This is incomplete. While it is unfolding no second wave correction may move beyond the start of its first wave below 1,241.33.
If intermediate wave (A) is complete, then the end of minor wave A corresponds with the strongest momentum as shown by MACD. This first wave count fits better with MACD, which is why it is the main wave count.
Minor wave 5 exhibits double divergence with MACD.
A new high above 1,259.75 would invalidate the alternate hourly wave count below and provide confidence in this main wave count.
ALTERNATE HOURLY CHART
Thank you to Alan today for this idea.
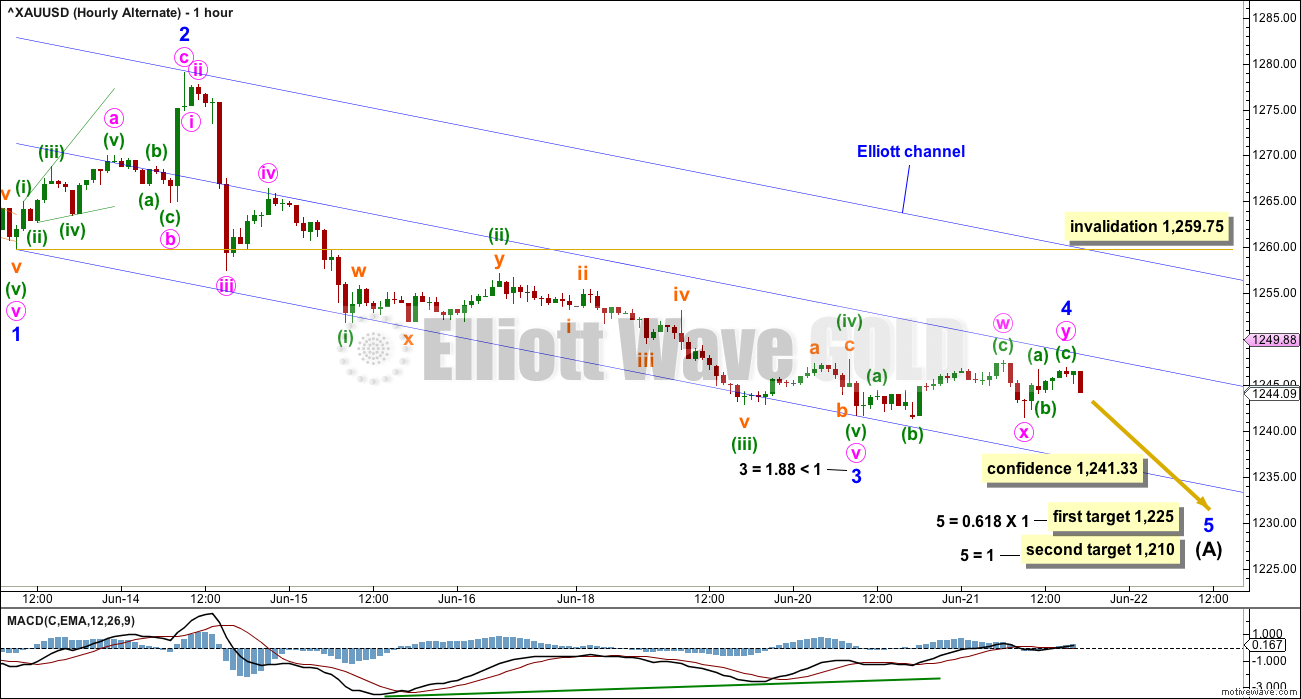
It is also possible that intermediate wave (A) is incomplete and minor wave 5 is still underway.
Minor wave 3 is slightly longer than minor wave 1. Minor wave 3 may have ended with an extended minute wave v, which is typical for Gold.
However, when fifth waves of third wave impulses extend they usually (not always) also exhibit strength. This one does not. This alternate does not have as good a fit with MACD.
Minor wave 2 was a zigzag. Minor wave 4 may have exhibited alternation as a combination. If it continues any further, it may not move into minor wave 1 price territory above 1,259.75.
TECHNICAL ANALYSIS
WEEKLY CHART
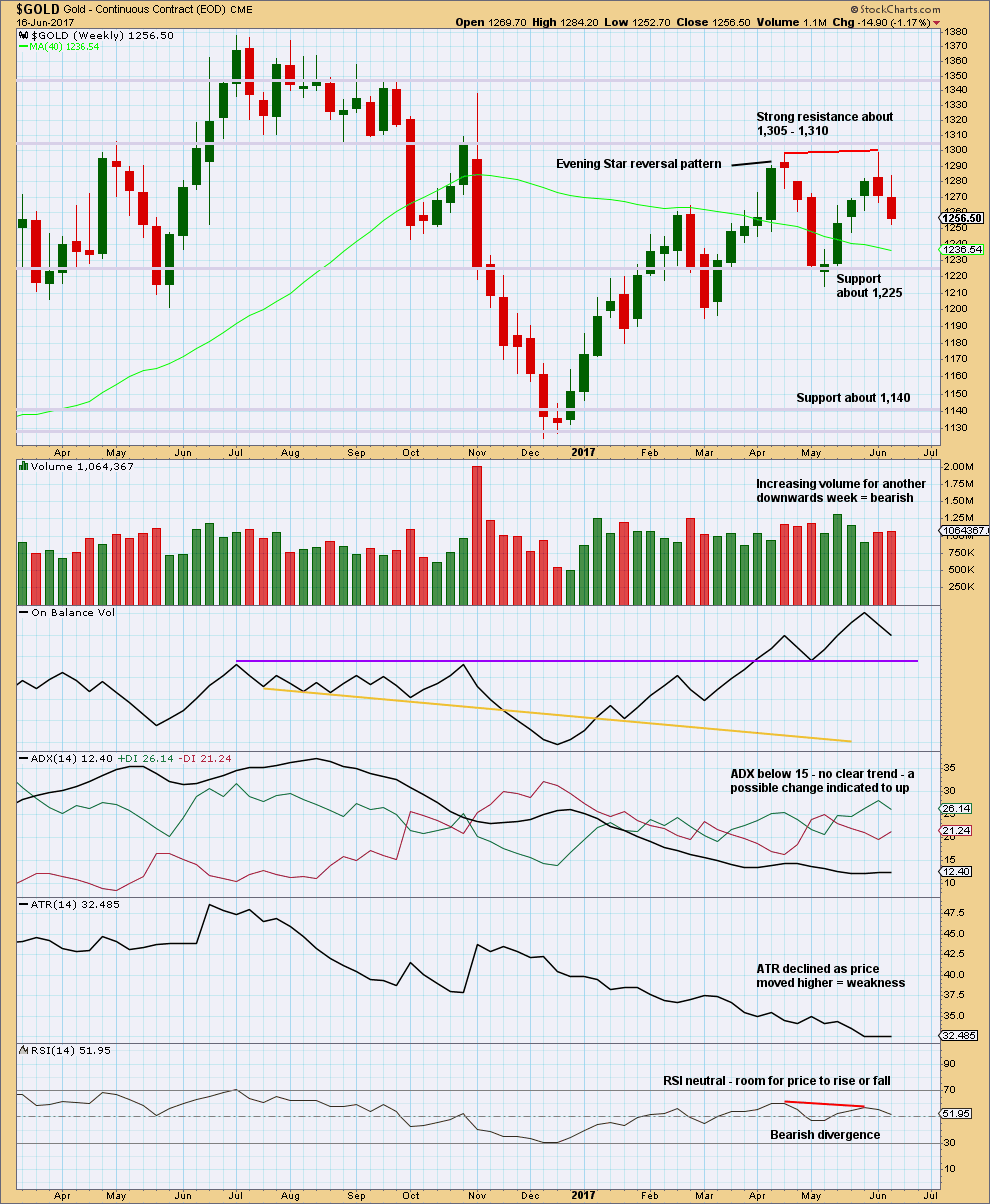
Click chart to enlarge. Chart courtesy of StockCharts.com.
The long upper wicks on the last two weekly candlesticks are bearish. Volume supports the downwards movement in price, so this is not suspicious.
Declining ATR fits with the Elliott wave count at the weekly chart level; this is normal for triangles.
DAILY CHART
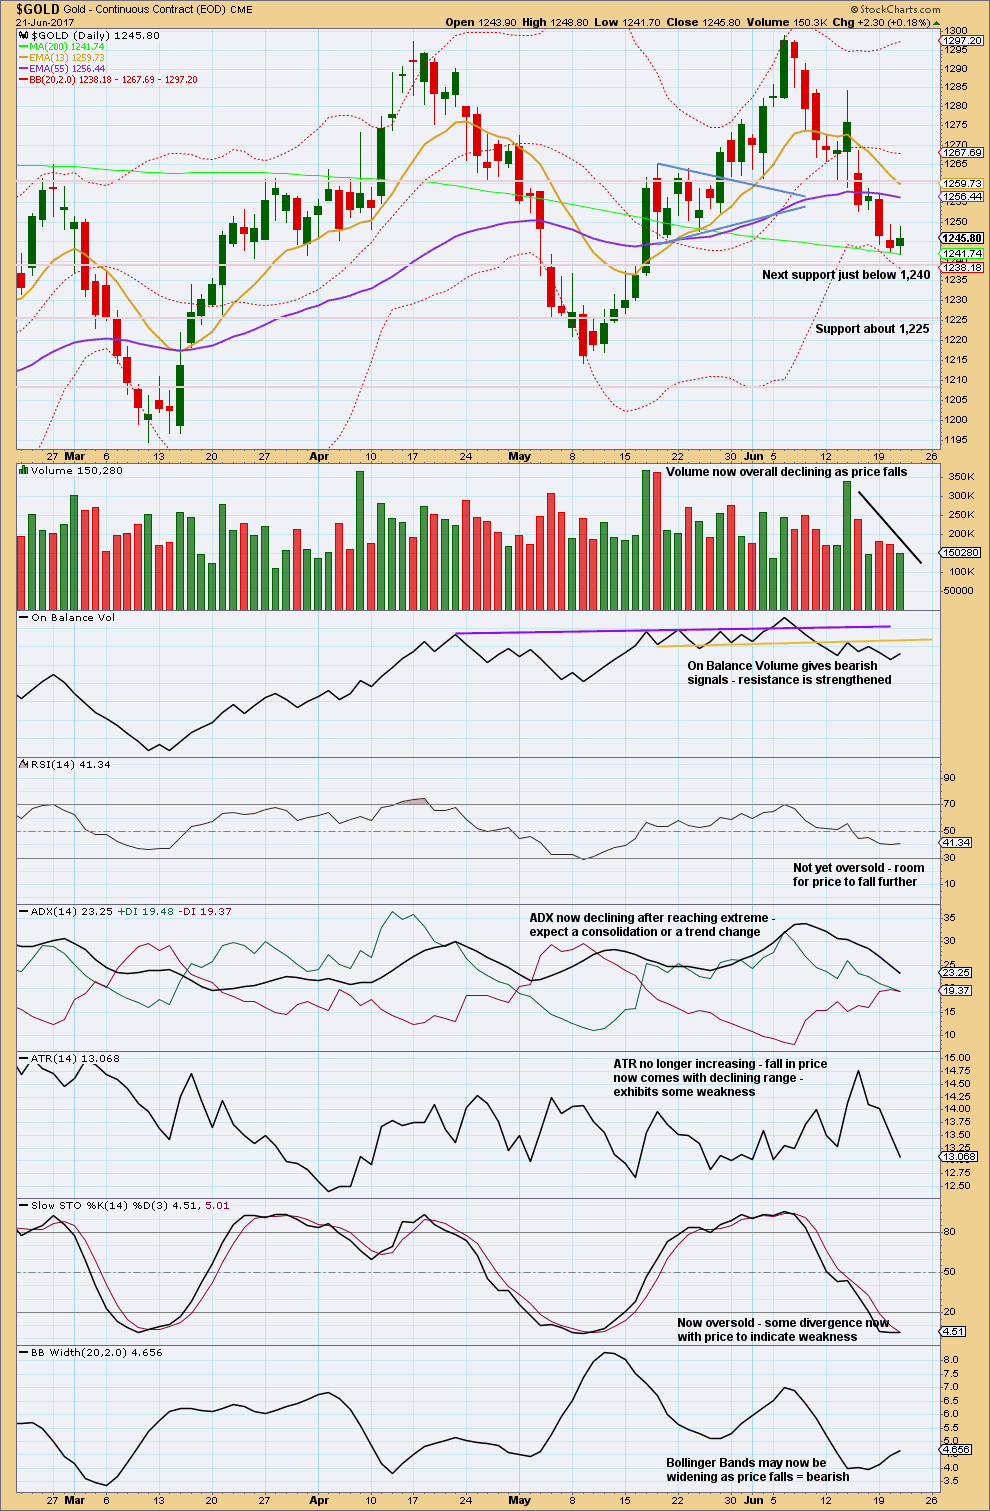
Click chart to enlarge. Chart courtesy of StockCharts.com.
Today’s spinning top candlestick puts the trend from down into neutral, at least temporarily. The balance of volume during the session was upwards although the day made a lower low and lower high. Upwards movement during the session lacks support from volume. This day looks like a small pause within a downwards trend and not necessarily the start of a new upwards wave. This supports the alternate hourly Elliott wave count.
The downwards trend still looks like it is tiring. The downside may be limited. If price can break through support about 1,240, then look for it to continue lower to next support.
GDX
DAILY CHART
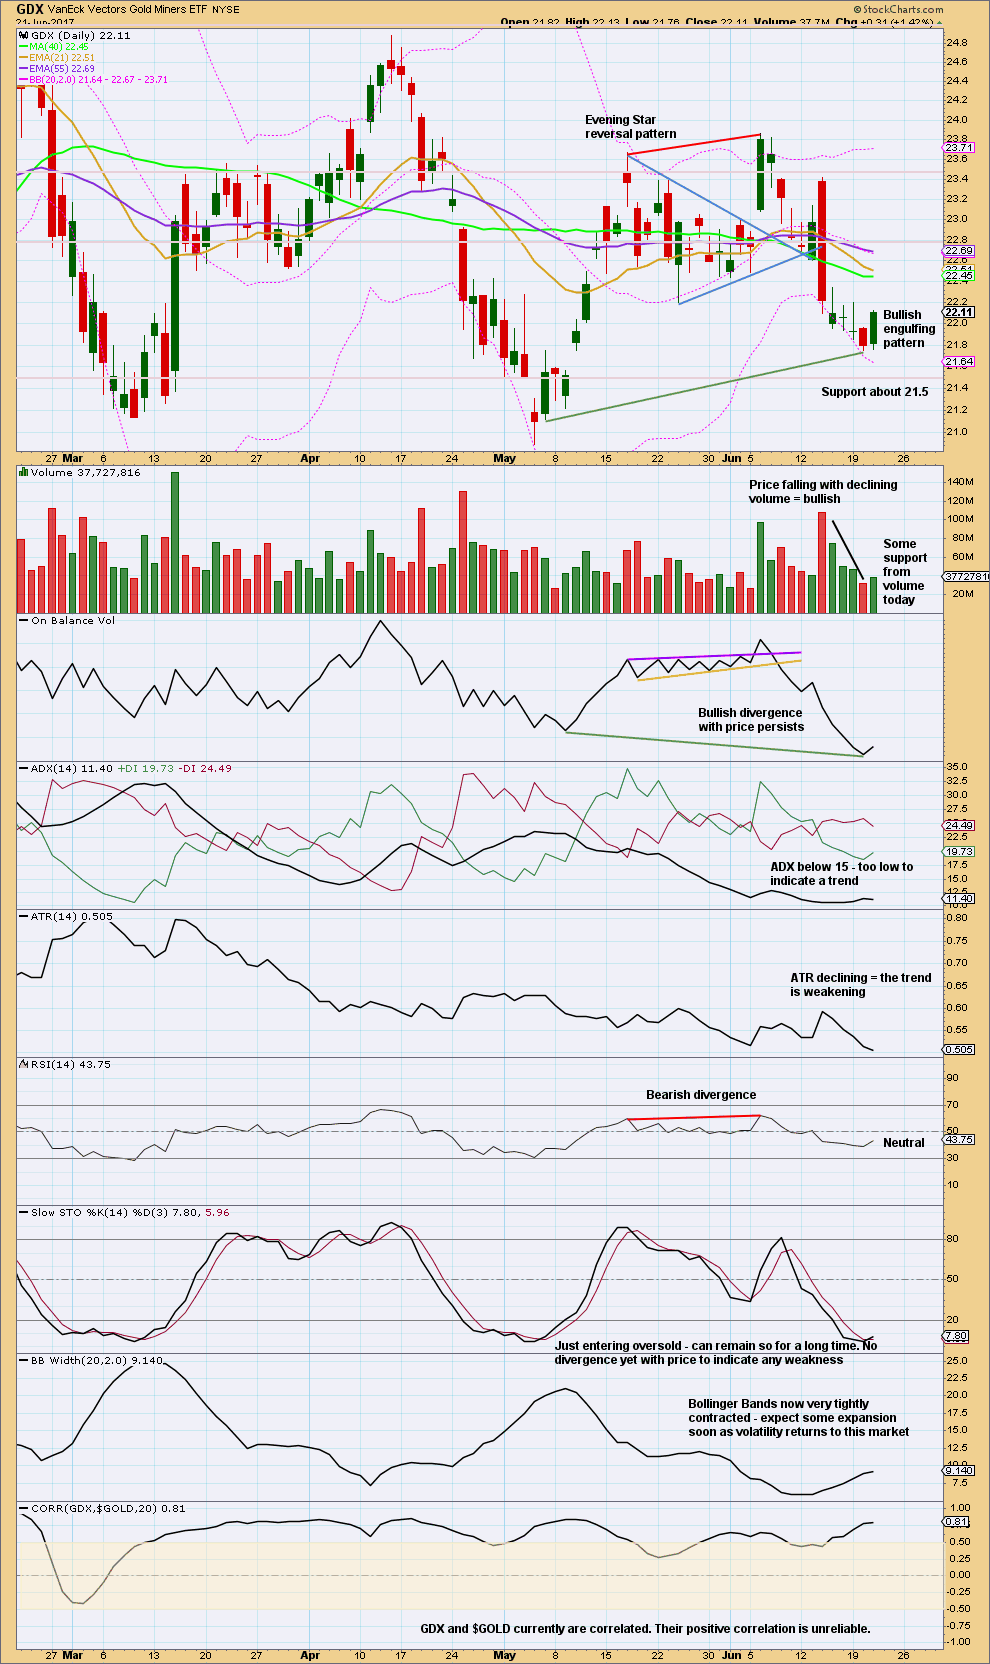
Click chart to enlarge. Chart courtesy of StockCharts.com.
GDX looks more clearly bullish than Gold today.
This analysis is published @ 06:11 p.m. EST.

Could it be a fourth wave? Silver’s candle today a bit weak so we could have one more move lower it would appear.
Silver up more than gold today = healthy
While it’s still below 1,259.75, yes.
It’s also still within the channel.
At least GDX seems to be moving higher and so perhaps the miners will lead the way. I am holding a few SLV 16.0 strike calls from my bearish call spread so it would be great to see them go nicely in the money on the current bounce.
Island reversal on ABX looks bullish . I think the gap up will hold today. 🙂
IAG is really strong too.
Ichimoku Gold 4-Hourly Analysis
Data as at 5:50 am ET June 22
===========================
Gold price had bounced off the bottom cloud boundary at 1241.33 as expected. Price should then test the 1260 short-term short-term resistance area. A rejection there will open the way for a push towards 1200, but if the week closes around 1260 and higher, we could have a bullish reversal sign on a weekly basis.
The Hourly Ichimoku Chart shows that gold remains in a bearish trend. The cloud is red. However, prices are attempting a bullish reversal. Gold price is trading above both the tenkan-sen and the kijun-sen but below the cloud. The tenkan-sen is only slightly below the kijun-sen meaning that the current push is not well supported. It means that gold price would find difficulty in rising above 1260. Bulls might need to retreat and lick their wounds before mounting another assault at the 1260-1270 area.
Even as I write this, it does seem that the first wave of attack may be over at 1254.58; but, appearances can be deceiving and there could be another wave higher. Since gold price has not come anywhere near the invalidation point of 1259.75, both the Main and Alternate counts are still in play. So, once this leg up is over, my concern would then be the length of time the bulls needed to recuperate, and how far are they willing to let the bears govern. If prices manage to hold support at 1241.33, then a rise in price to test 1260, and eventually 1275, will be favoured — the Main Count. But if the support fails to hold, the bears could reign a bit longer, meeting their Waterloo near 1230, where the uptrend line shown in my Weekend Analysis lies. This, of course, is the Alternate Count. Whatever it is, the downside is limited, and a bounce higher is what we should focus on. In the meantime, we’ll just have to grin and bear with the down leg, or for the adventurous, to scalp it.
Nice analysis Alan. I venture that gold works through a couple of 4th wave corrections as it continues upward toward resistance near 1,260. At that point, for the bullish case, a larger wave 2 ensues or for the bear, a wave B. Then sometime next week, gold ventures up deep into cloud resistance toward 1,275. If gold is strong, then the bulls win with a breakout toward 1,300 and a new bull count from Lara. If cloud resistance prevails, then down gold goes following Lara’s current count.
Thanks Dreamer. You are right. There is one more wave to complete the first price rise. To me, the Alternate Count would see a huge drop from there. For the Main Count, there would be a series of 4-5s as you mentioned.
I do have, at the back of my mind, a bullish count, which sees a double zigzag for Minor B. It should end at either the 1450s or 1550s. I think it is the same as your excellent GDX count posted today.
Ichimoku Gold Daily Analysis
Data as at 5:15 am ET June 22
=========================
The gold market took a bit of a break on Wednesday, inching slightly higher following a drop to the low of 1241.33 which lies extremely close to the cloud bottom at 1241.38, as well as the 200 day SMA. Prices only rose much higher after market hours.
Moving forward, I see a significant amount of resistance at the 1250-1260 level, so if we can break beyond that to the upside, that would be a nice opportunity to go long. Once we break above 1260, the market would initially target the 1275 level. However, at the moment, I feel that the market remains under a bit of bearish pressure. MACD histogram is still sloping downwards, favouring a continued price drop. Gold price is still some distance from SMA 50, which continues to exert negative pressure on it. Fundamentally, the market is continuing to grapple with the Fed’s stated intentions. That being the case, it can be difficult for this market to rally, unless there are reasons to do so, such as arousing the still dormant geopolitical scene from its sweet slumber. If this status quo remains prolonged, then given enough time it is likely that short-term sellers may get involved.
The Daily Ichimoku Chart presents an ambiguous picture. Price has risen above the bottom cloud boundary. The cloud has turned green but it is very thin, signifying that the bullish push is at its infancy, and has yet to gather momentum. Tenkan-sen had made a bearish crossover with kijun-sen two days ago, acting as a restraint to rising prices. Furthermore, gold price lies below both lines. So, the headwinds to a rally are very strong. Now, if we zoom to a larger timeframe (not shown), we observe that the weekly candle has a long tail. It had touched the cloud support and bounced off it. This is a short-term bullish sign, because the cloud will be turning red in two weeks’ time, at the beginning of July.
So what does all this mean? My take is that we have a short window of about two weeks for price to attempt to recover above 1260. It might not be able to do so at the first try, and fall back, only to mount another assault. This time it succeeds, but the effort might have severely exhausted the bulls. The bears would then take the opportunity to run the show for the time being. So far, this agrees very well with the prediction of Lara’s Main Count. But what if the bulls begin to run on steroids and push prices way beyond 1275? Ah, that would be the bullish scenario that all of us have been very patiently waiting for.
Gold is looking good with a high over 1,253 so far since Lara’s analysis was posted.
GDX reversed upward at the triangle trendline support. While we can’t declare the Bear dead, looking for a few up days. Let’s see how strong this move up will be…
https://www.tradingview.com/x/9CHY40te/
Curious if anyone else noticed that break-out upwards on massive volume in the biotech ETFs XBI and IBB. They are both looking like excellent candidates for a RTM trade cavorting that high above the upper BB. This does not mean the breakout is not the real deal, but a return to test the former resistance areas looks a good R/R possible set-up.
We had a concomitant breakdown in junk bonds today, no doubt courtesy of the FED and Oil sector weakness. The lion’s share of recent issues have been to the oil exploration sector. 🙂
I have not done any technical analysis on the biotech sector, and so I see yesterday’s price surge as hinging on two factors. Firstly, technology stocks appear to be the whipping boy recently, and now Tesla is perceived to be in grave danger following Elon Musk’s terrible mistake. Secondly, Trump stated that “the expected action on drug prices may not be as onerous as investors feared”. The Trump factor is somewhat of a paradox because in his campaign, he had launched a tirade against the wanton greed of the pharmaceutical industry, accusing them of “getting away with murder”. His latest statement appears to be back pedaling, and he could be forced to change his impulsive tone.