A downwards reaction was expected for Monday, which is exactly what has happened.
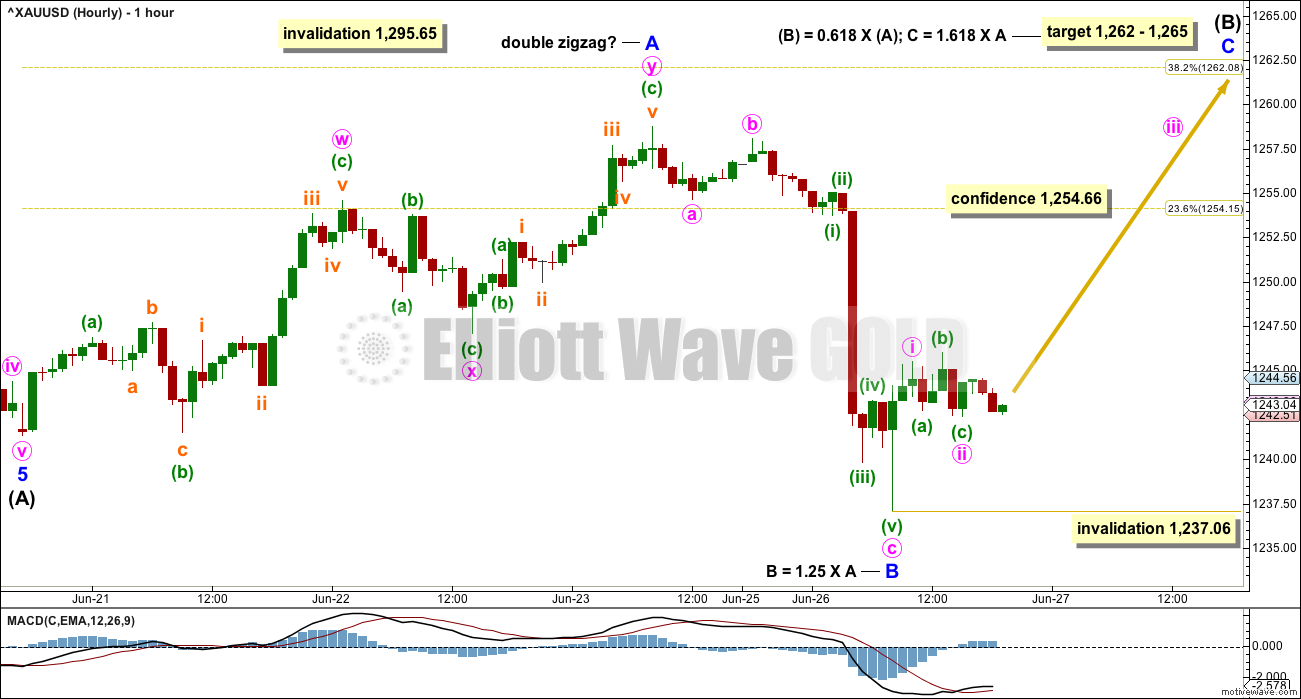
Summary: The main wave count now expects upwards movement for at least one session to 1,262 – 1,265. A new high above 1,254.66 would add substantial confidence to this target zone.
However, there is strong indication from volume today that downwards movement is not over. Another downwards day may unfold before price turns upwards towards the target.
Always use a stop on every trade. Do not invest more than 1-3% of equity at this time on any one trade.
New updates to this analysis are in bold.
Last monthly charts and alternate weekly charts are here, video is here.
Grand SuperCycle analysis is here.
WEEKLY CHART I
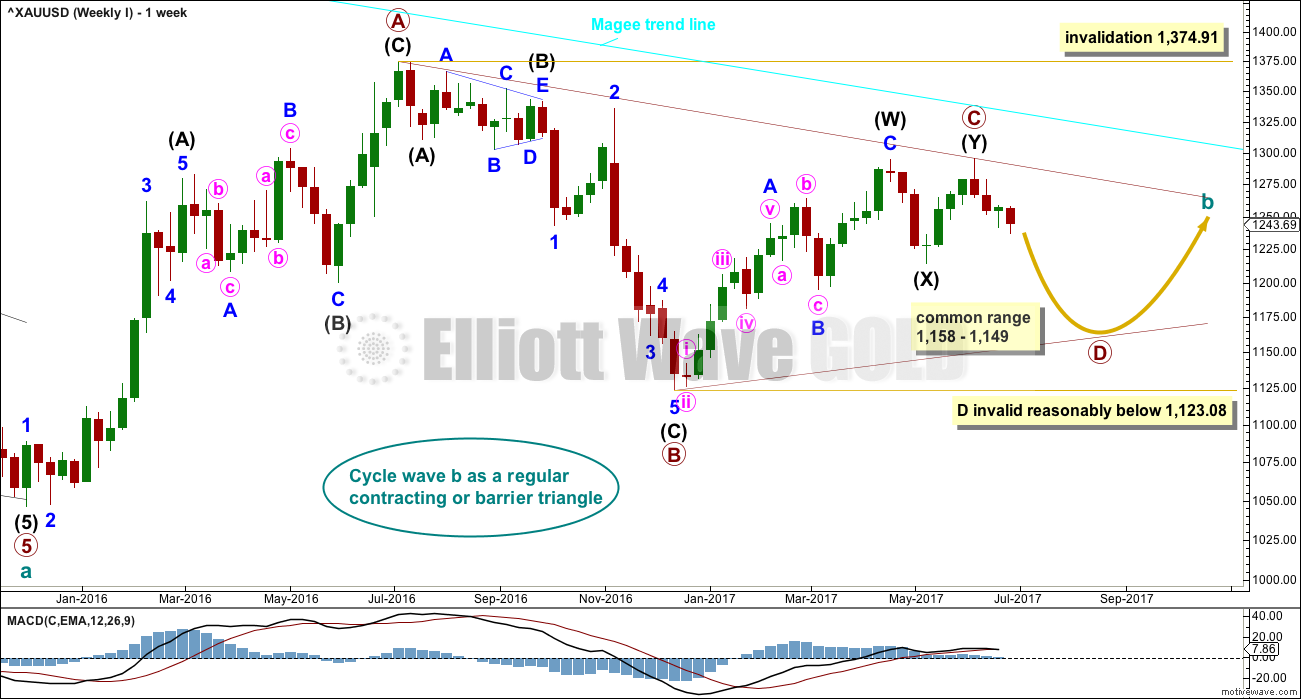
The Magee bear market trend line is added to the weekly charts. This cyan line is drawn from the all time high for Gold on the 6th of September, 2011, to the first major swing high within the following bear market on the 5th of October, 2012. This line should provide strong resistance.
At this stage, a triangle still looks most likely and has the best fit for cycle wave b.
Within a triangle, one sub-wave should be a more complicated multiple, which may be primary wave C. Primary wave C may not move beyond the end of primary wave A above 1,374.91. This invalidation point is black and white.
At this stage, it looks like primary wave C is now complete at the hourly and daily chart level. However, at the weekly chart level, it looks possible it may continue higher. This possibility must be acknowledged while price remains above 1,214.81. Within intermediate wave (Y), minor wave B may not move beyond the start of minor wave A.
Primary wave D of a contracting triangle may not move beyond the end of primary wave B below 1,123.08. Contracting triangles are the most common variety.
Primary wave D of a barrier triangle should end about the same level as primary wave B at 1,123.08, so that the B-D trend line remains essentially flat. This involves some subjectivity; price may move slightly below 1,123.08 and the triangle wave count may remain valid. This is the only Elliott wave rule which is not black and white.
Primary wave C may end when price comes up to touch the Magee trend line.
There are three alternate wave counts that have been published in the last historic analysis, which is linked to above. They are all very bullish. Members may like to review them at this stage. They will only be published on a daily basis if price shows them to be true with a new high now above 1,295.65.
DAILY CHART
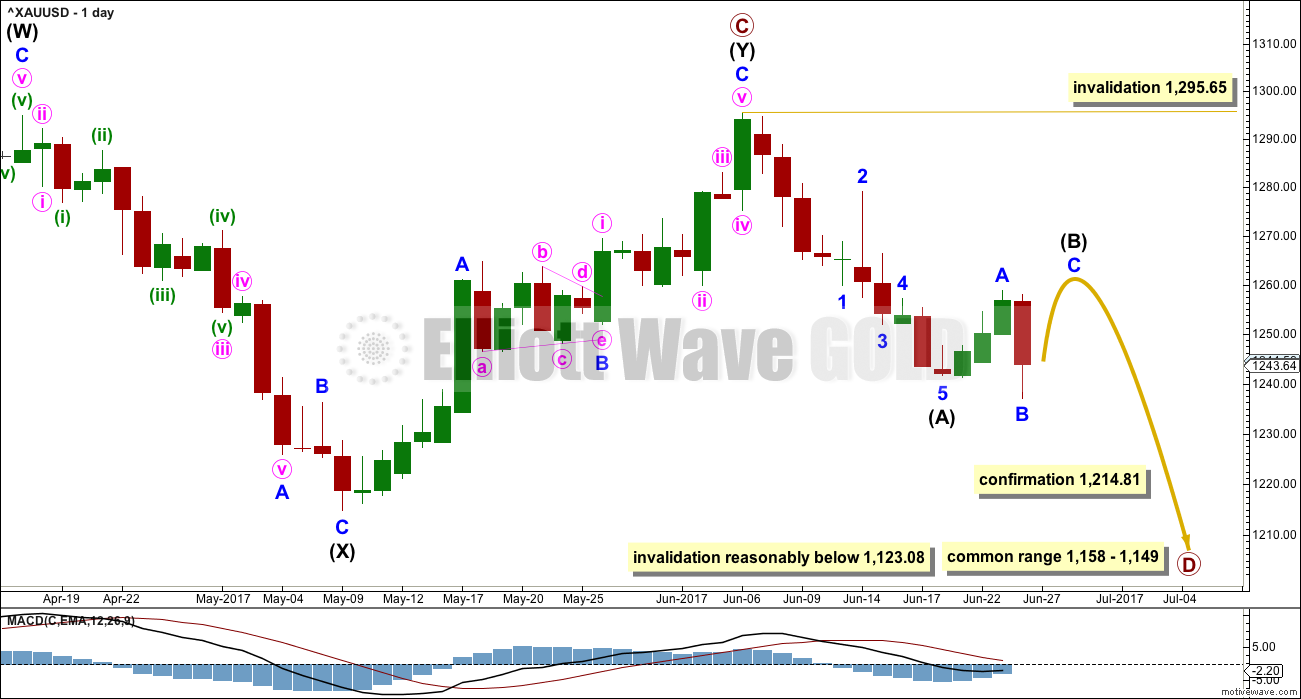
Intermediate wave (Y) may now be a complete zigzag if it is accepted that a triangle completed in the position labelled minor wave B. This has a perfect fit on the hourly chart.
A new low below 1,214.81 could not be minor wave B within intermediate wave (Y) and would provide strong confirmation that intermediate wave (Y) is over.
A common range for triangle sub-waves is from about 0.8 to 0.85 the prior sub-wave, this gives a range for primary wave D from 1,158 to 1,149.
If primary wave C is correctly labelled as a double zigzag, then primary wave D must be a simple A-B-C structure and would most likely be a zigzag. Within primary wave D, intermediate wave (B) may not move beyond the start of intermediate wave (A) above 1,295.64.
Intermediate wave (A) lasted only ten days. So far intermediate wave (B) has lasted four. If it concludes within one more session, it may total a Fibonacci five days. This would be a reasonable proportion, but it is also quite possible it may continue for longer to have better proportion to intermediate wave (A).
So far it looks like intermediate wave (B) may be completing as an expanded flat correction. It is also possible to move the degree of labelling within this expanded flat down one degree; it may only be minor wave A or W of a more time consuming flat or combination for intermediate wave (B).
The main hourly chart below follows on from the labelling here on the daily chart.
For the alternate hourly chart below, the end of intermediate wave (B) would be labelled as complete at the high of minor wave A on the 23rd of June.
Primary wave A lasted 31 weeks, primary wave B lasted 23 weeks, and primary wave C may have been complete in 25 weeks.
Primary wave D should be expected to last at least 8 weeks (but most likely longer). The next Fibonacci ratio in the sequence would be a Fibonacci 13 and then 21.
HOURLY CHART
An expanded flat may be unfolding. This may be intermediate wave (B) in its entirety as labelled. Or the degree of labelling may be moved down one degree so that it may be an expanded flat for minor wave A or an expanded flat for minor wave W, as the first structure in a double combination.
The common range for B waves within flats is from 1 to 1.38 the length of their A waves. Here, minor wave B is within the common range.
Within minor wave C, the correction of minute wave ii may not move beyond the start of minute wave i below 1,237.06.
In the short term, if price makes a new low below 1,237.06, then it would be possible that minor wave B is moving lower as another double zigzag.
There is no rule stating a limit for B waves within flat corrections. There is a convention though that B waves within flats are so rarely longer than twice the length of their A waves, that the idea of a flat should be discarded when that price point is reached. Here, minor wave B would be twice the length of minor wave A at 1,223.92. Only a new low below this point would see the idea of an expanded flat unfolding discarded.
ALTERNATE HOURLY CHART
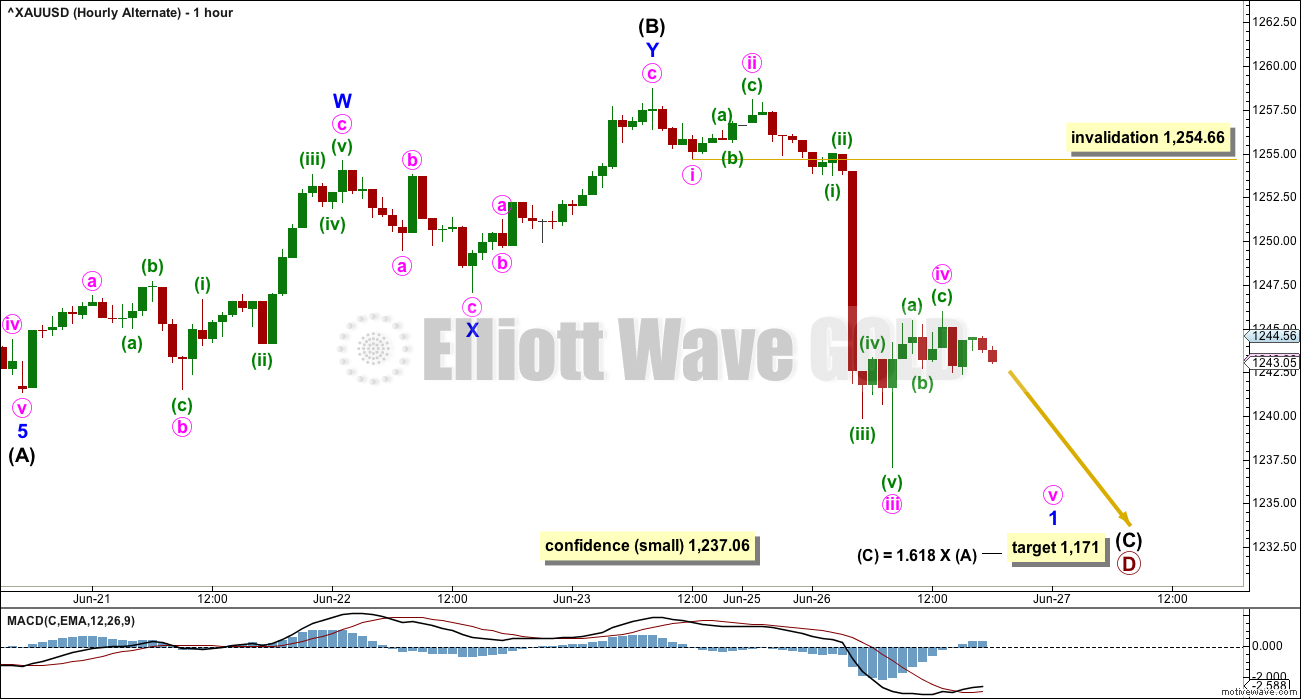
This alternate looks at the very unlikely possibility that intermediate wave (B) was complete in just three days as a shallow double zigzag.
If intermediate wave (B) is complete, then intermediate wave (C) downwards should begin with a five wave structure for minor wave 1. Within minor wave 1, if minute wave iv continues further, it may not move into minute wave i price territory above 1,254.66.
Only a very small confidence may be had in this alternate wave count if price makes a new low below 1,237.06. The main wave count would still be valid and this wave count would remain an alternate.
TECHNICAL ANALYSIS
WEEKLY CHART
Click chart to enlarge. Chart courtesy of StockCharts.com.
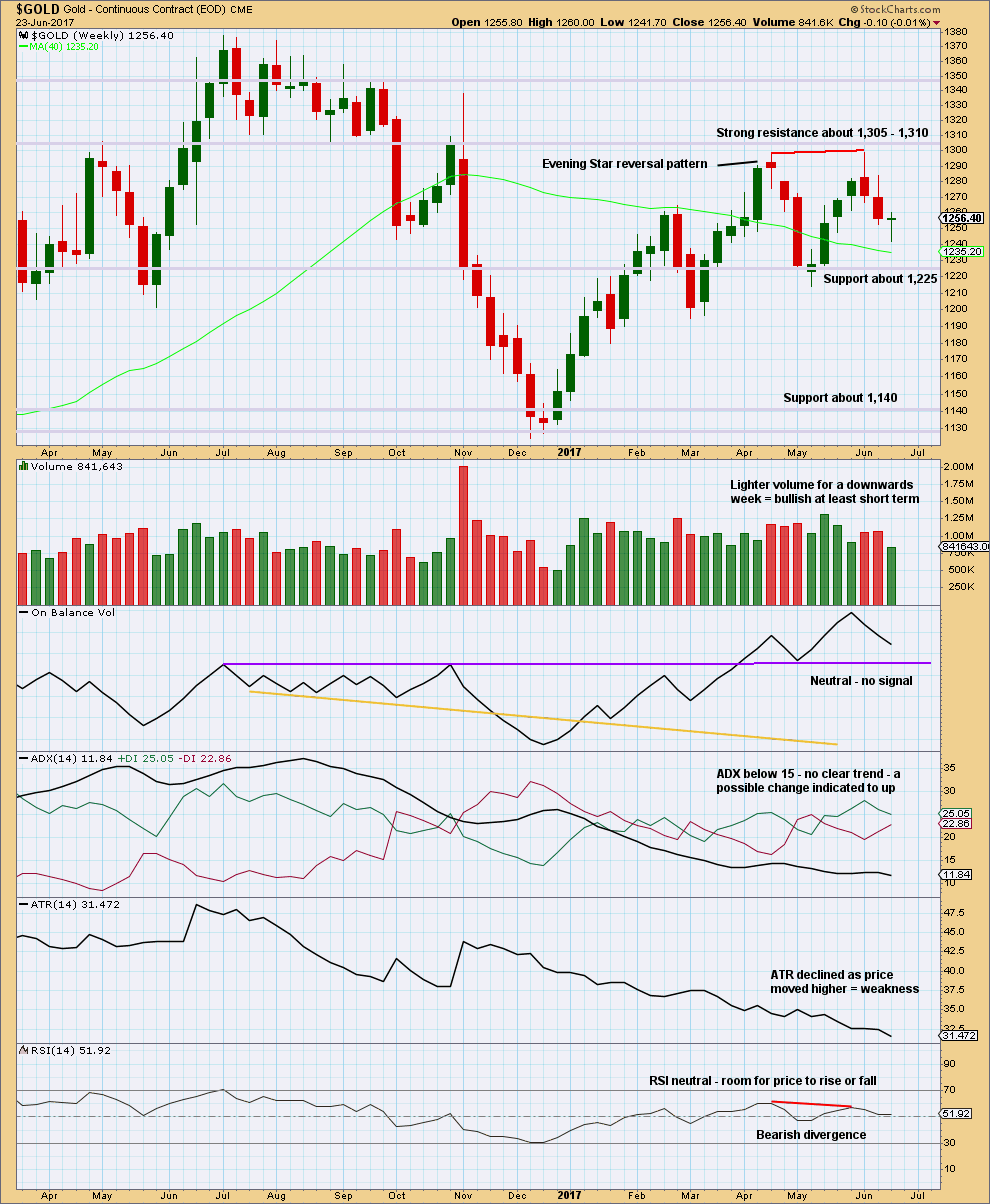
The long lower wick of the last weekly candlestick is bullish. This puts the short term trend from down to neutral.
Lighter volume for the last week does not support the fall in price. In conjunction with the longer lower wick and doji candlestick, a bounce here looks like a very real possibility.
Declining ATR for a long time fits neatly with the expectation of a large triangle unfolding.
DAILY CHART
Click chart to enlarge. Chart courtesy of StockCharts.com.
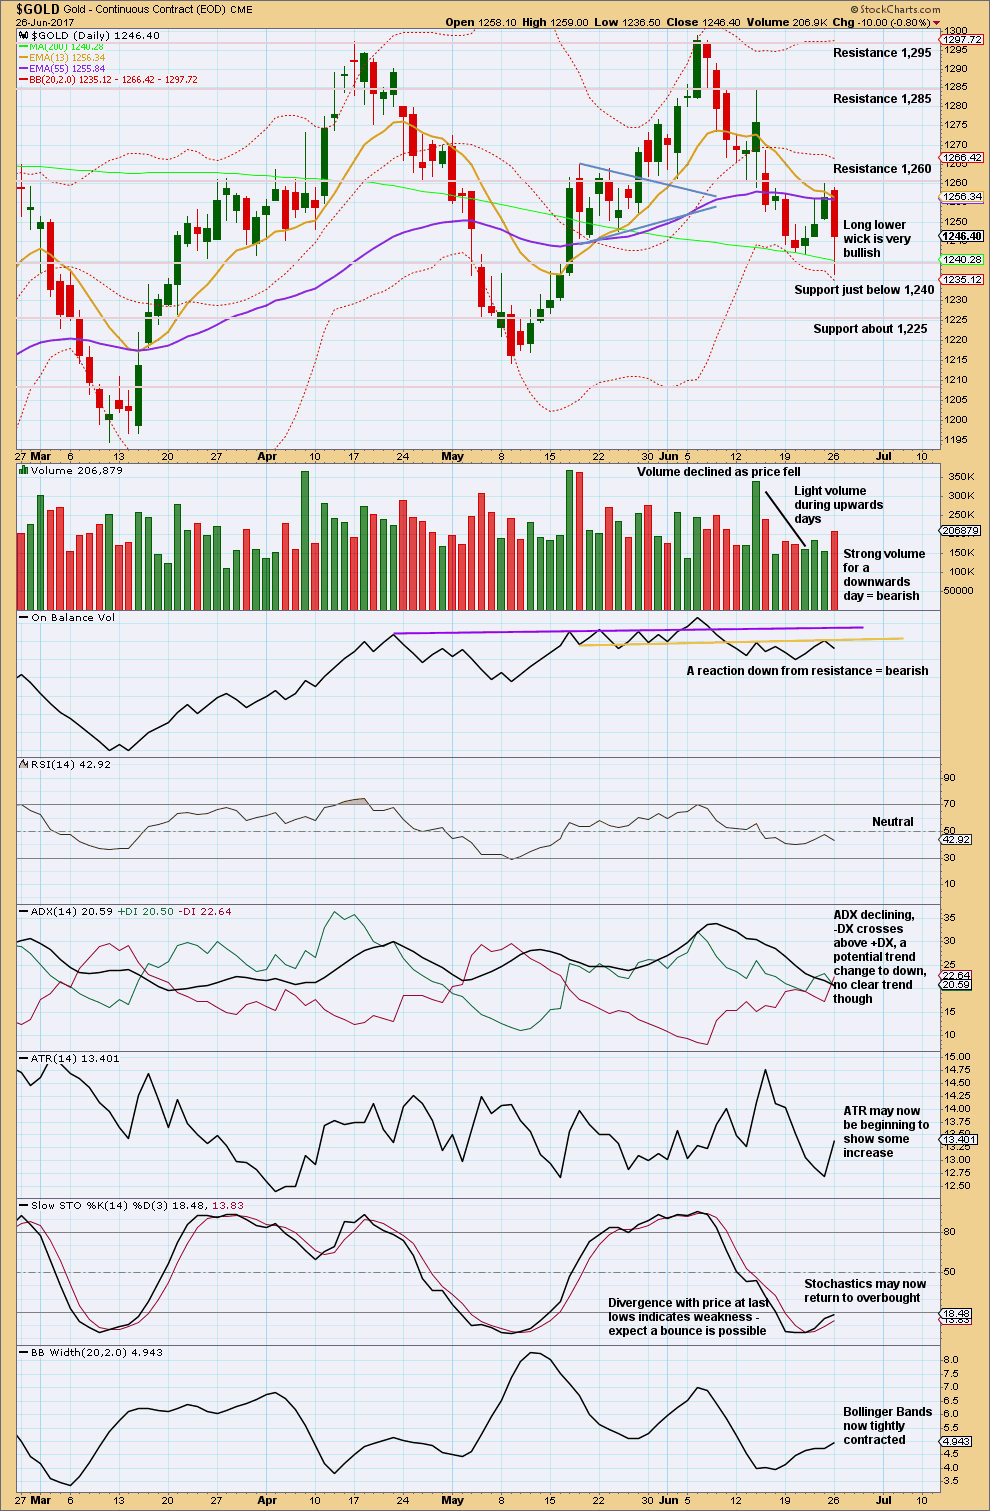
Price found strong resistance today just below 1,260. Support from volume for downwards movement today suggests more downwards movement for the next session despite the bullishness of the long lower wick on this candlestick.
Resistance at the yellow trend line for On Balance Volume is strengthened. This does not preclude an upwards day tomorrow, but it would limit upwards movement to only possibly one session if resistance at that line holds.
GDX
DAILY CHART
Click chart to enlarge. Chart courtesy of StockCharts.com.
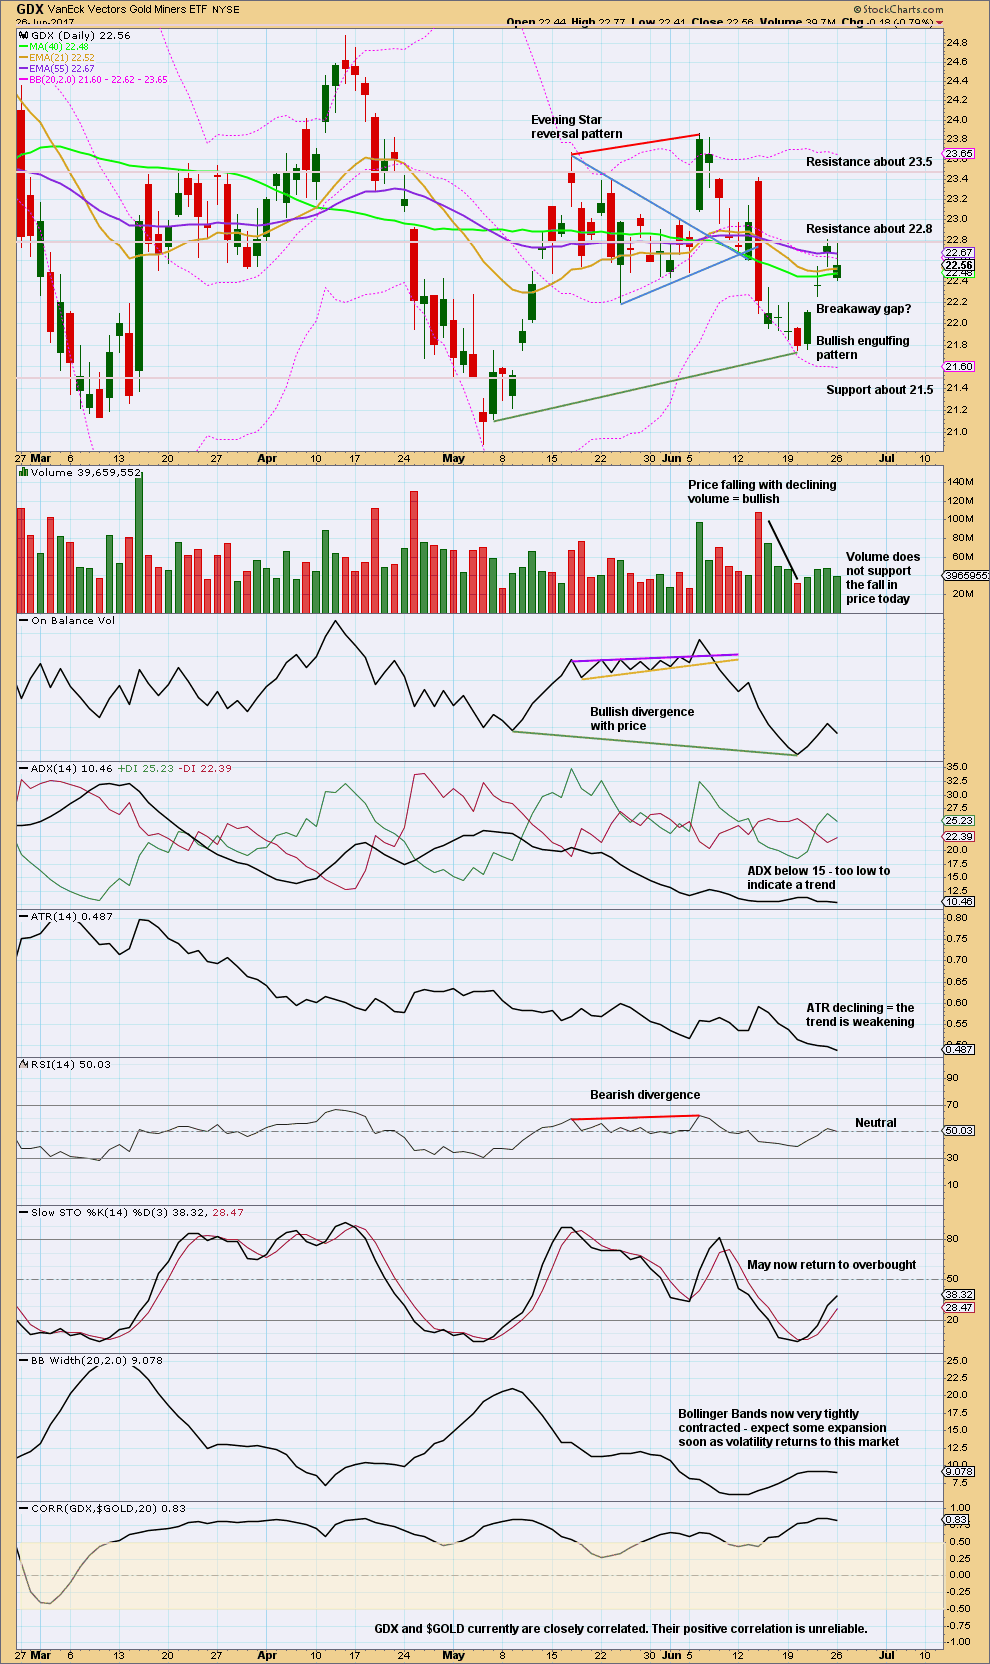
GDX looks more bullish than Gold today.
A lack of support from volume for downwards movement today is bullish. The long upper wick is bearish.
This analysis is published @ 07:51 p.m. EST.

Could the high today of 1253 be considered end of minute i, with the correction to 1245 minute ii of minor C of intermediate (B)?
It doesn’t look like a five, it looks like a three.
Got it. Thanks 🙂
GDX printed a bearish engulfing candle today. This usually portends at least a few days of decline. Probably C of a second wave per Dreamer’s count. I would like to see it remain above 21.75 to confirm the uptrend.
The candle is ugly, but the bottom may be in. There are times in the past where GDX printed an ugly candle at the bottom of a correction.
I was thinking the same thing Dreamer. Today’s low would be a good fit to the end of intermediate 2 on your charts 🙂
Wow! I did not know that and am so glad you pointed that out Dreamer. I was a bit conflicted as Gold hit my target this evening at 1250. Thanks!
Not too excited about that red GDX candle. Looks like another move down on deck…I will wait…
GDX continues higher. Still holding some dry powder as I think we might get another dip. All in over 1250.00
We are over 1250 since the wee hours?
Gold spot price.
1245.79, could be the low for B of this move up?
Now off to 1260+ for C of (B)
Ichimoku Gold 4-Hourly Analysis
Data as at 7:30 am ET June 27
===========================
Gold prices crashed yesterday on the back of a very large sell order that was pushed through to the markets within a few minutes. Apparently, a “fat goldfinger” sold 18,500 contracts of gold by mistake, triggering sell-stops below 1250. This forced prices to move towards the 1240 region where it has found some support ever since. Prices then bounced back towards the 1250 region and it remains to be seen how long it will be able to sustain this bounce. A price break above the 1258 level should send this market much higher, perhaps reaching as high as the 1275 level. That’s an area that is massively resistive, and with this being the case, it’s likely that the breaking of that area would send a lot of money into this market. On the other hand, should prices break down below the lows of the last couple of days, and especially the brown uptrend support line (coming in today around 1233), that would be a very negative sign, perhaps looking at 1200 as the next level. Ultimately, the market should continue to remain volatile, and with several central bankers speaking during the day, we could find plenty of catalysts to move the gold market.
So, which is the more likely scenario? Let’s look at Ichimoku for some clues. The 4-hourly chart shows prices trading below the cloud, which is red. Tenkan-sen is lying below the kijun-sen. Clearly, the short-term trend is bearish. In the last couple of hours, prices are trading above both the tenkan-sen and the kijun-sen, and are attempting to enter the cloud, an indication that the trend is becoming less bearish. It is only when prices manage to break above the top cloud boundary that the trend can change to weakly bullish (because the cloud is still red). The market should be volatile today, what with the number of speeches being made by Yellen as well as the central bankers.
Overall, the picture is far from rosy. Gold price remains in a bearish trend as long as price is below 1260. The double top rejection at 1300 had opened up the possibility of a break lower towards 1200-1180. Moving forward, I concur with Lara’s outlook. The current short relief rally should give way to a much more pronounced drop in Intermediate C of Primary D. Once the brown uptrend support line fails to contain the bearish onslaught, a waterfall would ensue, the magnitude of which far eclipsing what had transpired yesterday.
By”mistake”huh? 😉
The alternative is unpalatable — wilful manipulation to flush out long positions. But then probably that’s what it is. I’m sure the market has enough triggers that could catch such moves. If so, then an 18K contract size falls below the acceptable limits? We may never know.
I had not heard the “fat-finger” excuse in quite some time. So far as wilful manipulation being unpalatable, I don’t disagree. Sadly, the fact that Comex traders admitted to just (incriminating e-mails) that during former CFTC chairman Bart Chilton’s hearings a few years ago is also true. They tried to kill Andrew Mcguire for exposing it, and recently DB actually settled a lawsuit alleging same. I am afraid price manipulation in the PM market is no fairy tale. 🙂
Well, if she/he did make a mistake, then I’m sure glad he could recoup and rebuy at a lower price. My mistakes usually cost me money. How fortuitous. He might even get a raise. Better lucky than good. I wonder what his/her track record is for making or losing money after mistakes. I’m also wondering why this would be labeled as a mistake? Was it legal? Cya?
Hmmnnnn….! 🙂
I’ve closed my short on NZDUSD with the slight new high.
Now stepping aside to see what happens next.
Saw this basic idea on Stocktwits, here’s my own chart.
Seems to fit the concept pretty good. 1st half of the pattern is a Broadening Formation and the 2nd half of the pattern is a Symmetrical triangle.
What do you think?
https://www.tradingview.com/x/nFSl5XOh/
Diamond Bottoms
http://thepatternsite.com/diamondb.html
Hi Lara
Do you still have confidence in your short Kiwi trade? If yes, then I’m guessing we’ve just re-tested the uptrend line from below.
Thanks
Yes, I have confidence. My shorts are underwater, but I’m holding on. This looks like a fairly typical test of resistance after a breach of support.
While there’s no new high above 0.73188 (the last high for 14th June) I’ll hang on.
This might be a better entry point actually. I opened a short with 3% of my equity a few days ago, I may open another now for 1-2% of equity.
The commercials lopped off 32 k contracts on the dollar from there short side. This doesn’t seem to jive with the 30 plus contracts taken off the short side of gold. While there are different commercial entities it is odd that they are taken opposite stances.
GDX 30 minute chart update
https://www.tradingview.com/x/v3i0JcnA/
Yep! That looks right. I think I was early in calling the “double dump” for this correction, with the second dump to finish up C of wave 2 still to come. After that it should be off to the races…
They may switch tactics and do it intra-day instead of overnight to keep traders off-balance.
I am half full- bore so should get the rest in place tomorrow…
Sounds good.
Just curious, what is the bear count looking like?
I’m pretty sure there’s another leg up even if the bear prevails. Until there is a clear breakout of the triangle, we need to watch for a possible breakout to the downside. I’d like to see this next leg up go beyond 23.86 to increase confidence in the bull.
“An expanded flat may be unfolding. This may be intermediate wave (B) in its entirety as labelled, or the degree of labelling may be moved down one degree. It may be an expanded flat for minor wave A, or an expanded flat for minor wave W as the first structure in a double combination.”
You probably meant “This may be minor (B) in its entirety”… in the hourly chart commentary.
I always know what you mean from looking at the chart but I thought I’d tell you early…just in case… 😉
This time I do actually mean what I wrote.
The expanded flat may be exactly how I’ve labelled it, with minor waves A and B complete now for minor wave C upwards to unfold. That might complete intermediate wave (B) in its entirety.
OR….
The expanded flat may be only minor wave A or W. If we move the degree of labelling on the main hourly chart all down one, it may be only minute wave a and minute wave b complete, now for minute wave c upwards to unfold.
If we move the degree of labelling on the main hourly chart down one degree then minor wave A is unfolding as a three. A wave can be threes or fives. When they’re threes it indicates a flat, triangle or combination.
Got it! 🙂