
It is time to step back and take another look at the bigger picture as cycle wave b becomes a little clearer.
Summary: In the short term, expect more upwards movement to a new target at 1,326. If price moves below 1,281.94, then a slightly deeper longer lasting pullback should remain above 1,269.45 but the overall short term upwards trend should remain intact.
Corrections are an opportunity to join the trend.
Always use a stop. Do not invest more than 1-5% of equity on any one trade.
New updates to this analysis are in bold.
Grand SuperCycle analysis is here.
MAIN WAVE COUNT
MONTHLY CHART
Click chart to enlarge.
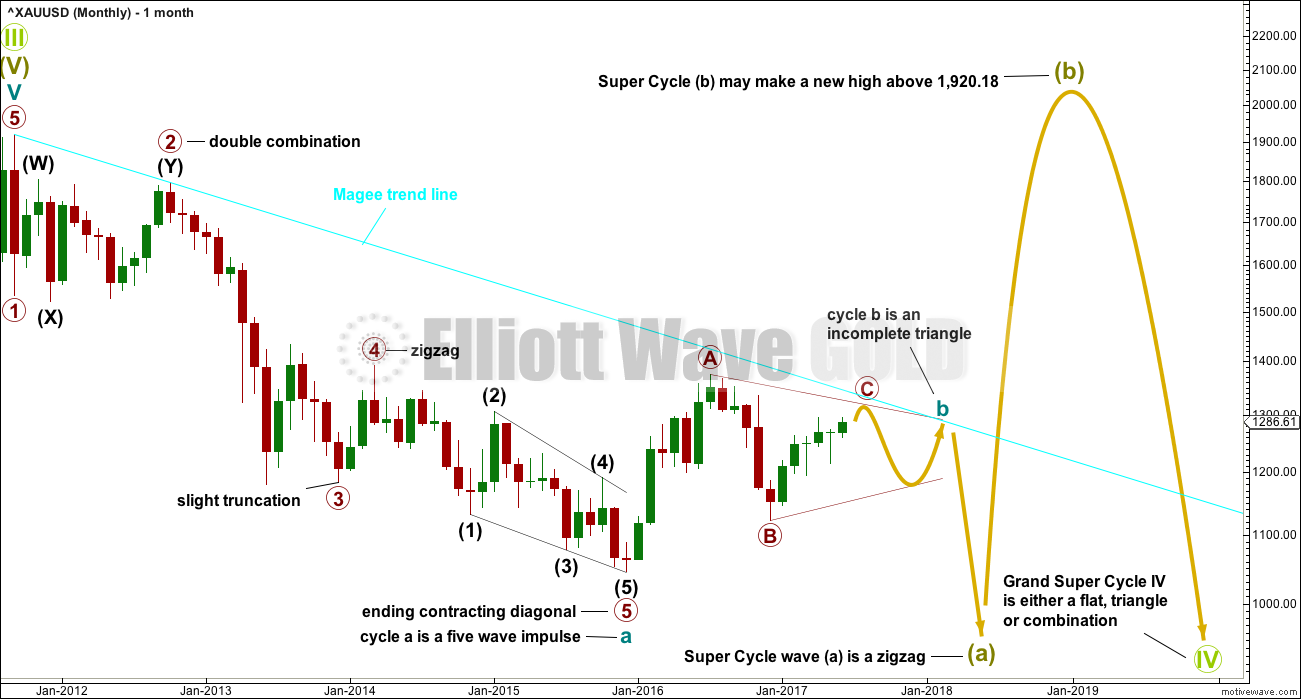
The large downwards wave from September 2011 to December 2015 will fit as a five wave impulse.
Within the impulse, primary wave 3 ends with a truncation. This is acceptable, it came after a movement which may be described as “too far, too fast” for the middle of the third wave.
There is alternation between the double combination of primary wave 2 and the brief zigzag of primary wave 4. Zigzags are usually more brief structures than combinations, so this disproportion is acceptable.
Primary wave 5 is an ending contracting diagonal, meeting all rules for diagonals.
If the downwards wave labelled cycle wave a is a five, then the correction cannot be over there. This also suggests that the correction is a zigzag, or the first wave within it is a zigzag. Because of the expected duration of Grand Super Cycle wave IV, it looks best if Super Cycle wave (a) is seen as an incomplete zigzag.
The problem now becomes what to make of cycle wave b? In the last historic analysis, cycle wave b was considered most likely to be unfolding as a combination, the most common structure after a zigzag. That wave count has been invalidated now leaving a triangle as the next most likely structure.
Cycle wave b may still yet morph into a combination or flat correction as its structure continues.
A bear market trend line is drawn from the all time high in September 2011 to the first major swing high in October 2012. This cyan trend line is copied over to weekly and daily charts. The bear market may be expected to remain intact while price remains below this line. Price may find strong resistance if it comes up again to touch the line.
WEEKLY CHART I
Click chart to enlarge.
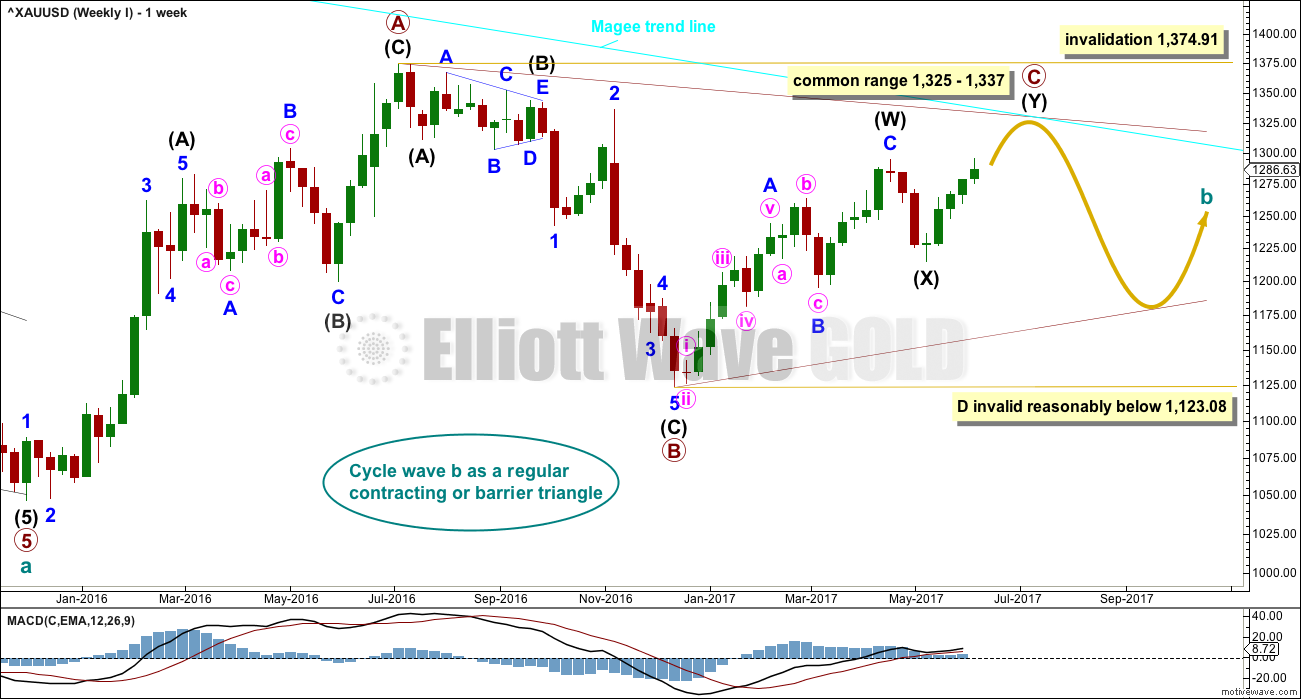
The Magee bear market trend line is added to the weekly charts. This cyan line is drawn from the all time high for Gold on the 6th of September, 2011, to the first major swing high within the following bear market on the 5th of October, 2012. This line should provide strong resistance.
At this stage, a triangle still looks most likely and has the best fit for cycle wave b.
Within a triangle, one sub-wave should be a more complicated multiple, which may be primary wave C. Primary wave C may not move beyond the end of primary wave A above 1,374.91. This invalidation point is black and white.
A common range for the length of triangle sub-waves is from 0.8 to 0.85 the length of the prior wave in the opposite direction. This gives a range of 1,325 to 1,337 for primary wave C.
When primary wave C is complete, then for a contracting triangle primary wave D may not move beyond the end of primary wave B below 1,123.08, or for a barrier triangle primary wave D may end about the same level as 1,123.08 (so that the B-D trend line is essentially flat; this invalidation point is not black and white).
Primary wave C may end when price comes up to touch the Magee trend line.
DAILY CHART
Click chart to enlarge.
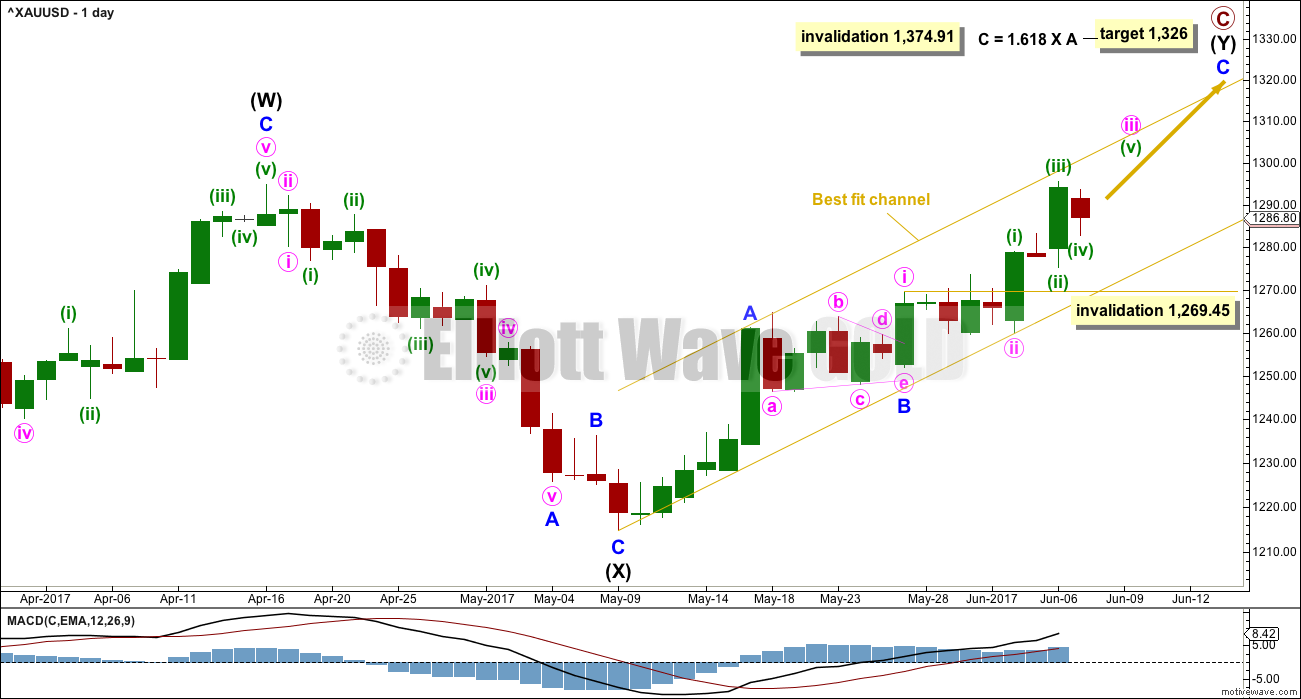
The target would see primary wave C end just within the common range of 1,325 to 1,337.
Intermediate wave (Y) is subdividing as a zigzag. So far minor waves A and B look complete and minor wave C looks incomplete. Within minor wave C, the upcoming correction for minute wave iv may not move back into minute wave i price territory below 1,269.45.
Minute wave iii looks like it is extending.
HOURLY CHART
Click chart to enlarge.
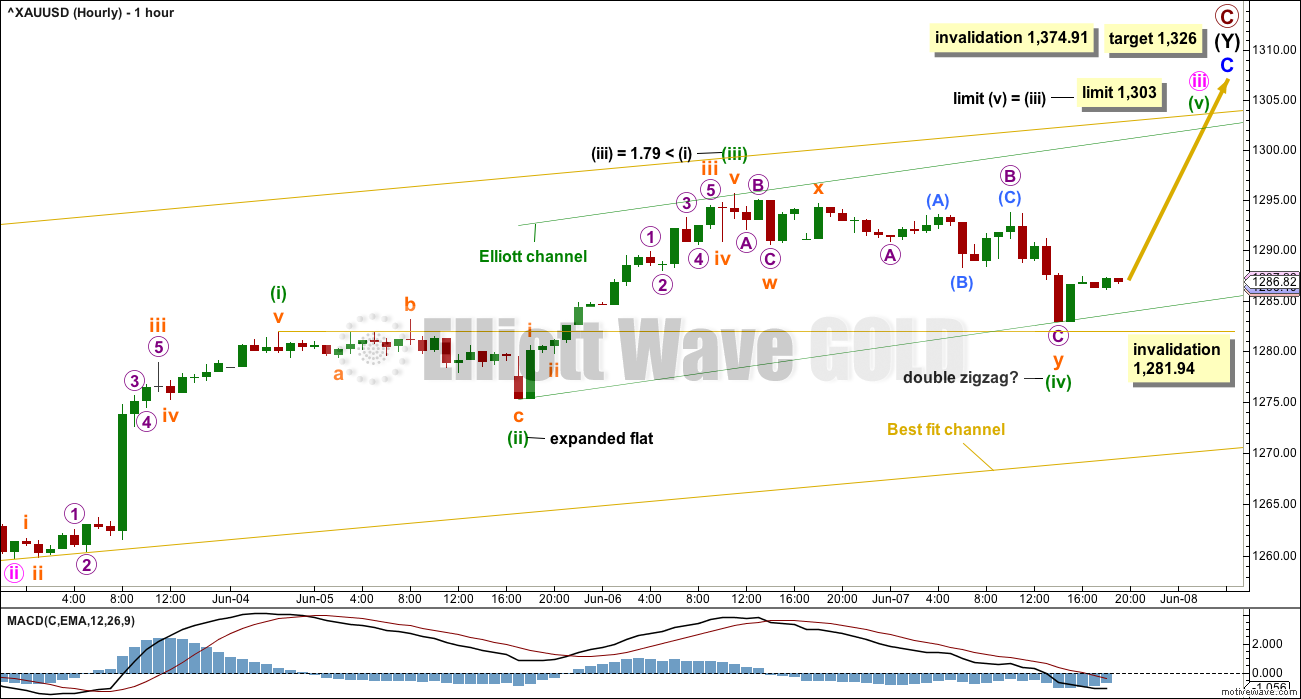
The hourly chart shows the extension of minute wave iii so far.
Within minute wave iii, so far there is a Fibonacci ratio of equality between minuette waves (i) and (iii), with minuette wave (iii) slightly shorter than minuette wave (i). This limits minuette wave (v) to no longer than equality in length with minuette wave (iii) at 20.35, so that minuette wave (iii) is not the shortest actionary wave and the core Elliott wave rule is met.
There is strong resistance about 1,305 to 1,310. The limit for minute wave iii would see price pause for a consolidation close to this resistance zone. This would also see the measured rule target given in the classic analysis section below almost reached.
Minuette wave (ii) was an expanded flat correction. Minuette wave (iv) may be unfolding as a double zigzag, which would exhibit alternation.
Minute wave ii lasted a few days. Minute wave iv now shows up clearly on the daily chart giving this part of the wave count the right look.
Minuette wave (iv) may not overlap back into minuette wave (i) price territory below 1,281.94. It should be assumed that the current correction is minuette wave (iv) while price remains above this point. If price moves below 1,281.94 by any amount at any time frame, then the wave count would see minute wave iii complete at the last high and the correction would be moved up one degree to minute wave iv. The invalidation point would then be the same as on the daily chart at 1,269.45.
WEEKLY CHART II
Click chart to enlarge.
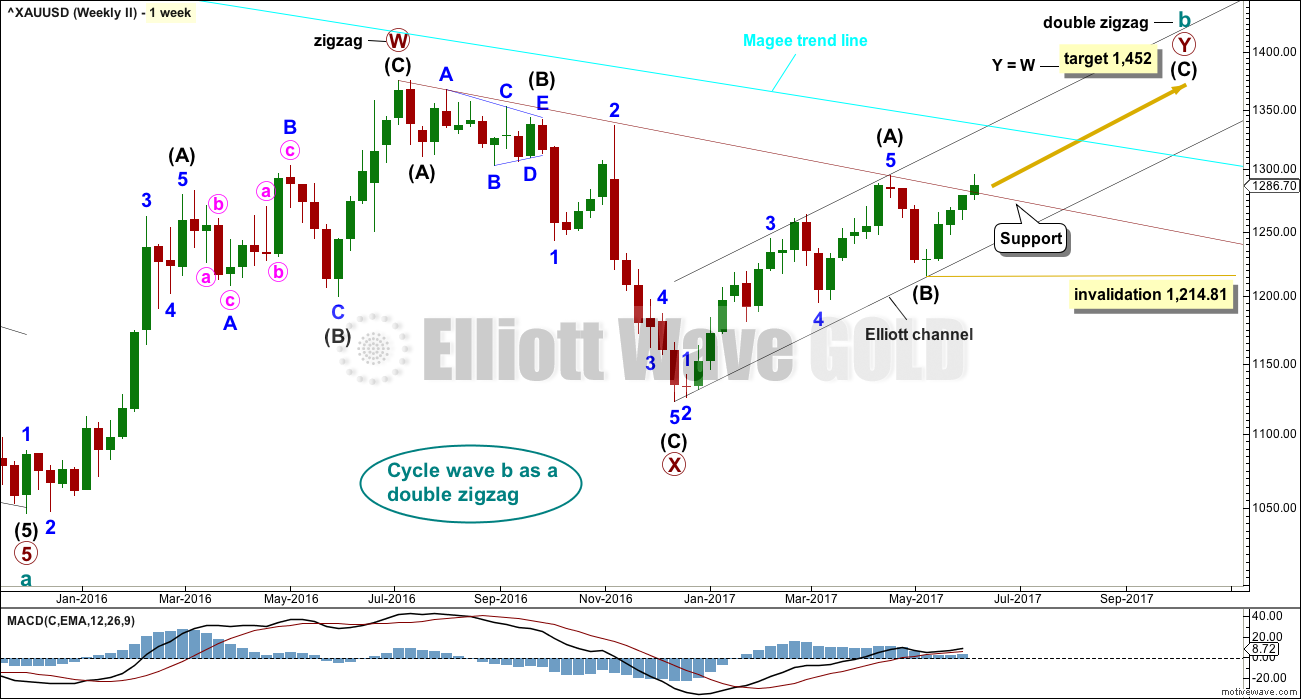
It is also possible that cycle wave b is a double zigzag, but this does not have as good a look nor as good a fit as the triangle idea, so it is less likely.
The purpose of double zigzags is for the second zigzag to deepen the correction when the first does not move price deep enough. Double zigzags normally have a strong slope against the prior trend. To achieve this purpose and to have a strong slope their X waves are normally shallow and also very often brief. Here, primary wave X is neither shallow nor brief. This does not have the right look.
Within primary wave Y, the structure of intermediate wave (A) looks like a three and not a five.
To see intermediate wave (A) over sooner, at the high labelled minor wave 3, would see the low of intermediate wave (B) breach the lower edge of an Elliott channel. And so this would resolve the problem of intermediate wave (A) not looking like a five, but would introduce a new problem of price not fitting correctly within a channel.
The target remains at 1,452.
Within intermediate wave (C), no second wave correction may move beyond the start of its first wave below 1,214.81.
ALTERNATE WAVE COUNT
MONTHLY CHART
Click chart to enlarge.
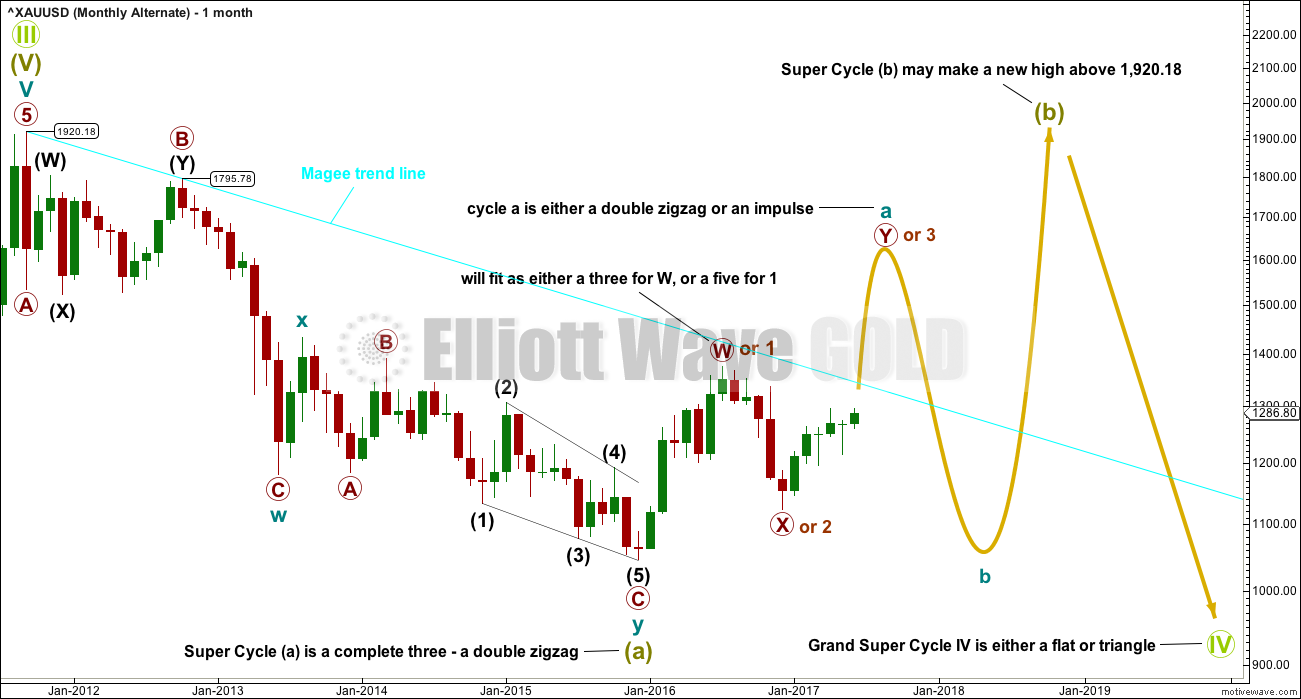
It is possible that Super Cycle wave (a) is already complete as a double zigzag. This downwards wave has a very good fit as a double zigzag and the problem of a small truncation on the main wave count is avoided.
If the first wave of Super Cycle wave (a) is a three, then Grand Super Cycle wave IV may be either a flat, combination or triangle. It may not be a zigzag.
However, a combination may be eliminated if the first wave is a multiple. The maximum number of corrective structures within a multiple is three, so to label multiples within multiples increases the number of structures beyond three and violates an Elliott wave rule.
Grand Super Cycle wave IV may be only a flat or triangle. Within both of these structures, Super Cycle wave (b) may make a new high above the start of Super Cycle wave (a) as in an expanded flat or running triangle. Super Cycle wave (b) would be very likely to be a very deep correction. It would most likely be a zigzag to achieve the depth required for a flat correction, but it may also be an expanded flat. If it is a zigzag, then cycle wave a would have to subdivide as an impulse.
WEEKLY CHART I
Click chart to enlarge.
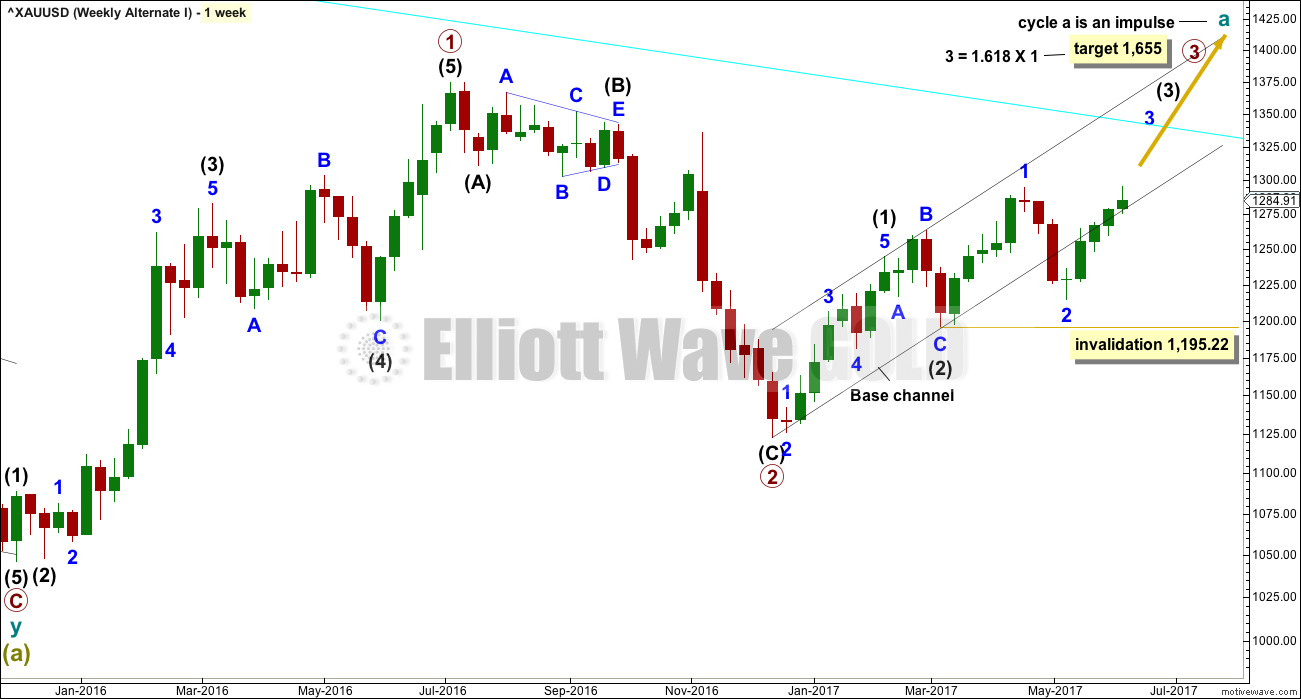
If cycle wave a is subdividing as an impulse, then it should now be entering the middle of its third wave. The strong breach of the lower edge of the base channel substantially reduces the probability that a big third wave is imminent.
It does not have a good fit to try and see intermediate wave (1) over at the high labelled minor wave 1; to see the upwards wave from the low in December 2016 to the last high in April as a completed five wave impulse is very forced.
WEEKLY CHART II
Click chart to enlarge.
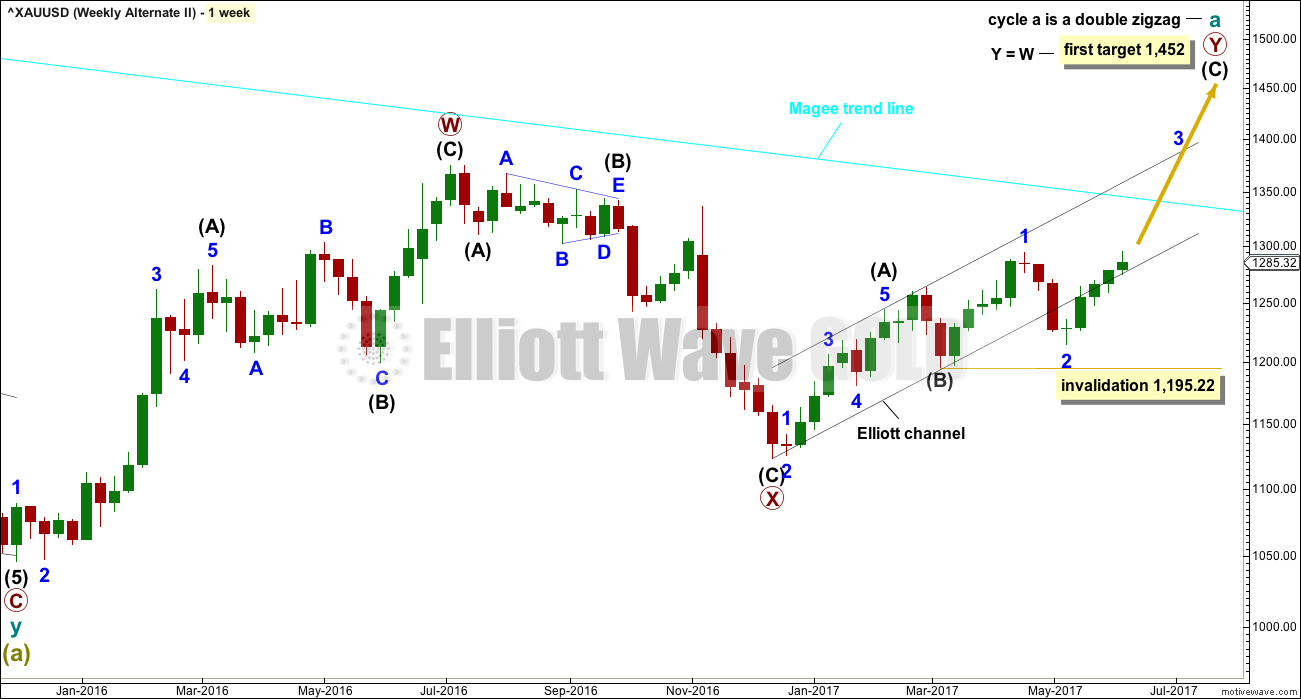
It is also possible that cycle wave a is subdividing as a double zigzag. The upwards wave from the low of December 2016 may be the second zigzag in a double.
The problem here is not a base channel, although it is drawn the same. The problem here is price has now substantially and clearly broken below the lower edge of the Elliott channel, which should provide strong support for primary wave Y as it moves higher.
Although technically cycle wave a could be labelled as complete at the April high, that would look very wrong. The purpose of the second zigzag in a double is to deepen the correction when the first zigzag does not move price deep enough. This second zigzag has not reached beyond the end of the first. This would not correctly be termed a truncation but the effect is the same. Here, it would be too severe for reasonable consideration.
TECHNICAL ANALYSIS
WEEKLY CHART
Click chart to enlarge. Chart courtesy of StockCharts.com.
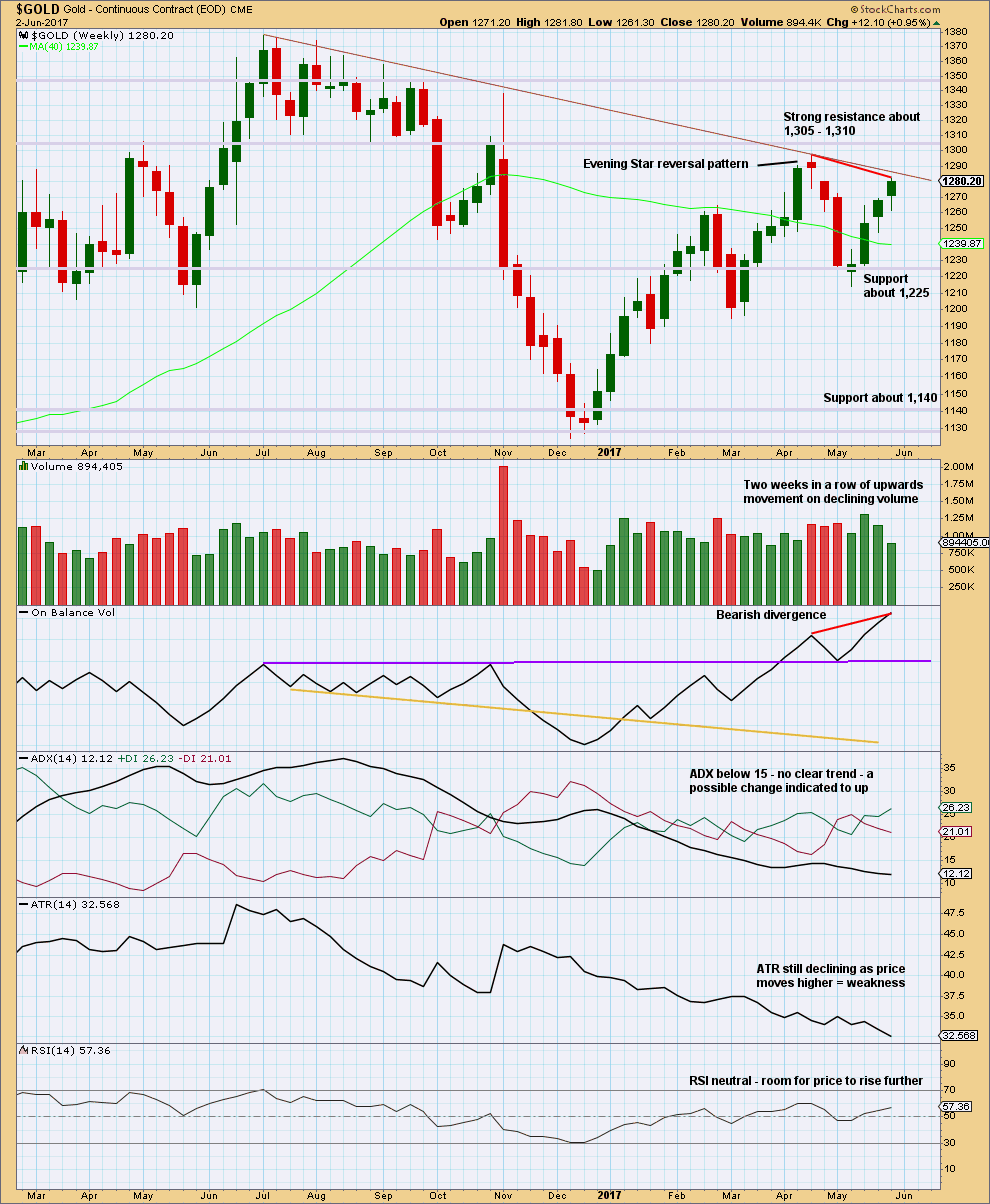
Last week completes an Advance Block candlestick pattern. This is a three candlestick pattern; three green candlesticks with the second and third candlesticks showing signs of weakening. However, this pattern does not come within a mature upwards trend, so the warning is weak and further weakened by the longer lower wicks on the last two candlesticks, which are bullish.
Declining volume along with declining range is bearish.
Strong divergence between price and On Balance Volume is bearish.
There is still room for price to rise further, but the short lived upwards trend at this time looks weak.
The maroon trend line is added to this weekly chart, using the same anchor points as the Elliott wave charts.
DAILY CHART
Click chart to enlarge. Chart courtesy of StockCharts.com.
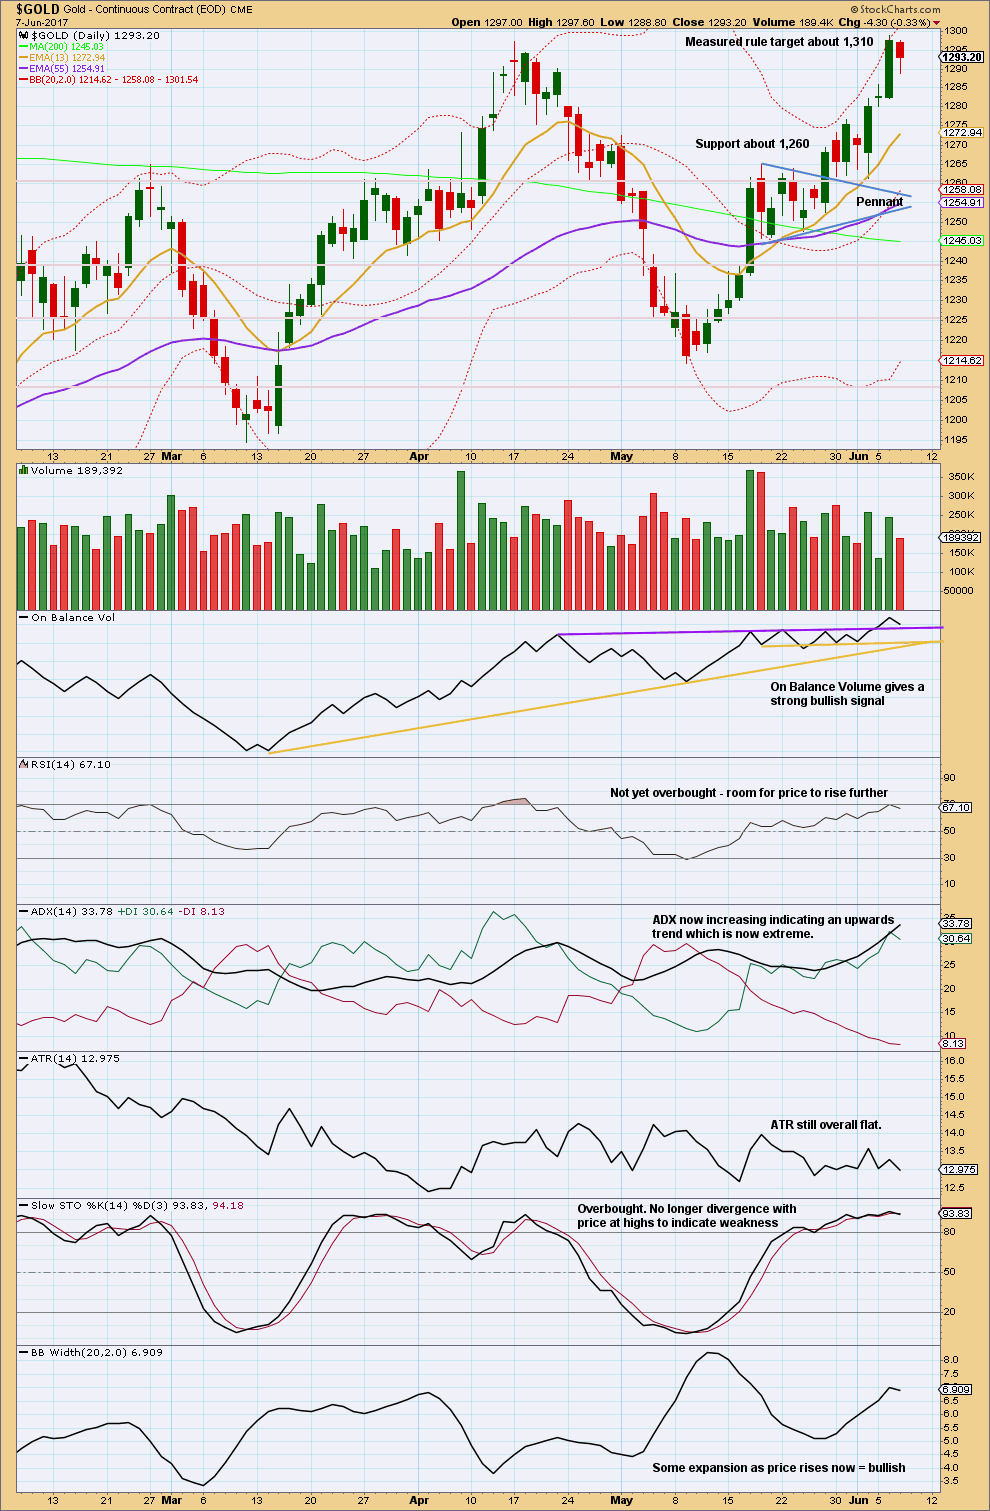
The pennant pattern suggests an upwards breakout (which happened) to be followed by more upwards movement to the target at 1,310. So far it looks like this target may be met now.
The long lower wick and decline in volume for downwards movement during today’s session is bullish.
On Balance Volume may be at support today.
Expect a green daily candlestick tomorrow.
GDX
DAILY CHART
Click chart to enlarge. Chart courtesy of StockCharts.com.
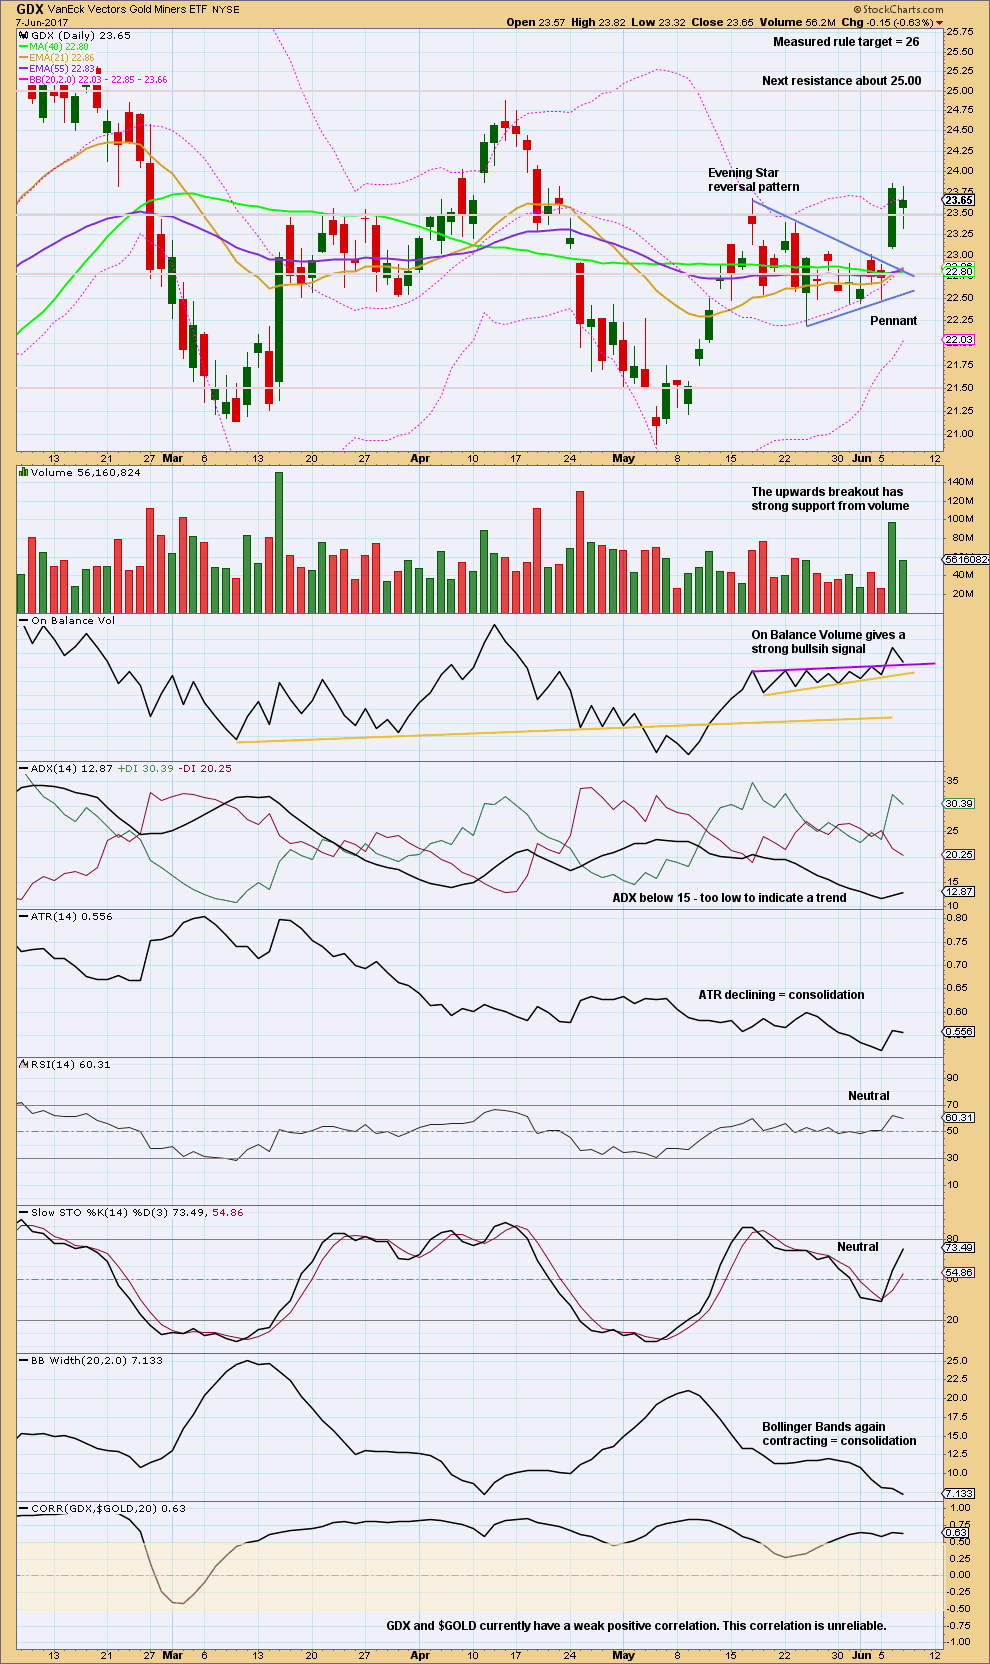
Today’s spinning top candlestick puts the trend into a temporary neutral. The lower wick is slightly longer than the upper wick; this is very slightly bullish.
On Balance Volume is at support for both Gold and GDX.
There is room for price to continue rising; RSI is not overbought and nor is Stochastics.
This analysis is published @ 09:00 p.m. EST.
The correction if it is a fourth wave must be over. There’s no room left for it to move into. Price has bounced off the lower edge of the best fit channel.
The lower wick today is bullish. If volume shows a decline then we may have some small confidence in a new high.
On the EW count, have we finished minute iv and are in minute 5 now? Maybe just finished a 1st wave up within that? I do not know heads or tails on EW count of a minute 4 since 6-6 highs. Help.
Gold could still fall off a cliff (move way below $1,269.45), if Comey-gate turns out to be a dud and if T. May has a better election than anticipated by the opinion poles. Would invalidate the bullish EW-count and reinstate a bearish EW-count.
Looks like Gold will stay on a buy and USD will stay on a sell, at least for one more day. Let’s see if it can hold
Comey gate certainly was a dud, although that had been very much telegraphed during yesterday’s trading session. But it appears that the UK election results were surprising and may have saved the uptrend in gold. Will see how this develops during the evening and overnight. IMHO gold will need to do more than just hover around 1280 or it may carve out a right shoulder of an ominous topping pattern with negative divergence on the daily chart. Need new highs soon or the uptrend may fail.
From where I sit, gold needs to quickly move up a few dollars, and before the end of this trading day, or it will start to get pretty bearish on the daily chart and generate a sell signal. This at the same time as the US Dollar is generating a buy signal. Most unexpected but that’s what my charts are saying
Looks like you may get your wish? Good call
It’s not holding. Bearish now until proven otherwise 🙁
actually, looking at EOD numbers, USDollar still on a sell, and gold had a stick save to live, by the smallest of margins, for another day. Bulls still alive, but not for long unless we see some upside strength from here
Good chance the bottom is in for gold at 1,271.88 and GDX at 23.04 🤞
Your insight is always appreciated. Thanks for the statement to settle some nerves on an epic bull trap. With all of Lara’s charts pointing up, I thought we were in great shape.
If you don’t mind sharing some more, will you be holding through the Fed decision on June 14th? Expectations are that the Fed will raise rates which certainly isn’t favorable for Gold or GDX.
Stephen, playing it day by day right now. Still looking for GDX to get into the upper 24 range. Will post more later. 🙂
Did one hourly got invalidated? According to Pmbull low this hour is 1281.468
Ichimoku Gold Update
Data as at 8:45 am ET June 8
========================
So, gold price has dropped below 1281.94. All Lara’s counts have to be moved up one degree. That is, the high at 1295.65 becomes Minute 3 in Weekly I, and minuette 3 in Weekly II and the Alternate charts.
Now, the critical price level to watch is the 1275 level. In the 4-hourly chart, support is 1277.93 kijun-sen. And, if price does drop below 1269.45, then that’s interesting …
Ichimoku Gold Hourly Analysis
Data as at 4:40 am ET June 8
==========================
Gold prices fell slightly yesterday. On the hourly chart, this was alerted when the tenkan-sen crossed below the kijun-sen before the US market opened. The lower cloud boundary provided some support, halting the drop at 1282.84.
Gold price has broken out below the kijun-sen. This is the first bearish warning. Furthermore gold is, more often than not, trading below the tenkan-sen. Short-term support is given by the daily tenkan-sen at 1277.65 as discussed in the Daily Analysis. If this level is broken, a medium term top would be in and a correction towards the 1262, followed by the 1250 strong supports, would begin. I would not expect that to occur, but then with the high volatility today, anything can happen.
On the whole, gold is trading slightly below the bottom cloud boundary, trying its best to crawl back into the cloud but has been rejected on a few occasions. Until the tenkan-sen crosses the kijun-sen from below, and prices move past the top cloud boundary, today is going to be a day of consolidation, currently with a slightly bearish bias.
Ichimoku Gold Daily Analysis
Data as at 4:20 am ET June 8
=========================
The Daily Ichimoku Chart shows that the trend remains healthy. Although prices fell slightly yesterday, gold remains in a bullish trend; there is still no sign of a reversal. The tenkan-sen is comfortably camped above the kijun-sen, and gold trades above these two lines. The cloud remains green. This is the textbook strong bullish trend according to Ichimoku analysis.
High volatility is expected today due to a confluence of three high profile events: the UK polls, the Comey testimony and also the ECB rate decision. These are likely to pull the short-term price of gold in different directions. We already had a foretaste yesterday when gold prices fell slightly following the release of the prepared statement by James Comey, the ex-FBI director. Gold prices fell slightly only because there was no smoking gun. Had there been one, you can envisage the investor reaction …
Now, if prices should fall today, tenkan-sen support is currently at 1277.65, and I expect any drop to be contained by it. The 1275 level is a major psychological support. If, in the low probability scenario that this fails to occur, and price falls below 1269.45, then Lara’s Daily Chart of Weekly I is invalidated. We might then have to fall back on the Weekly II Chart with its happier target of 1452. Better yet, the highly optimistic Alternate Weekly Chart I.
Thanks Alan for both analyses.
Papudi. My pleasure.