
Downwards movement remained just above the invalidation point on the daily chart. The target is adjusted.
Summary: The Elliott wave target for upwards movement to end is now 1,308, just below the classic analysis target at 1,310, giving a $2 range with a reasonable probability.
Corrections are an opportunity to join the trend.
Always use a stop. Do not invest more than 1-5% of equity on any one trade.
New updates to this analysis are in bold.
Last monthly charts and alternate weekly charts are here, video is here.
Grand SuperCycle analysis is here.
WEEKLY CHART I
Click chart to enlarge.
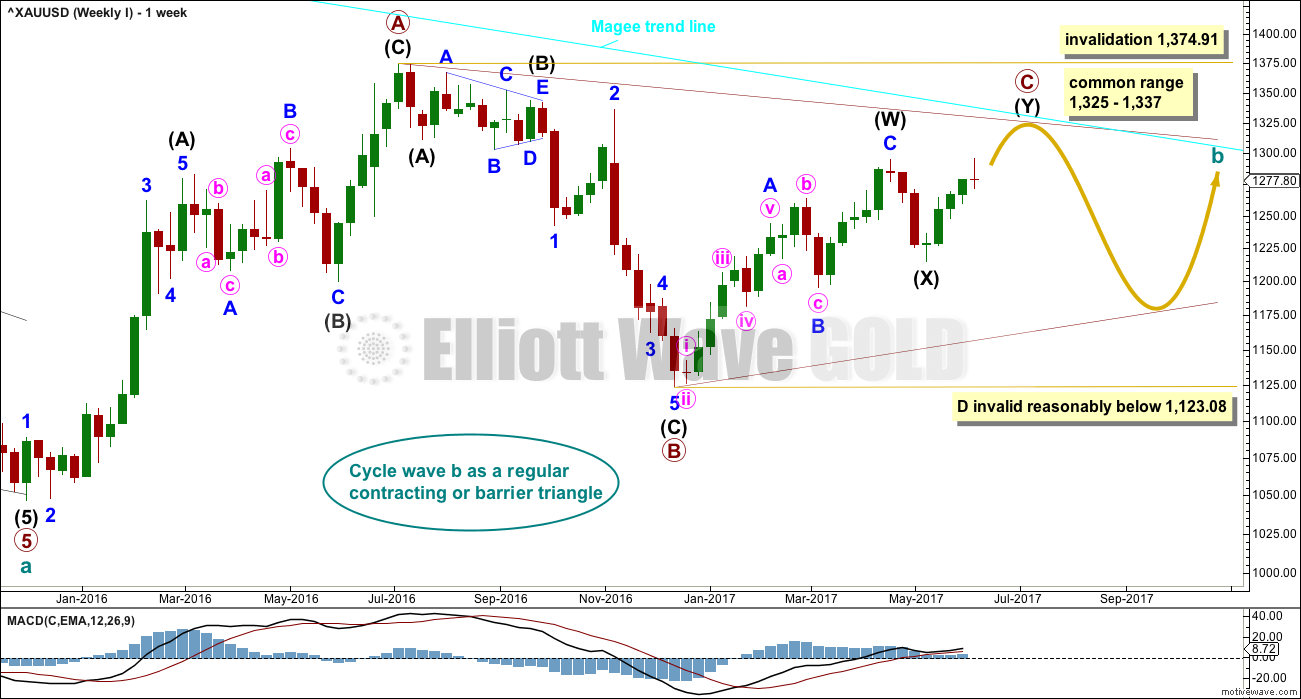
At this stage, all weekly charts published yesterday expect more upwards movement. Because there is no difference in the direction expected, only this one more likely weekly chart will be published on a daily basis.
The Magee bear market trend line is added to the weekly charts. This cyan line is drawn from the all time high for Gold on the 6th of September, 2011, to the first major swing high within the following bear market on the 5th of October, 2012. This line should provide strong resistance.
At this stage, a triangle still looks most likely and has the best fit for cycle wave b.
Within a triangle, one sub-wave should be a more complicated multiple, which may be primary wave C. Primary wave C may not move beyond the end of primary wave A above 1,374.91. This invalidation point is black and white.
A common range for the length of triangle sub-waves is from 0.8 to 0.85 the length of the prior wave in the opposite direction. This gives a range of 1,325 to 1,337 for primary wave C. The new target calculated today would see primary wave C end reasonably short of this common range.
When primary wave C is complete, then for a contracting triangle primary wave D may not move beyond the end of primary wave B below 1,123.08, or for a barrier triangle primary wave D may end about the same level as 1,123.08 (so that the B-D trend line is essentially flat; this invalidation point is not black and white).
Primary wave C may end when price comes up to touch the Magee trend line.
DAILY CHART
Click chart to enlarge.
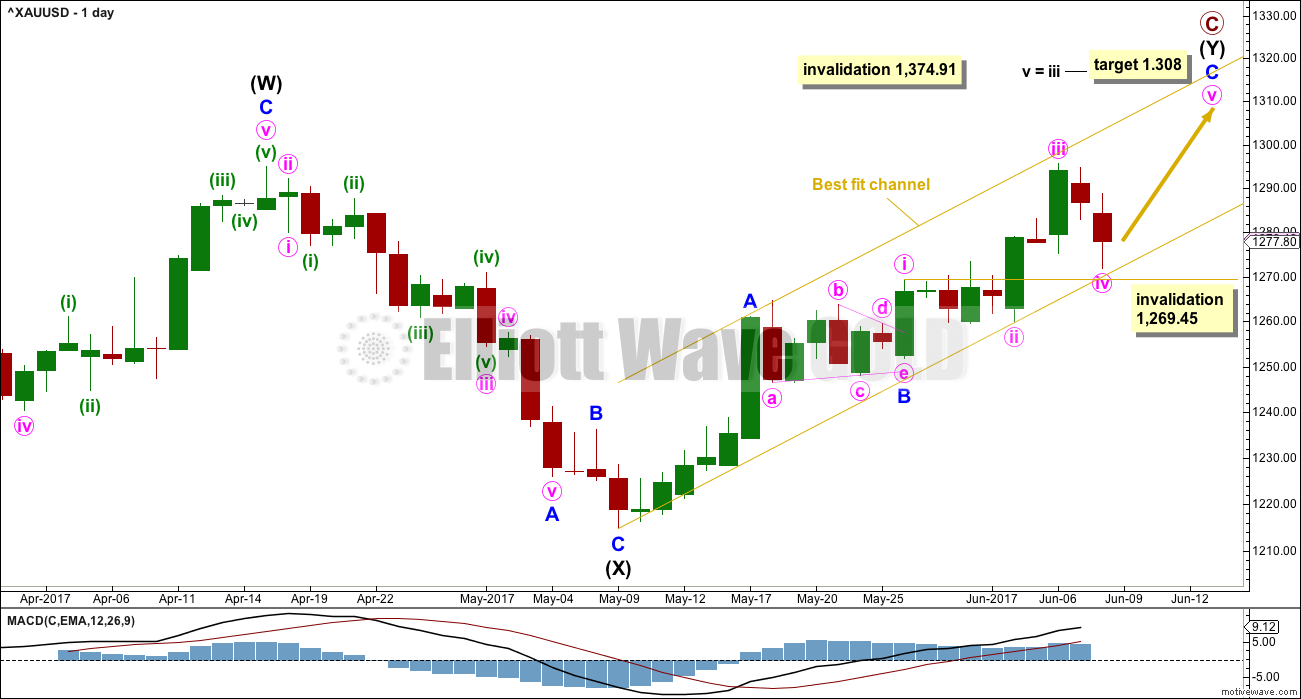
The new target calculated today would see price end at a zone of prior very strong support, about 1,305 to 1,310. This target would see primary C end short of its common range, which is okay. That is a rough guideline only and not a rule.
Intermediate wave (Y) is subdividing as a zigzag. So far minor waves A and B look complete and minor wave C looks incomplete. Within minor wave C, the correction for minute wave iv may not move back into minute wave i price territory below 1,269.45.
Minor wave C must end with an impulsive count of 5. This requires one final upwards wave.
HOURLY CHART
Click chart to enlarge.
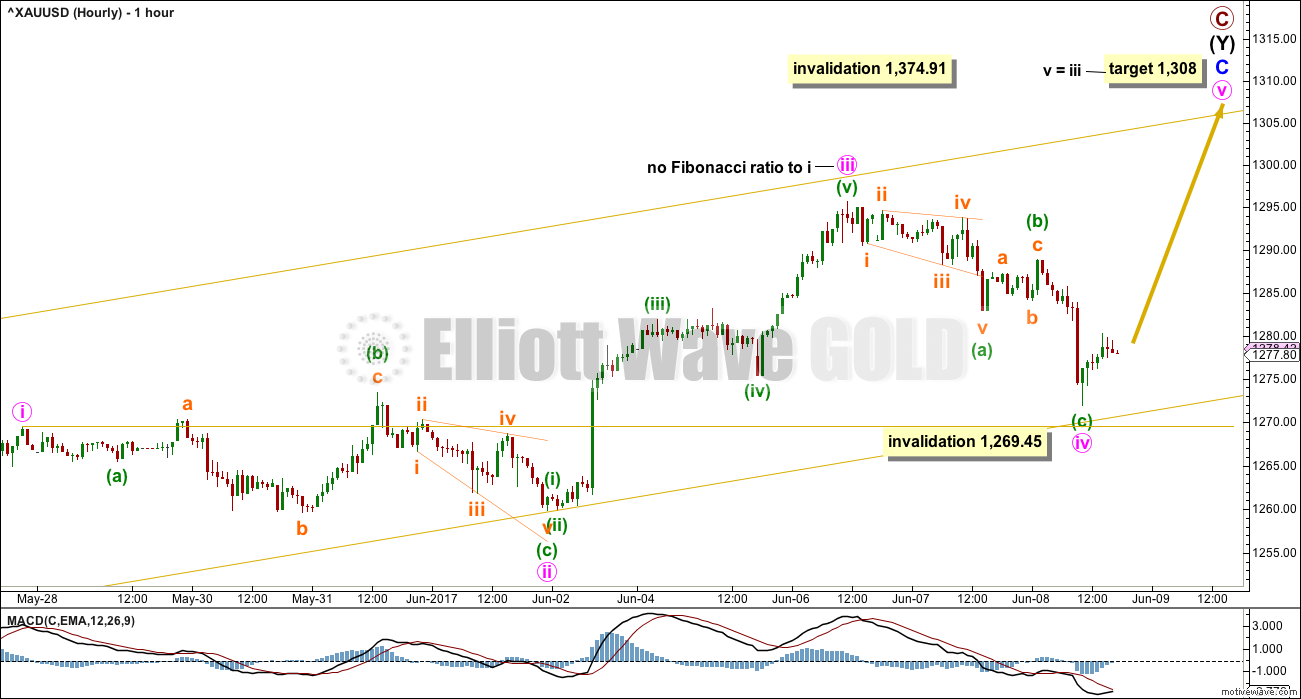
Downwards movement invalidated the last published hourly chart.
Downwards movement may still be minute wave iv as it has remained above first wave price territory. There is alternation between the expanded flat of minute wave ii and the zigzag of minute wave iv. Price remains within the best fit channel.
The target is recalculated. The ratio of equality with minute wave iii is chosen in this instance because it fits so neatly with the classic analysis target and a zone of very strong prior support, which should now offer resistance.
If this hourly chart is invalidated in the next 24 hours, then it would be possible that primary wave C could be over and primary wave D may be underway to move lower for about two to four weeks.
TECHNICAL ANALYSIS
WEEKLY CHART
Click chart to enlarge. Chart courtesy of StockCharts.com.
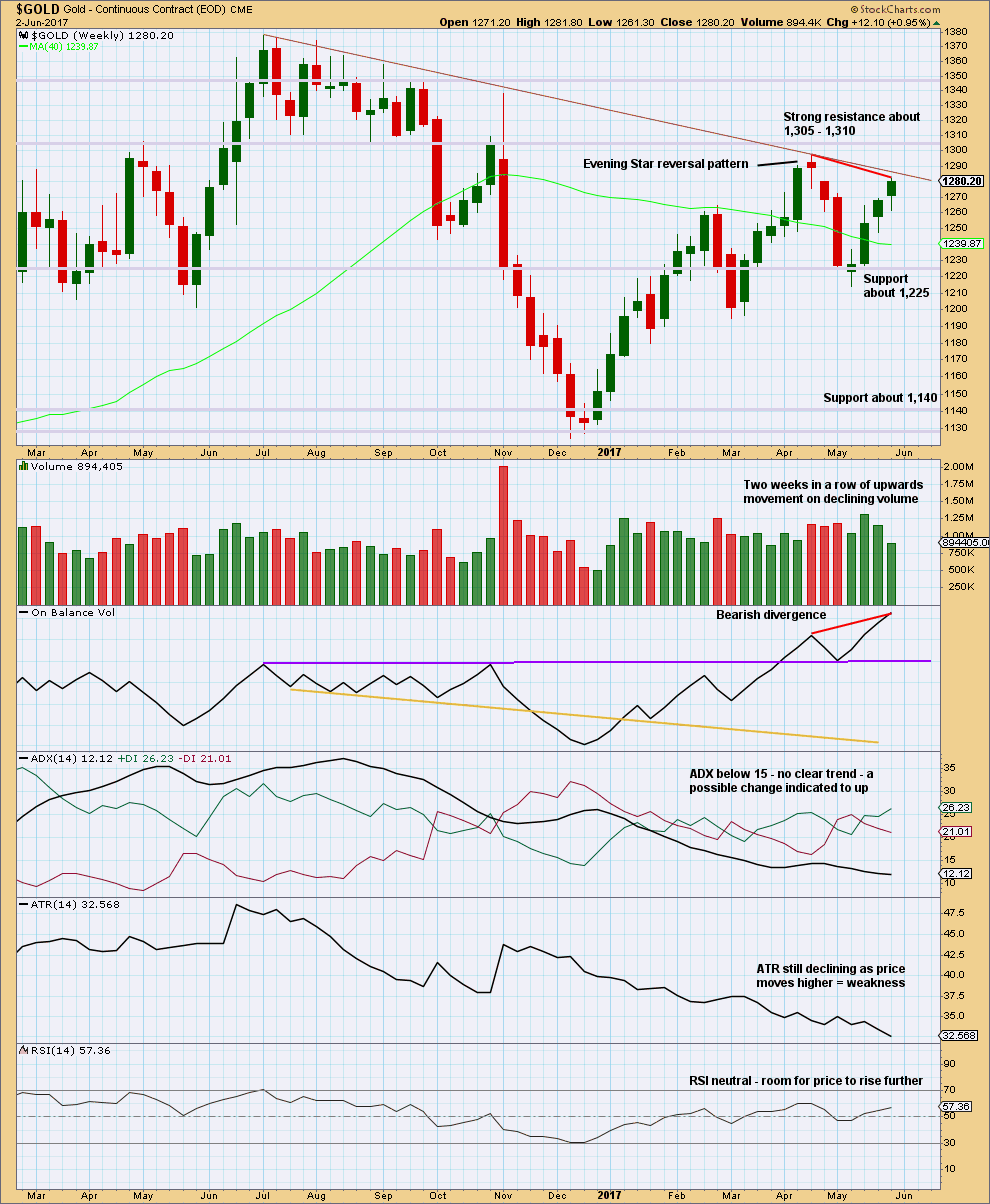
Last week completes an Advance Block candlestick pattern. This is a three candlestick pattern; three green candlesticks with the second and third candlesticks showing signs of weakening. However, this pattern does not come within a mature upwards trend, so the warning is weak and further weakened by the longer lower wicks on the last two candlesticks, which are bullish.
Declining volume along with declining range is bearish.
Strong divergence between price and On Balance Volume is bearish.
There is still room for price to rise further, but the short lived upwards trend at this time looks weak.
The maroon trend line is added to this weekly chart, using the same anchor points as the Elliott wave charts.
DAILY CHART
Click chart to enlarge. Chart courtesy of StockCharts.com.
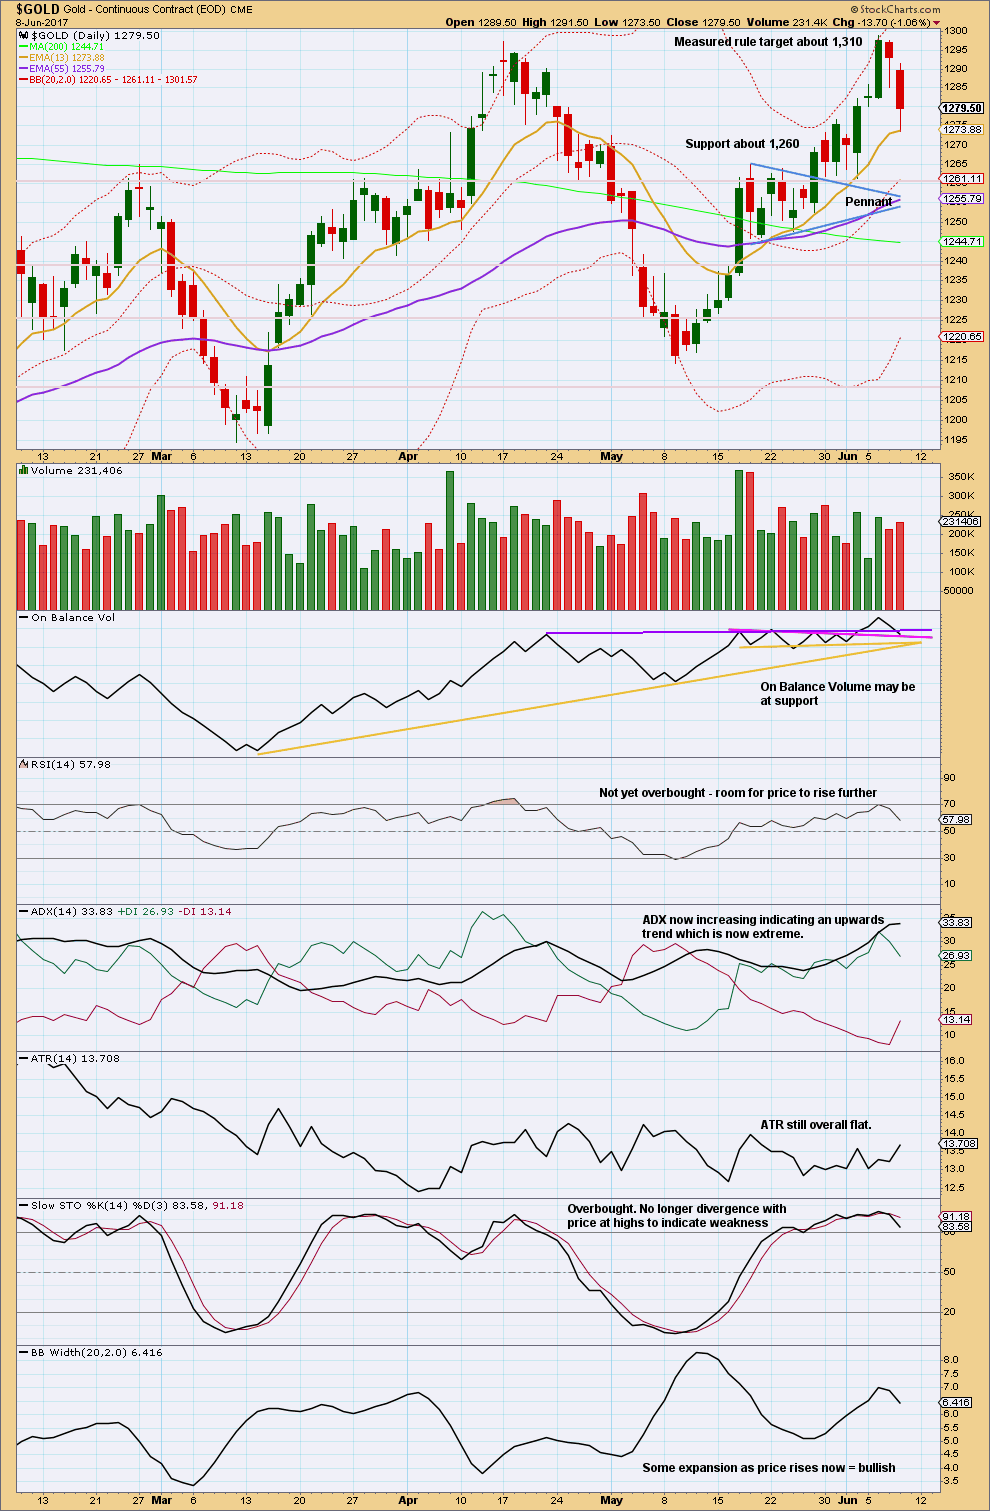
The pennant pattern suggests an upwards breakout (which happened) to be followed by more upwards movement to the target at 1,310. So far it looks like this target may be met now.
There is considerable leeway in exactly how the trend lines on On Balance Volume may be drawn. A new line is added in pink today. On Balance Volume has slightly breached the longer purple line and is now sitting on the shorter pink line. It may be at support today.
There is some increase in volume for today’s downwards movement and this is bearish. But volume for these two downwards days is still lighter than the prior upwards day, so it is not overly bearish. Another long lower wick is bullish.
With ADX extreme and Stochastics overbought, the upside is limited. The target looks about right.
GDX
DAILY CHART
Click chart to enlarge. Chart courtesy of StockCharts.com.
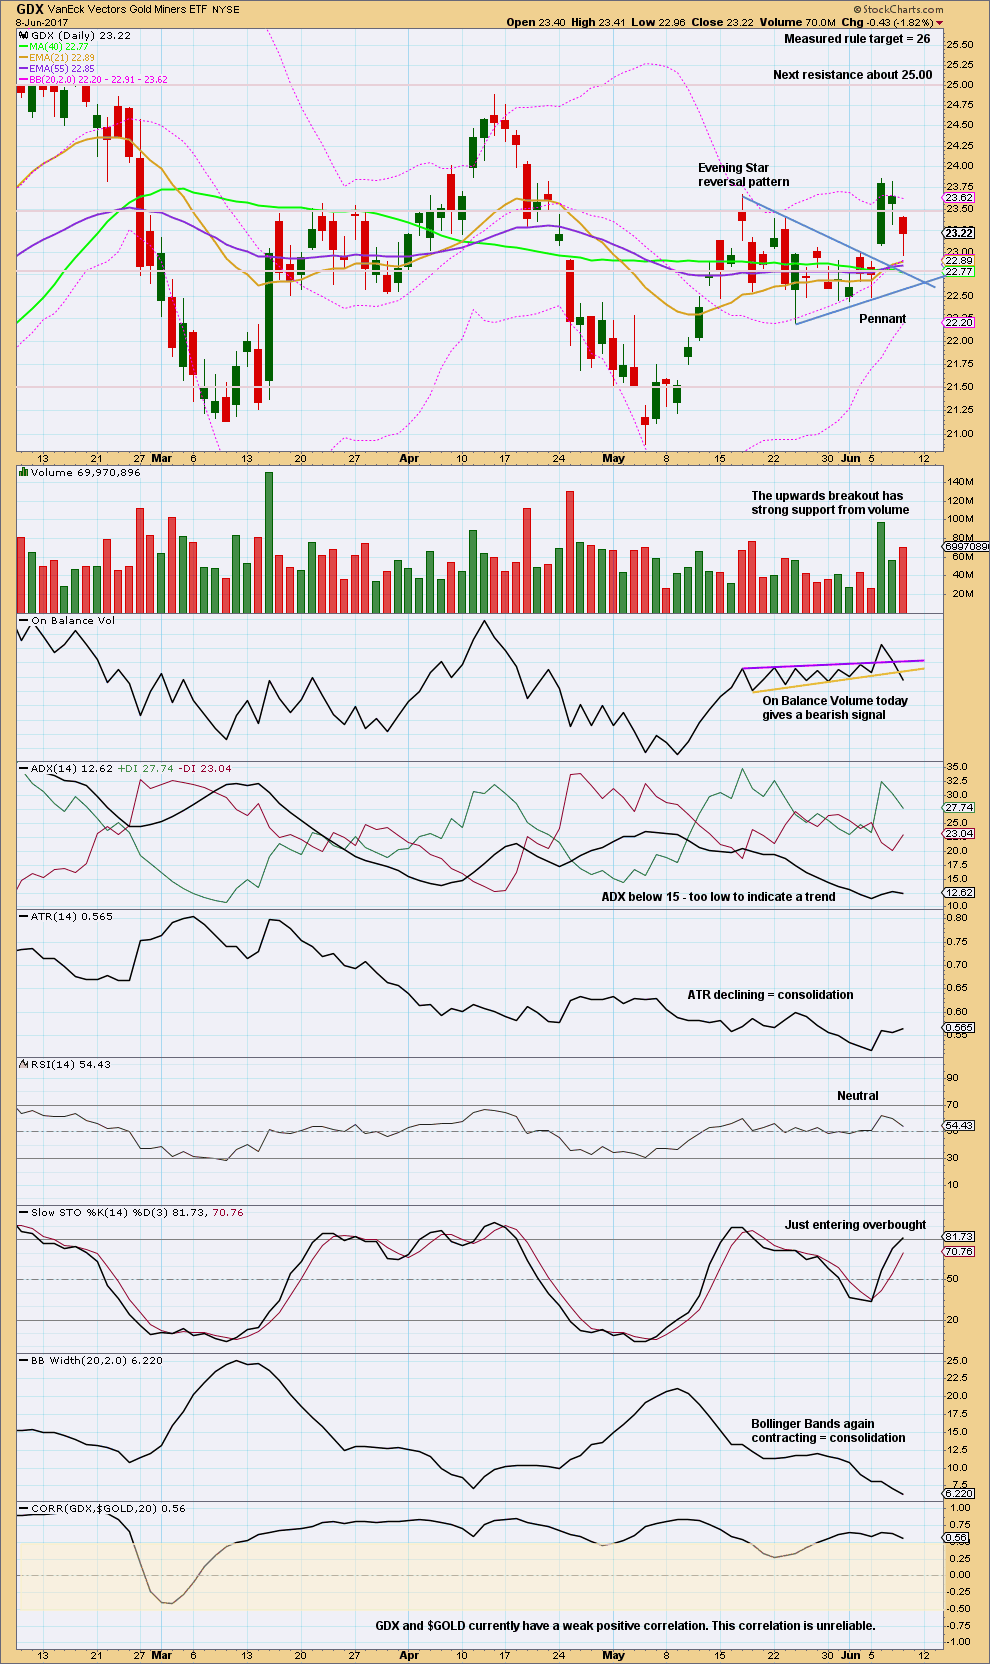
The long lower wick on today’s candlestick is bullish.
The bearish signal from On Balance Volume today should be given weight. The upside for GDX now may be very limited or over.
This analysis is published @ 06:06 p.m. EST.
A five down is close to completion. Minute v is extending.
When minor 1 is complete then minor 2 should bounce, maybe to the 0.618 Fibonacci ratio of minor 1. But minor 1 is incomplete so we don’t yet know where it’s 0.618 Fibonacci ratio is.
Price may bounce to find resistance at prior support, the lower edge of the best fit channel.
That would offer a nice entry to go short for a few days to a couple of weeks.
Hi Lara,
If minor 1 completes in 3 days, is there a time requirement for minor 2?
ECB rate decision – nothing.
Comey testimony – nothing.
UK election – May disaster
Happy day, for gold bears!
$1,269,45 has just been breached (on Trading View chart) , bringing into play a bearish EW-count, as described by Lara. Happy shorting, everybody.
Cant rule out a bounce from 1265-63-60 range for 1276+?
Well, there goes $1,265…
Syed.
My original trade scenario, given in the Hourly analysis stands. The first support is at 1262-1265 as you rightly pointed out. It that fails to hold, my other support levels will be used.
On the other hand, Lara’s Alternate could be used if the entry point for a long is lowered.
Thanks Alan, imo 1264 appears to be holding for now. Oversold stochastic seems to suggest a rise through 1281 for a test of 1292-95 unless Gold price remains curtailed under 1277…. Lets see how this plays out. Got stomped out of my longs earlier at 1289 on Wednesday, took to the sidelines and long again here at 1266 with a stop just below 1263 (20dma)…..
Syed. Good trade.
It does look like the dead cat bounce is underway. First subwave targets 1277-1278 like you said.
Alan, bailing out of my long at 1266. Expecting a pullback on Monday for both Gold & Silver. A break below 1263-59 looks to on the cards for Gold price….
What source is everyone using for their pricing in establishing these levels? New here and want to be on the same page for these detailed figures. Thanks for the help! Different sources seem to vary in the price as it is somewhat of an average it seems.
I’m using BarChart.com figures.
Now that you’ve had a comment approved, your comments won’t go into moderation.
I’m using BarCharts for price points to be consistent with Lara.
For Ichimoku charts, I have to use TradingView because the charts are drawn with it. The price differential is not that great.
Flash Update of Hourly Ichimoku Analysis
===================================
With prices dropping below yesterday’s low of 1271.88, the Alternate Hourly seems more likely. The new low, currently at 1271.56, would be Minute 5.
I would amend my short trade to begin at the top of the dead cat bounce, as Lara suggested. That point would be Minor 2, which means the move up would be a 3-wave structure, and may not be complete by today, so I’ll do a NUGT scalp instead. I would expect prices to be rejected at or below the hourly bottom cloud boundary, currently at 1287.25. For the short trade, my targets remain the same: that would be the trade for Minor 3.
New alternate chart update:
A five down now looks complete. This structure fits the idea that we now have a high in place, but that cannot be confirmed until price invalidates the main wave count published in the analysis above with a new low below 1,269.45.
A possible trading strategy:
I expect Friday’s session to be volatile.
If price makes a new high above 1,295.65 then enter long for a target 1,308 – 1,310.
On the short side, wait for a new low below 1,269.45 to enter short, stops above 1,295.65, target 1,214.
A higher risk strategy for those with a greater risk appetite: enter short if price reaches up to 1,286 with a stop just above 1,295.65. Target 1,214 for now. Risk no more than 3% on this idea.
Always use a stop. Do not invest more than 1-5% on any one trade.
I know I keep repeating myself, but that’s because risk management is the single most important aspect of trading.
It’s late now here, I’m off to set orders and sleep. Good luck everybody. See you tomorrow.
Wonderful, Lara.
Minor 2 agrees with the Ichimoku cloud bottom boundary, currently at 1287.25.
Excellent. I’ll be waiting for that bounce to enter short.
Ichimoku Gold Hourly Analysis
Data as at 3:55 am ET June 9
==========================
Gold price action proceeded precisely according to plan yesterday. Following my warning of an impending drop in gold prices with the tenkan-sen crossing below the kijun-sen, prices upped the ante by breaking below the tenkan-sen before being cushioned at the 1272 strong support. This fast and furious action was all over in a little less than 2 hours. My small scalp of DUST netted a couple of grand which was satisfying.
Today, the Hourly Ichimoku chart shows a more bleak picture. The gap between the tenkan-sen and the kijun-sen widened, pointing to an increase in momentum for a further drop. Meanwhile, the cloud has turned red, indicating an imminent trend change from bull to bear. As I pointed out yesterday, and I quote, “Short-term support is given by the daily tenkan-sen at 1277.65 as discussed in the Daily Analysis. If this level is broken, a medium term top would be in and a correction towards the 1262, followed by the 1250 strong supports, would begin. (sic)” I did not expect this to happen yesterday: the conditions were not ripe yet. Today, the prospects for this has increased.
I am tempted again to scalp DUST when the market opens. My trade will be as follows:
Entry point = 1269.00, slightly below Lara’s invalidation point of 1269.45.
Stop = 1271.88, yesterday’s low.
First target = the daily tenkan-sen support, currently 1255.23.
Second target = the lower cloud boundary, currently 1245.30.
If prices fall below 1245.30, then load up the truck for a waterfall.
On the other hand, I’ll go temporarily long IF tenkan-sen does manage to cross over the kijun-sen from below.
Stop = crossover point.
First target = lower cloud boundary on the Daily Chart, currently 1287.25.
Long again if prices rise above upper cloud boundary on the Daily chart, currently 1289.25.
You may also want to follow Lara’s excellent trading advice posted at 9:54 pm yesterday.
I’ll wait for further developments before making a final decision. There are a good 5 hours before markets open, and anything may happen in this period of simmering volatility.
Thank you Alan for outlining how you’re trading this. That’s invaluable advice, and very powerful in conjunction with your analysis.
Ichimoku Gold Daily Analysis
Data as at 3:40 am ET June 9
=========================
Gold markets fell rather significantly yesterday to the 1272-1275 level. Prices found a bit of support there and formed a hammer on the hourly chart. Sparing the 1269.45 level, the market ought to go higher today to test 1295.65, the last recorded high.
The Daily Ichimoku Chart shows that the trend remains moderately healthy. Although prices fell strongly yesterday, gold is still in a bullish trend. The tenkan-sen is comfortably camped above the kijun-sen, and gold trades just around and below the tenkan-sen. The cloud is still green.
Now, if prices do not obey the scenario depicted above but continue to fall, then the chance of a breach of 1269.45 increases. The tenkan-sen barely supports prices, being currently at 1277.65. The next support levels are kijun-sen at 1255.23, followed by the top cloud boundary which is sloping downwards with time. The last defence is the bottom cloud boundary at 1245.30. Any drop below that and we are in entrenched bear territory.
From a fundamental viewpoint, the ECB proved to be a non-event. The British polls went awry with Theresa May suffering a major setback; her arrogance proved to be her undoing. The strong outcome of a hung parliament, and with it Brexit coming to a standoff, should stimulate Euro/USD to rise. The reduced dollar strength enabled gold prices to breathe a sigh of relief, cushioning the seeming waterfall. Now, the short-term future direction of gold will apparently hinge on the Comey testimony.
My main GDX count is still intact, but it needs gold to move higher tomorrow toward Lara’s 1,308 – 1,310 target.
Concern if GDX moves below today’s low @ 22.96.
Invalidation if GDX moves below 22.49
https://www.tradingview.com/x/xrdeMeQx/
The end of minor 2 looks like it’s come to sit right on the upper edge of that triangle trend line. A typical curve back to retest support at prior resistance.
Now, as we know from a recent GDX example, that doesn’t always work out. But it works more often than not, so my money would be on GDX moving up and away as your wave count expects.
Thank you very much Dreamer for continuing to share your wave counts and analysis. It is greatly appreciated 🙂 🙂 🙂
After some consideration for an alternate, this is how may look if price makes a new low below 1,269.45 in the next 24 hours.
Primary C could be over. Primary D could be in the early stages.
Within the first five down minute iv may not move into minute i price territory above 1,282.87.
A possible trading strategy for the next 24 hours:
If price makes a new high above 1,282.87 (before a new low), enter long with stops just below the last low at 1,271.88. Target 1,308 – 1,310. This strategy uses the main hourly wave count.
If price makes a new low first though below 1,271.88 then this alternate hourly wave count may be more likely.
If price makes a new low below 1,269.45 enter short. Using the alternate hourly wave count above. Technically stops should be just above the last high at 1,295.65; the upcoming correction for minor 2 could be deep but it may not move beyond the start of minor 1.
Alternately, if the main count is invalidated with a new low below 1,269.45 then wait for a second wave bounce (dead cat bounce) to enter short at a better price. Stops still just above 1,295.65.
Always use a stop. Trading without stops exposes all your equity to risk, that’s how novices wipe out their accounts at least once.
Do not invest more than 1-5% of equity on any one trade. Risking more means decisions are based upon greed, again a novice mistake that could see your account wiped out.
// If this hourly chart is invalidated in the next 24 hours, then it would be possible that primary wave C could be over and primary wave D may be underway to move lower for about two to four weeks. // Inclined to echo the bearish sentiments of Claus M. Christensen & Eli expressed overnight. Expecting both Gold & Silver to pullback; a break below 1273/1269.45 invalidation looks imminent.