
Stops are now protecting profit on short positions. The target remains the same.
Members this week may have a little more confidence in the main Elliott wave count now that an alternate has been invalidated.
Summary: Adjust the best fit channel very slightly using the anchor points given on the daily chart. Price remains just within the channel.
Advice today is to wait another day to see if a downwards reaction will result from resistance here. Bullish divergence again with RSI at oversold on the 21st of June may indicate another very deep bounce could develop here.
Pull stops down to about 44.10 to protect profit.
If the channel is breached tomorrow, exit short positions and step aside. If the channel provides resistance, then consider adding to short positions.
Hold onto short positions for a target at 35.82 in the first instance.
New updates to this analysis are in bold.
MONTHLY ELLIOTT WAVE COUNT
Click chart to enlarge.
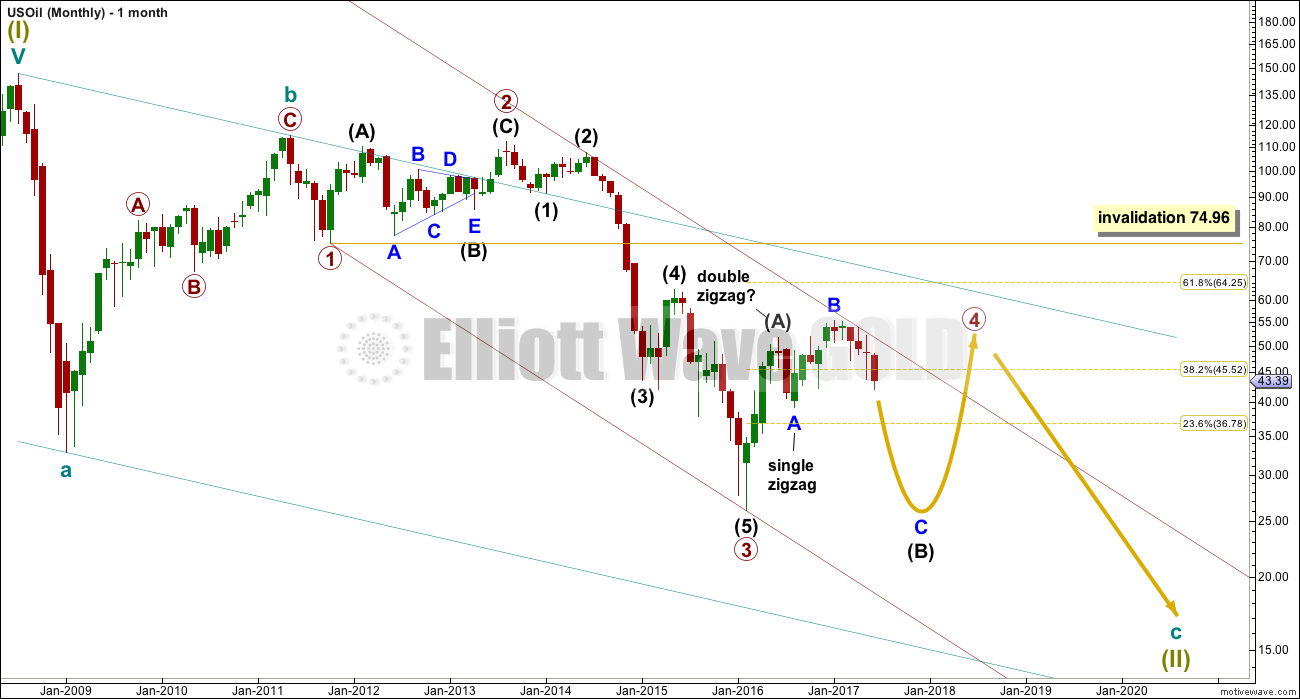
Within the bear market, cycle wave b is seen as ending in May 2011. Thereafter, a five wave structure downwards for cycle wave c begins.
Within cycle wave c, at this stage it does not look like primary wave 5 could be complete. That would only be possible if primary wave 4 was over too quickly.
Primary wave 1 is a short impulse lasting five months. Primary wave 2 is a very deep 0.94 zigzag lasting 22 months. Primary wave 3 is a complete impulse with no Fibonacci ratio to primary wave 1. It lasted 30 months.
Primary wave 4 is likely to exhibit alternation with primary wave 2. Primary wave 4 is most likely to be a flat, combination or triangle. Within all of these types of structures, the first movement subdivides as a three. The least likely structure for primary wave 4 is a zigzag.
Primary wave 4 is likely to end within the price territory of the fourth wave of one lesser degree; intermediate wave (4) has its range from 42.03 to 62.58.
If primary wave 4 is incomplete, then it looks like it may not remain contained within the channel. Sometimes fourth waves overshoot channels and this is why Elliott developed a second technique to redraw the channel when it does not contain a fourth wave.
Primary wave 4 is most likely to be shallow to exhibit alternation in depth with primary wave 2. So far it has passed the 0.382 Fibonacci ratio at 45.52. It may now continue to move mostly sideways in a large range. The alternate wave count below looks at the possibility that it may be very close to completion.
Primary wave 4 may not move into primary wave 1 price territory above 74.96.
At this stage, primary wave 4 has completed intermediate wave (A) only. Intermediate wave (B) is incomplete.
WEEKLY ELLIOTT WAVE COUNT
Click chart to enlarge.
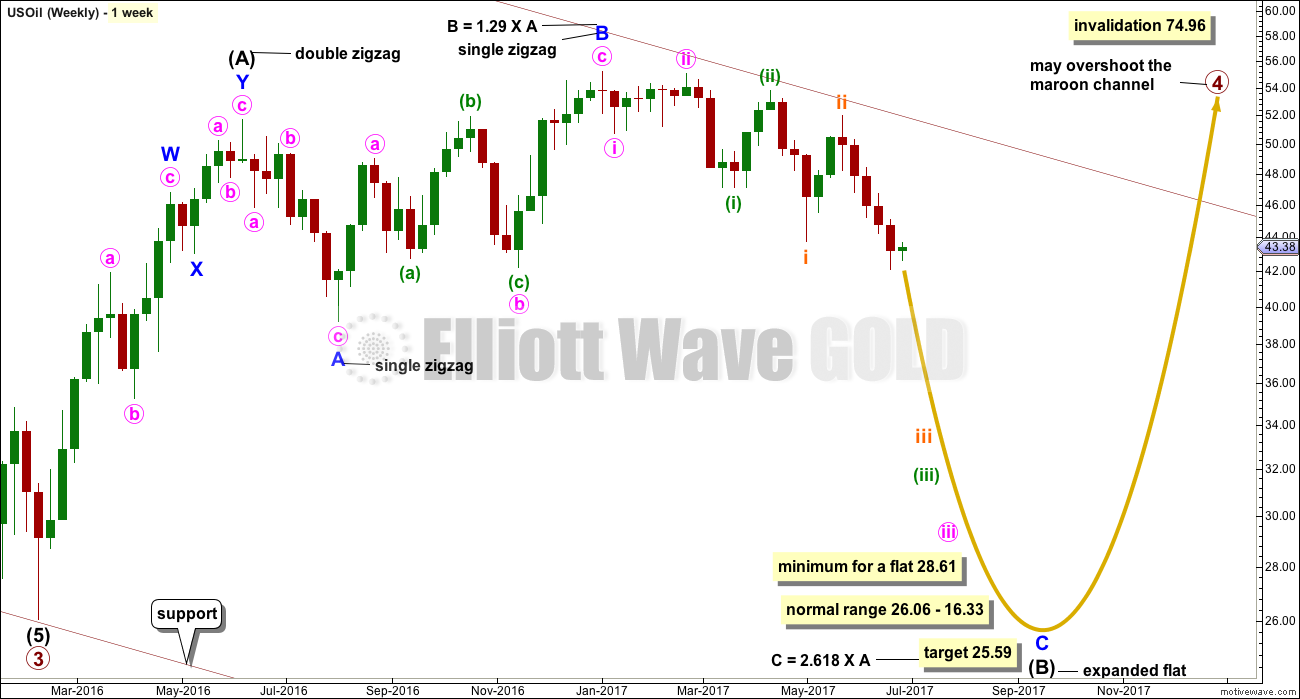
The whole structure of primary wave 4 is seen here in more detail.
The first wave labelled intermediate wave (A) is seen as a double zigzag, which is classified as a three.
Intermediate wave (B) is also a three. This means primary wave 4 is most likely unfolding as a flat correction if my analysis of intermediate wave (A) is correct. Flats are very common structures.
Intermediate wave (B) began with a zigzag downwards. This indicates it too is unfolding most likely as a flat correction.
Within intermediate wave (B), the zigzag upwards for minor wave B is a 1.29 correction of minor wave A. This indicates intermediate wave (B) may be unfolding as an expanded flat, the most common type.
The normal range for intermediate wave (B) within a flat correction for primary wave 4 is from 1 to 1.38 the length of intermediate wave (A) giving a range from 26.06 to 16.33.
Primary wave 4 may not move into primary wave 1 price territory above 74.96.
Within the larger expanded flat correction of primary wave 4, intermediate wave (B) must retrace a minimum 0.9 length of intermediate wave (A) at 28.61 or below.
DAILY ELLIOTT WAVE COUNT
Click chart to enlarge.
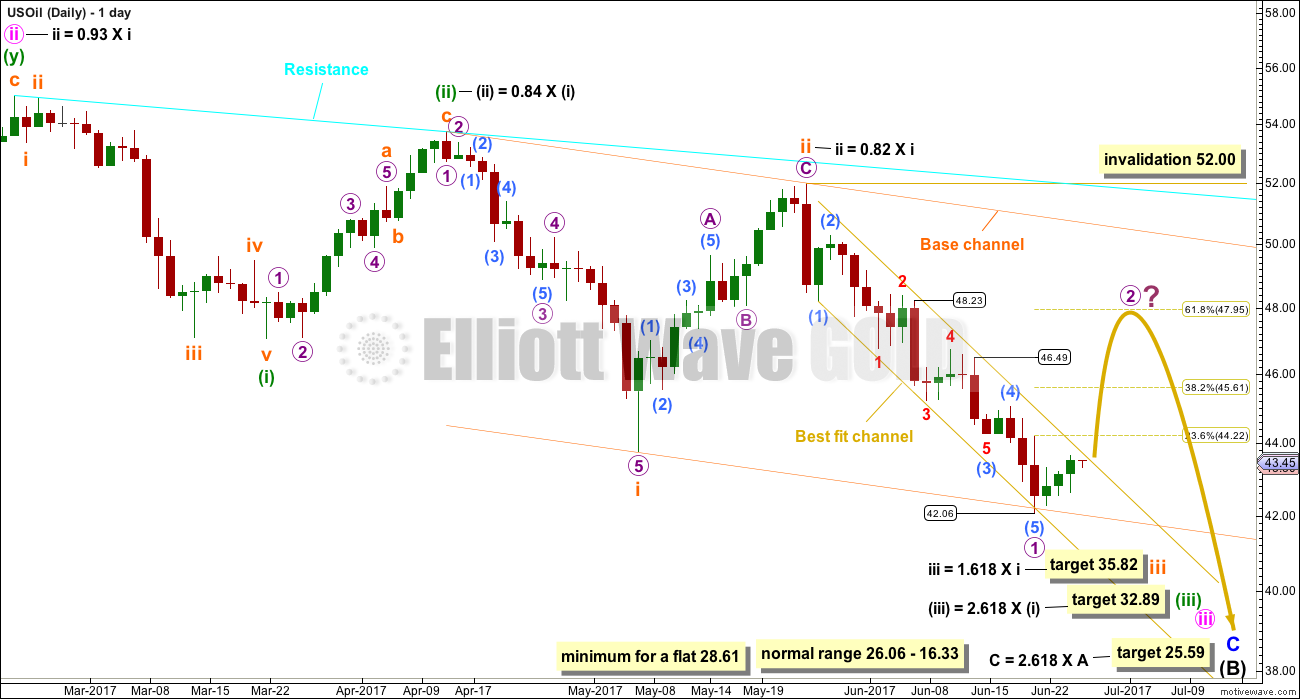
Minor wave C downwards must subdivide as a five wave structure.
So far now there would be three overlapping first and second waves within this wave count. Another deep second wave correction may be about to begin.
When third waves extend, as this one is, they necessarily begin with a series of overlapping first and second waves. Third wave extensions are extended in both price and time, and they show lower degree corrections within them on higher time frames. This one so far looks like a normal start to a third wave.
Labelling within most recent downwards movement is adjusted this week. Another first wave for micro wave 1 may have been complete at the low last week.
Fibonacci ratios within micro wave 1 are: sub-micro wave (3) is 0.14 less than 1.618 the length of sub-micro wave (1), and sub-micro wave (5) exhibits no Fibonacci ratio to sub-micro wave (3).
Price has bounced up off the lower edge of the base channel about subminuette waves i and ii. When subminuette wave iii moves through its middle, it should have the power to break below support at this trend line, and once that is done that the line should offer resistance. The fact that price has found strong support there at last week’s low supports the labelling of only micro wave 1 complete within subminuette wave iii.
Anchor points are given for the best fit channel, which is very slightly adjusted this week. Price is very close to resistance at the upper edge of this channel. If price breaks above the channel with a full daily candlestick above and not touching the upper trend line, then short positions should be exited. Look for another deep bounce to end either at the 0.382 or more likely the 0.618 Fibonacci ratio of micro wave 1.
The ? next to micro wave 2 is a question over whether or not this bounce will materialise. At this stage, it looks somewhat likely but is not yet confirmed. Confirmation would come with a breach of the best fit channel.
TECHNICAL ANALYSIS
DAILY CHART
Click chart to enlarge. Chart courtesy of StockCharts.com.
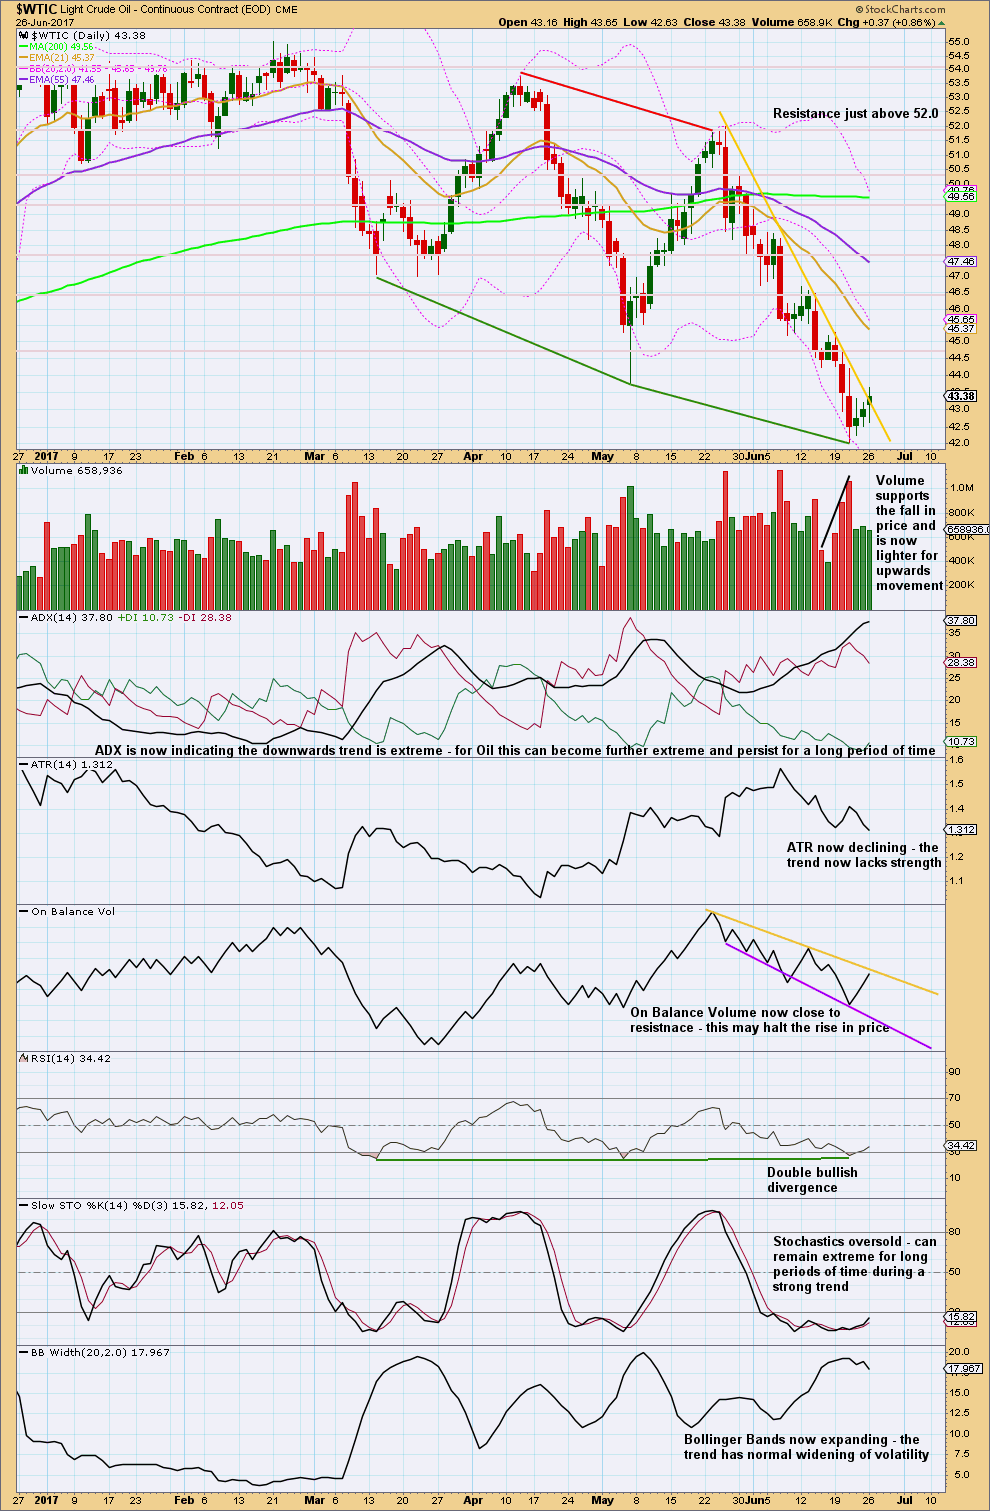
A resistance line is added in yellow this week to this last downwards movement. This line is overshot with the last daily candlestick. This may be an early warning of another deep bounce to begin.
RSI reached oversold and there exhibited divergence with price. This supports the idea of a deep bounce to begin again here.
The yellow trend line on On Balance Volume has been tested only twice before, so it does not offer strong technical significance. A breach would be a weak bullish signal, and a turn down from resistance would be a weak bearish signal.
VOLATILITY INDEX
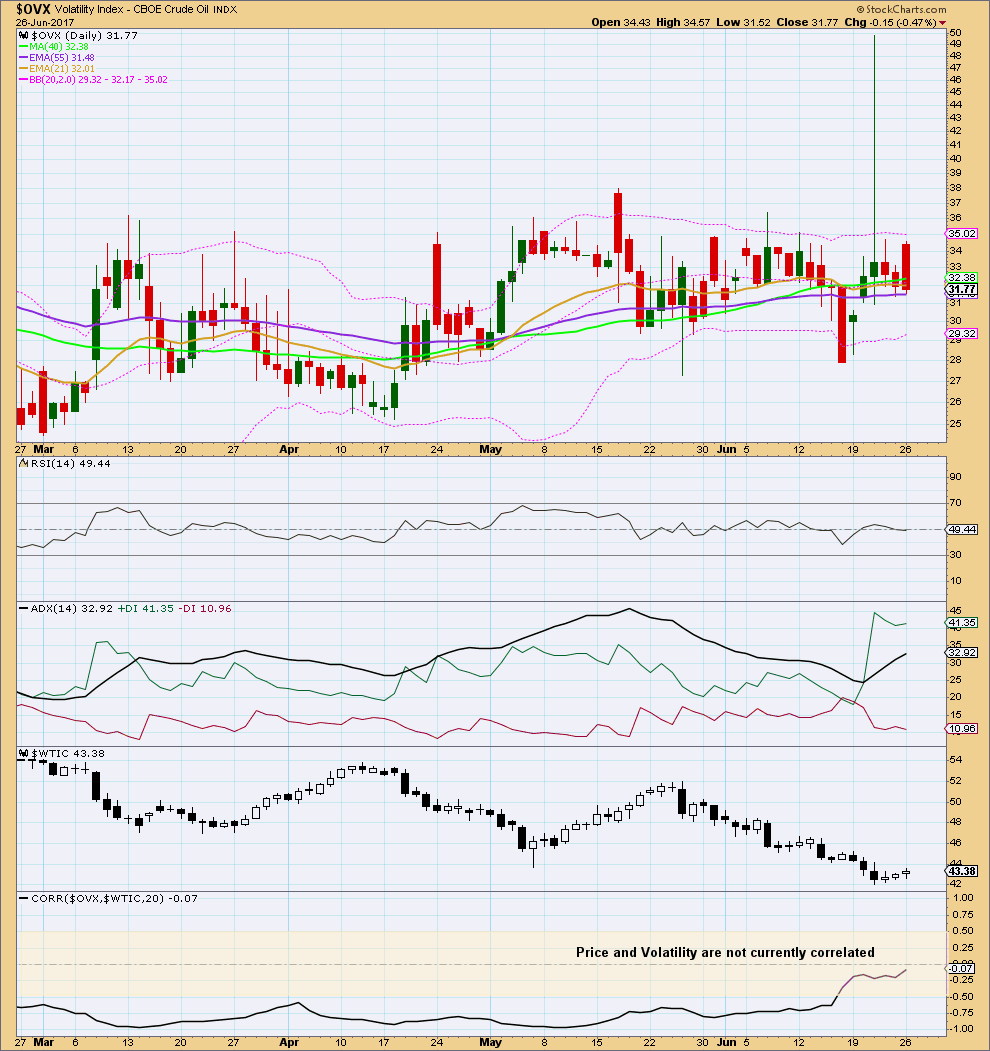
Click chart to enlarge. Chart courtesy of StockCharts.com.
Normally, volatility should decline as price rises and volatility should increase as price falls. Divergence from this normal can provide a bullish or bearish signal for Oil. However, it is noted that this signal occurs both in minor and major lows and it cannot be used to distinguish between them.
At this time, volatility and price do not have a negative correlation. Volatility cannot be used at this time to signal if a low is in place or not.
This analysis is published @ 01:47 a.m. EST.
Nice job on oil Lara
You ve nailed the count over these past months
Lara, As always, thanks for the great analysis! Also closed my short positions.
And I’ve closed my short positions, now stepping aside to see what happens next.
After this analysis was published it looks like the channel will be breached.
Still heavy short with your stop loss in place should I close out since channel is breached or just let it stop out any thoughts? Looks ready for a turn down on the 4hr and 1 hr si and slow sto
I’d close it if I were you. Take profits.