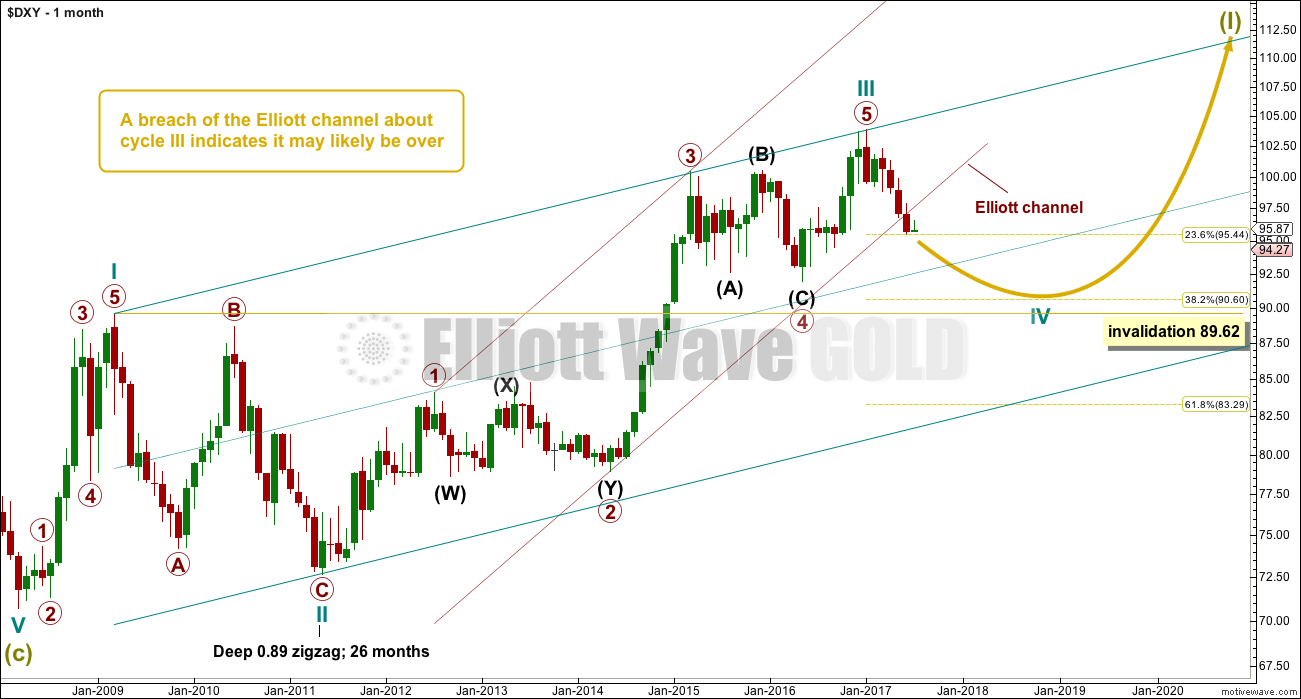
The USD index has been trending lower for six months now. A simple wave count at the monthly chart level may indicate what is most likely to happen next.
The Elliott channel (maroon) about cycle wave III is drawn using the first technique: a trend line is drawn from the end of the first and third waves, then a parallel copy is placed upon the end of the second wave. The fourth wave is normally contained within that channel. The fifth wave ends either mid way or at the upper edge of the channel.
If the fourth wave breaches the channel, then it is redrawn using the second technique: a trend line from the ends of the second to fourth waves, with a parallel copy on the end of the third wave.
For both techniques, after a possible fifth wave makes a new high (or is a complete structure which is occasionally truncated), a subsequent breach of the channel in the opposite direction is an indication that the whole structure is over and the next wave is underway.
The Elliott channel (maroon) about cycle wave III is breached. This indicates that cycle wave III may be over and cycle wave IV may be underway.
To determine how cycle wave IV may unfold the guideline of alternation and an eye for the right look is used.
This analysis is published @ 06:30 a.m. EST.

