More downwards movement was expected. A lower low and a lower high for Monday fits expectations.
Summary: The trend is still most likely down.
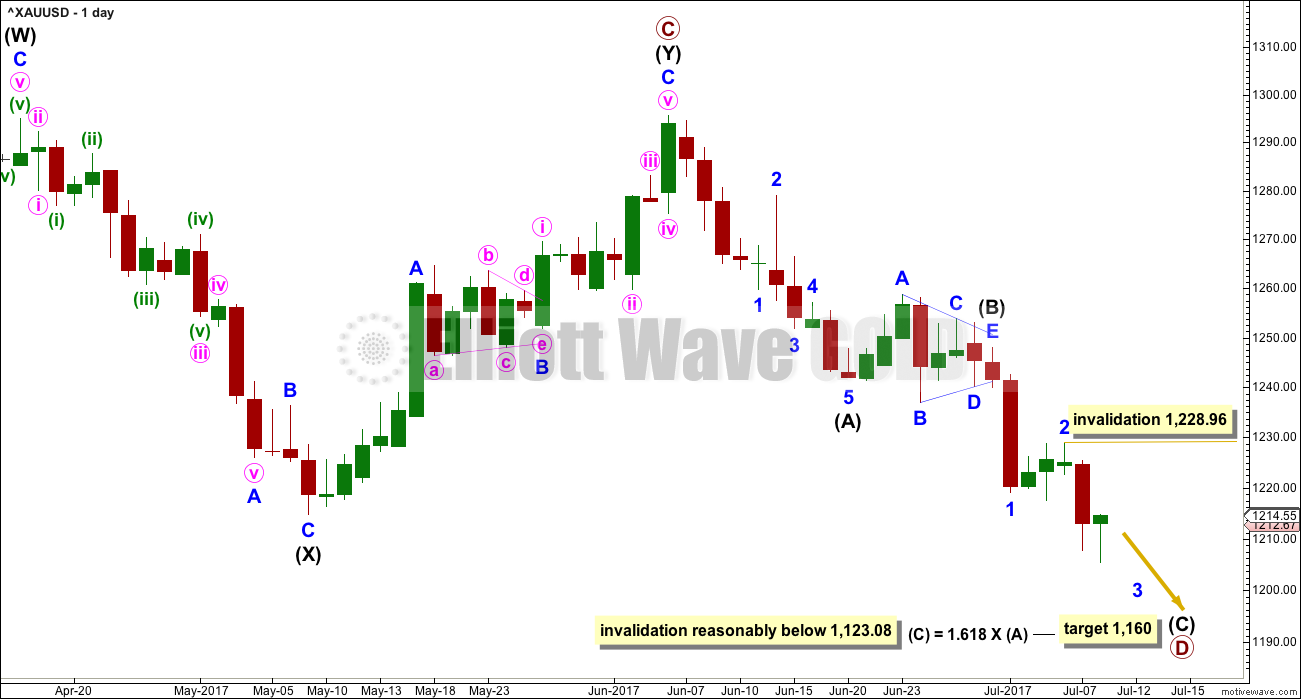
Profit target is now at 1,183 (measured rule) or 1,160 (Elliott wave).
Always use a stop and invest only 1-5% of equity on any one trade.
New updates to this analysis are in bold.
Last monthly charts and alternate weekly charts are here, video is here.
Grand SuperCycle analysis is here.
WEEKLY CHART
The Magee bear market trend line is added to the weekly charts. This cyan line is drawn from the all time high for Gold on the 6th of September, 2011, to the first major swing high within the following bear market on the 5th of October, 2012. This line should provide strong resistance.
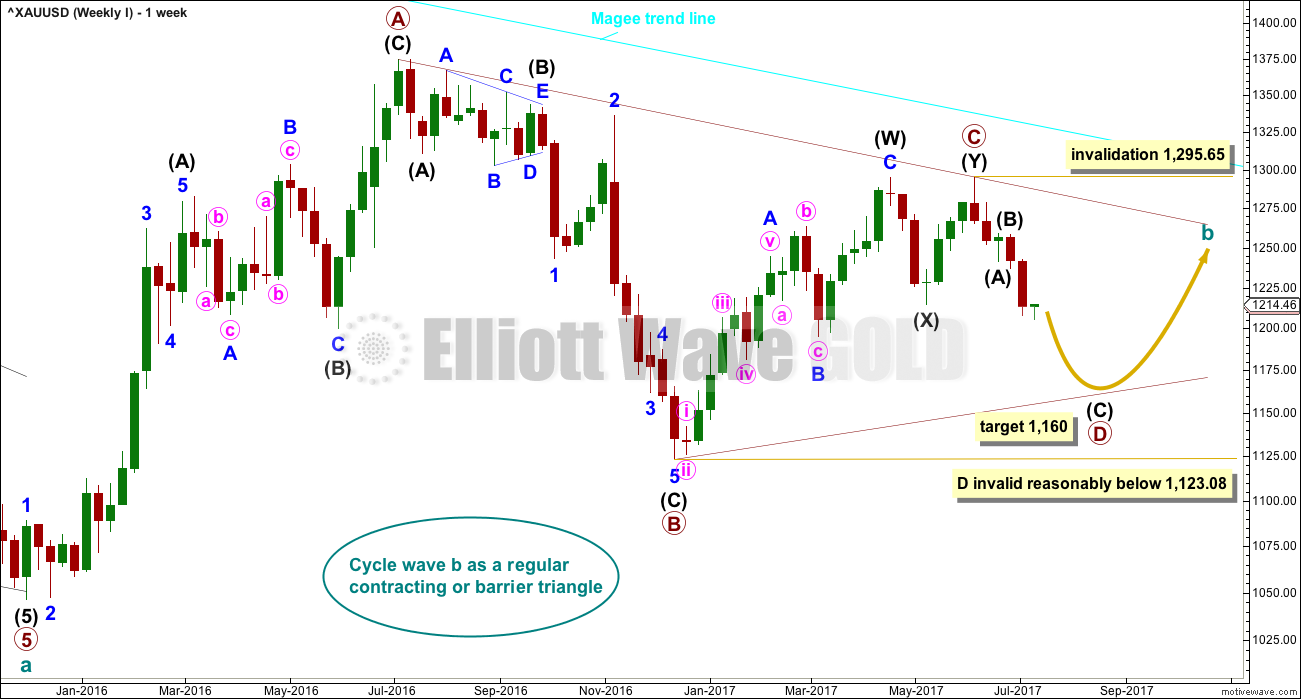
At this stage, a triangle still looks most likely and has the best fit for cycle wave b.
Within a triangle, one sub-wave should be a more complicated multiple, which may be primary wave C. Primary wave C may not move beyond the end of primary wave A above 1,374.91. This invalidation point is black and white.
At this stage, it looks like primary wave C is now complete at the hourly and daily chart level. A new low on Friday below 1,214.81 cannot be minor wave B within intermediate wave (Y) within primary wave C, so now primary wave C must be over.
Primary wave D of a contracting triangle may not move beyond the end of primary wave B below 1,123.08. Contracting triangles are the most common variety.
Primary wave D of a barrier triangle should end about the same level as primary wave B at 1,123.08, so that the B-D trend line remains essentially flat. This involves some subjectivity; price may move slightly below 1,123.08 and the triangle wave count may remain valid. This is the only Elliott wave rule which is not black and white.
Finally, primary wave E of a contracting or barrier triangle may not move beyond the end of primary wave C above 1,295.65. Primary wave E would most likely fall short of the A-C trend line. But if it does not end there, then it can slightly overshoot that trend line.
There are three alternate wave counts that have been published in the last historic analysis, which is linked to above. They are all very bullish. They will only be published on a daily basis if price shows them to be true with a new high now above 1,295.65.
DAILY CHART
A new low below 1,214.81 could not be minor wave B within intermediate wave (Y) and has now provided strong confirmation that intermediate wave (Y) is over.
A common range for triangle sub-waves is from about 0.8 to 0.85 the prior sub-wave, this gives a range for primary wave D from 1,158 to 1,149. A Fibonacci ratio is used to calculate a target, which is just above this common range, for intermediate wave (C) now that intermediate waves (A) and (B) look to be complete.
If primary wave C is correctly labelled as a double zigzag, then primary wave D must be a simple A-B-C structure and would most likely be a zigzag. With a triangle complete in the position labelled intermediate wave (B), the idea of a zigzag unfolding lower is strengthened. This may not be labelled a second wave as second waves do not subdivide as triangles. Triangles appear in positions of fourth waves, B waves, or within combinations.
Intermediate wave (A) lasted only ten days. Intermediate wave (B) has lasted eight days. As intermediate wave (C) is expected to be longer in length than intermediate wave (A), it may also be longer in duration and may last a Fibonacci thirteen days as the first expectation or a Fibonacci twenty one days as the next expectation. So far it has lasted only six days.
Intermediate wave (C) must subdivide as a five wave motive structure, either an impulse or an ending diagonal. An impulse is much more likely; so let us assume that is the more likely structure until proven otherwise, or until some overlapping suggests a diagonal may be possible.
Within intermediate wave (C), minor waves 1 and 2 are now complete. Within minor wave 3, no second wave correction may move beyond the start of its first wave above 1,228.96.
Primary wave A lasted 31 weeks, primary wave B lasted 23 weeks, and primary wave C may have been complete in 25 weeks.
Primary wave D should be expected to last at least 8 weeks (but most likely longer). The next Fibonacci ratio in the sequence would be a Fibonacci 13 and then 21.
HOURLY CHART
Minor wave 2 was over as a brief and shallow expanded flat correction.
Minor wave 3 may only subdivide as a simple impulse. It may be close to complete if the target is correct. At 1,201 minor wave 3 would reach 1.618 the length of minor wave 1.
When minor wave 3 is complete, then the invalidation point for minor wave 4 moves down to the end of minor wave 1 at 1,219.05.
So far, within the impulse of minor wave 3, minute wave iii now looks complete. There is no Fibonacci ratio between minute waves i and iii, making it more likely that minute wave v will exhibit a Fibonacci ratio to either. Within the completed impulse of minute wave iii, there is perfect alternation between the deep expanded flat correction of minuette wave (ii) and the shallow zigzag of minuette wave (iv).
Within the incomplete impulse of minor wave 3, minute waves ii and iv are exhibiting alternation in structure. If minute wave iv is deep, they would also exhibit alternation in depth. The 0.618 Fibonacci ratio of minute wave iii at 1,218 looks like a reasonable target for minute wave iv. This would also see price find resistance at the upper edge of the acceleration channel.
Minor wave 2 shows up on the daily chart lasting three days. For the wave count at the daily chart level to have the right look, minor wave 4 should also show up on the daily chart lasting a few days. Minor wave 4 may be the next multi day interruption to this downwards trend.
TECHNICAL ANALYSIS
WEEKLY CHART
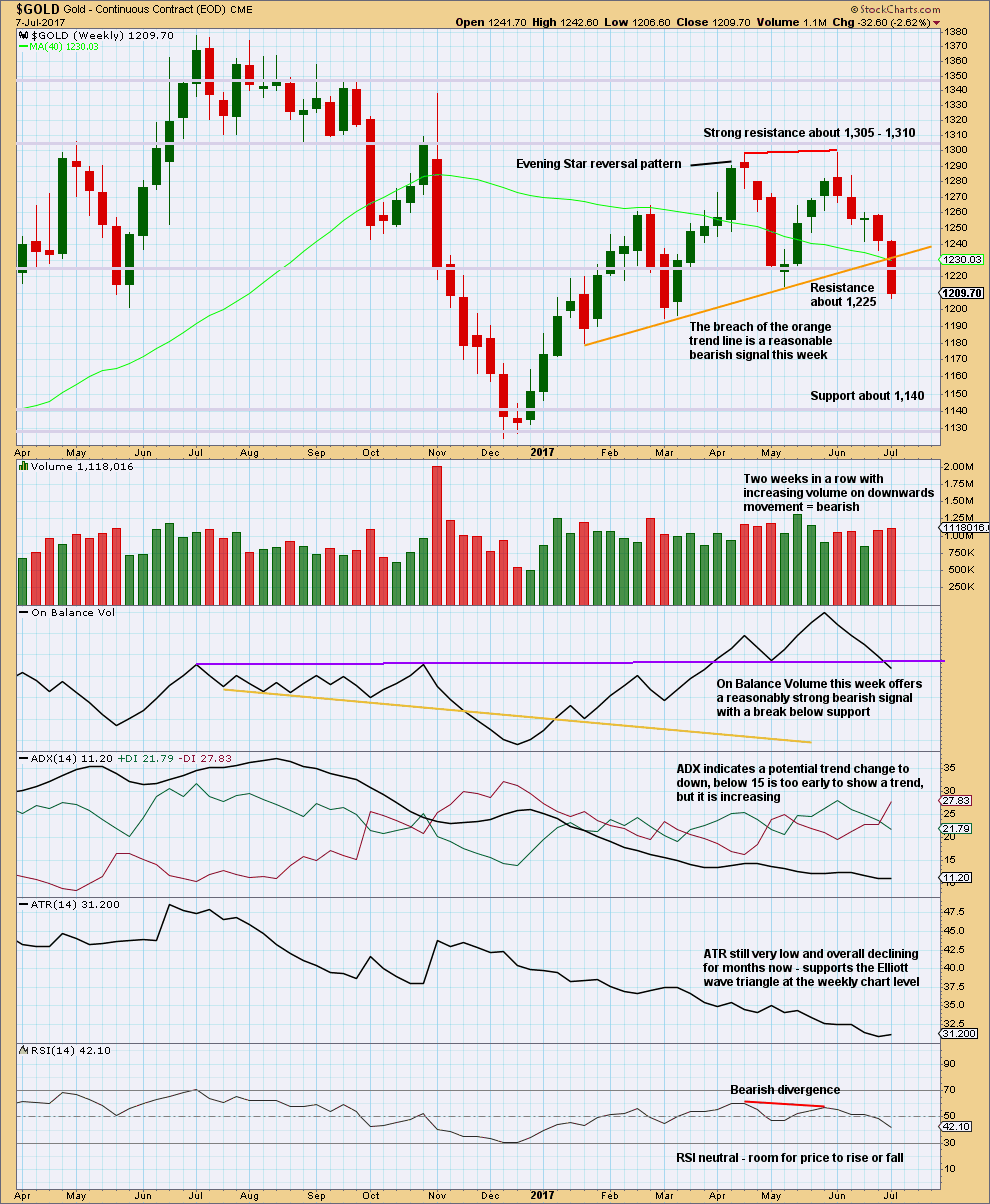
Click chart to enlarge. Chart courtesy of StockCharts.com.
This chart offers strong support to the Elliott wave count.
The breach of the orange trend line by price is bearish. On Balance Volume gives a reasonable bearish signal, which should be given weight. Volume is bearish. ADX is slightly bearish. RSI is bearish.
Only ATR indicates weakness for the bigger picture (the Elliott wave triangle at the weekly chart level), but this does not preclude price from falling further here though.
DAILY CHART
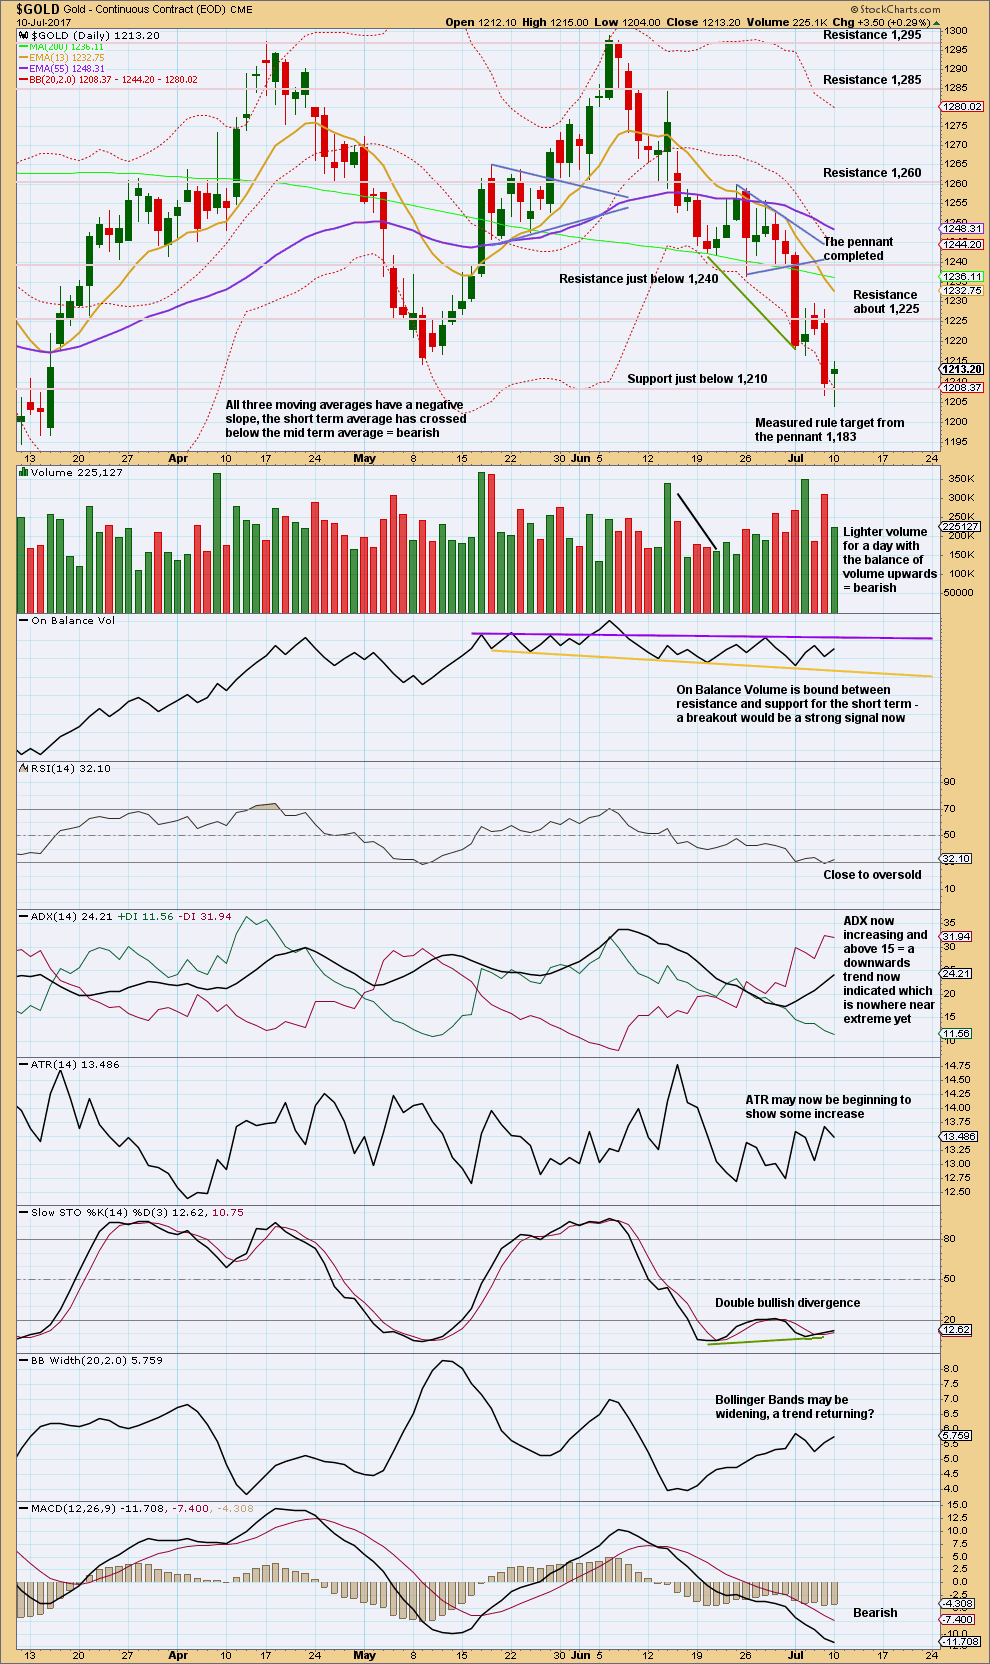
Click chart to enlarge. Chart courtesy of StockCharts.com.
Monday’s candlestick is very bullish. Although Monday has moved price lower with a lower low and lower high, the balance of volume was upwards and the candlestick closed green. Volume does not support upwards movement during Monday’s session.
There is single day bullish divergence between price and RSI today: price made a new low, but RSI did not. When RSI does this after reaching oversold, this is often (not always) a signal of a low in place. However, in this case the signal is weak because RSI was barely oversold.
While this chart is on balance mostly bearish, it does look like the trend may be stretched. Protect short positions with stops.
GDX
DAILY CHART
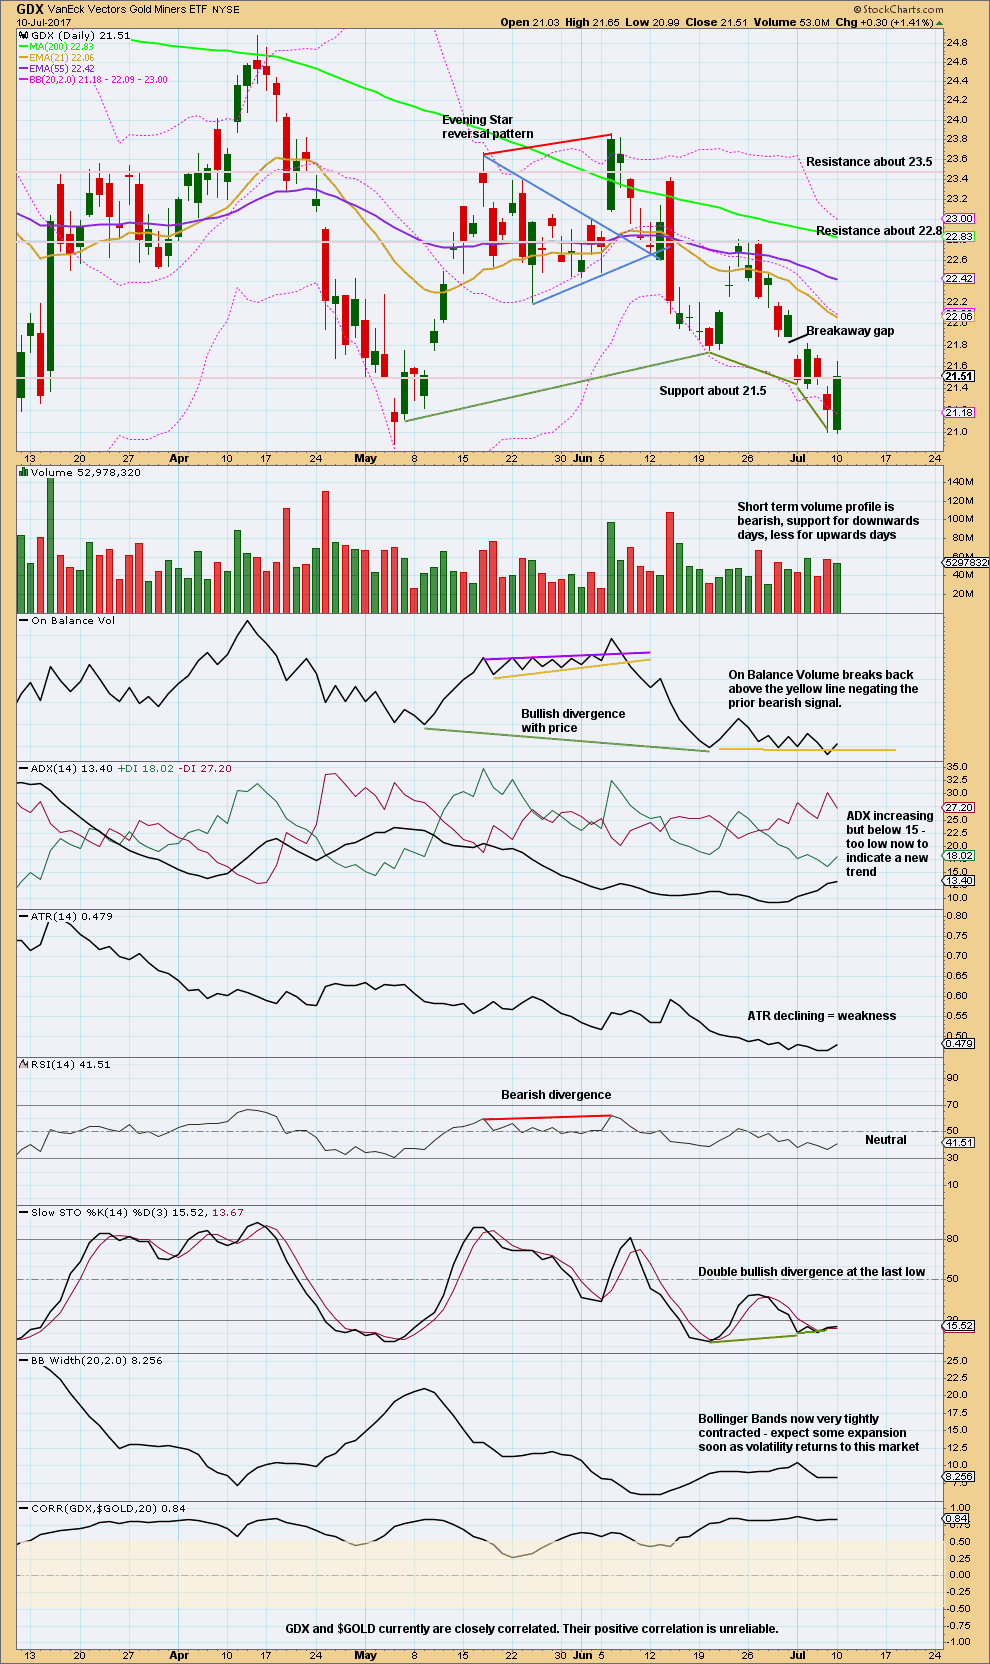
Click chart to enlarge. Chart courtesy of StockCharts.com.
GDX today looks more bullish. The strong outside day for Monday completes a bullish engulfing candlestick pattern, suggesting a low may be in place. With Stochastics exhibiting double bullish divergence while oversold, this pattern has some support.
This one session has changed the short term outlook for GDX to bullish to neutral.
This analysis is published @ 08:47 p.m. EST.

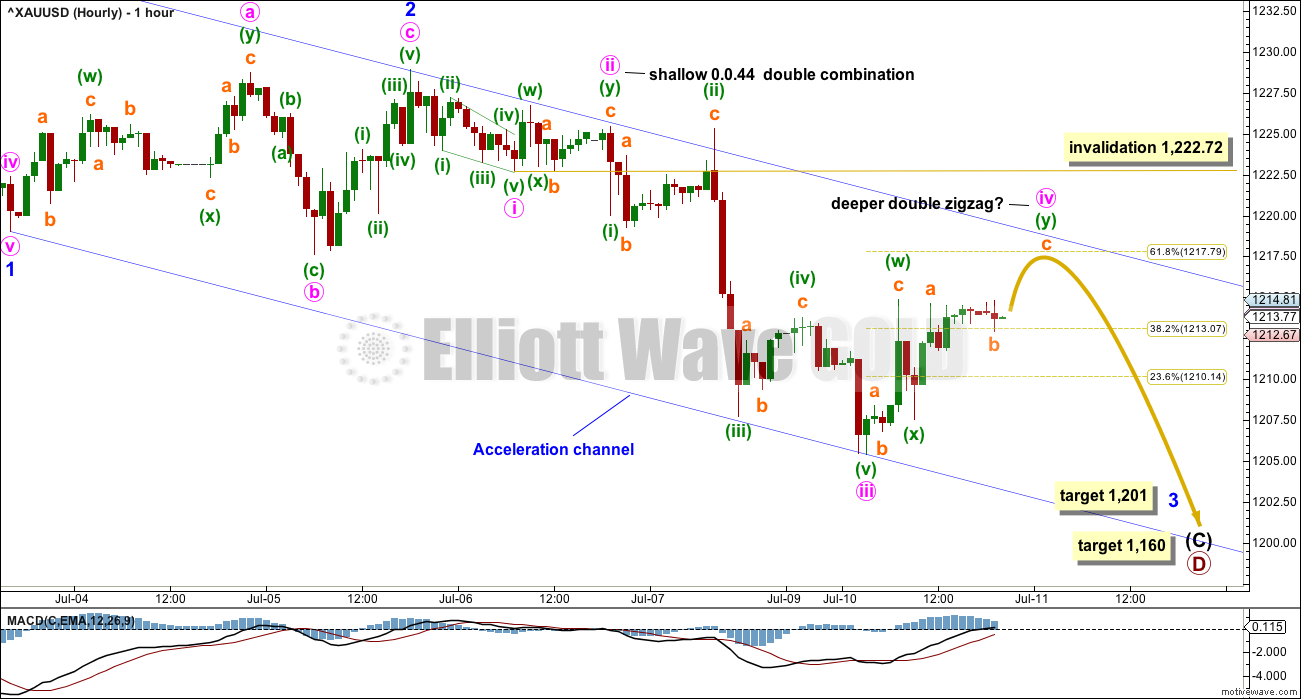
When you draw trendines on hourly chart connecting highs and lows, it lools like a wedge and gold is now at upper trendline. If it does not start turning down from here we could have a breakout.
really miss laras brief updates before market close
Sorry Brandon. I suffer horribly from insomnia, and sometimes I can sleep in the morning. It’s school holidays so I’ve been taking that opportunity to sleep.
I’ll keep your missing my updates in mind more.
thanks it gives a great view just before close to exit any metal stocks as they are not available to trade after hours. Thanks for all your efforts i love this site
I know. Darn daylight savings, in my winter I have less time in my morning before NY closes at 4pm EST.
Will be up earlier. Promise.
Most of this board was bullish late last year and then bearish early in the year and then bullish a couple months ago and now bearish. Consensus has been wrong on here from an intermediate term basis for six months now. For as valuable as your input is (and no offense here just an observation) if I were to apply a contrarian viewpoint here gold is probably going to go higher here. From a short term basis it definitely looks bad but on a longer term basis all I see is what looks like a leading diagonal that is coming to a conclusion soon. Gold, GDX, and GDXJ all show similar charts. If the equity markets are working on a intermediate topping process then that may coincide with a breakout for gold in the next few weeks. Just saying
The crowd is always wrong of course, by definition :). Once everyone buys, there are only seller’s left, and vice versa. COT structure supports the view of at least an interim bottom very soon (if not already). On my charts, GDX and Silver are on a buy signal. Gold not yet. Dollar looks week. S&P in nowhere land, but seems supported with every dip. Let’s keep in mind the last few weeks have seen a breakdown or at least a sloppiness in the typical correlations that were much tighter before this recent period.
Ivne, where do you see a leading diagonal? Can you point it out on a chart?
Sorry meant contracting triangle
If this is the case it should have just finished E but GDXJ needs to explode into the 35 range in the next month and GDX into the 25/26 range
Late last year? The low was in December 2016. So if the consensus was bullish it would have been right at that time.
While your comments do not breach comment guidelines, I notice your comments to date on this website have been negative.
Regarding analysis offered in your comment above I do not see clarity on what structure you see and why you expect the breakout to be upwards.
I will repeat what I said last time to you. I am mystified as to why you are a member here, for a reasonable time now?
I have seen this happen before over the years. Occasionally (usually new) members are critical of Elliott wave as an analysis technique, or critical of me personally. Here I notice you are telling the members who engage and offer analysis that they are wrong. When I see this approach from a member I have learned that it does not end well, for them or for me.
I am asking you to reach out to me and email me at admin@elliottwavegold.com and let me know what you are finding in this membership, and why you are still here.
Looks like we broke out of the downtrend channel
Imo Gold price appears to be following Silver with a bullish reversal playing out. It would be interesting to see if Gold price can break above 1220-21. Lara has an invalidation 1222.72 on the hourly & 1228.96 on the daily. Imo Gold price could likely check/test a break above 1224-25 should this pierce through 1220-21….. Lets see what happens! GL.
Are we headed up to finish wave 4 or is this something else
Hi Lara,
Re NZD/USD, sorry I didn’t mean comments, I meant your last analysis which was at the end of the Gold analysis.
Oh sorry! Didn’t read your comment carefully enough Nick.
Would a chart and a new comment do?
It looks now increasingly like NZDUSD has finished its very deep second wave correction after the first wave leading diagonal. The channel about minor 2 is a good one, and it’s been nicely and clearly breached.
I’ve drawn a cyan resistance line along the new downwards movement. If price comes up again to touch that line it may offer a good entry for a short position. Otherwise, jump in and be prepared to have an underwater position for a few days.
Stops should be set just above the last high of 30th June at 0.73457. Target 0.62658, may be revised lower as structure unfolds.
Invest only 1-5% of equity on this one trade please.
Bitcoin appears to be consolidating while it waits for a key decision
https://www.bloomberg.com/news/articles/2017-07-10/bitcoin-risks-splintering-as-civil-war-enters-critical-month
Gold Daily Analysis
Data as at Market Close, July 10
===========================
Gold prices mainly rose yesterday after touching a 4-month low of 1205.41 last Friday. However, the rise wasn’t spectacular. Prices had not reached even close to the strong support turned resistance at 1220. Having spent more than 24 hours below it, with not much effort to break above it, the bears appear to be fully in control and we should see gold prices continue to move downwards even further in the coming days with 1200 and 1180 being the likely targets in the short term. This pressure is not likely to ease soon, and so the gold bulls should prepare themselves for more pain.
The Daily Ichimoku Chart shows that gold prices trade way below the 50 day SMA at 1250.49 and the kijun-sen resistance at 1251.40. These price points are unlikely to be reached unless miraculously gold surged past 1220. The tenkan-sen lying way below the kijun-sen at 1229.85, followed by the 200 day SMA at 1236.11, poses a formidable barrier to any bullish attempt. My judgement is that yesterday’s rebound is just a relief rally, marking time before Janet Yellen’s addressing of Congress on Wednesday and Thursday, waiting for more clues from the Fed regarding the upcoming future interest rate hikes. Although the 5-day RSI is in oversold territory, begging for a rise to at least 30, the MACD is still dropping, presenting a divergent view. It would be left to the crowd sentiment reacting to Yellen’s testimony to direct the market.
The daily candle yesterday was a long-tailed doji, mildly indicating a brief rally, which could continue today even though gold prices fell slightly early Tuesday (my time). There is a silver lining in the cloud (actually more like green than silver I must say), and this persists until the first week of August. It could mean that any subsequent price drop is unlikely to be very steep. Personally, I would think that the 1180s are a more probable drop target than 1160, but I guess we will have to see which way the wind blows.
Hi Lara,
I would like to access your last comments on the NZD but I think it came at the end of a Gold commentary and therefore I cannot access it by ticking the NZD/USD under Categories.
many thanks.
that’s because comments are only open for 7 days
you may comment on NZDUSD here
As expected, GDX made a new low, then moved up sharply breaking out of the hourly channel.
The move up produced a bullish engulfing candle on the daily; however it was not supported by volume. Also, I think there’s enough play in how the trendline is drawn for On Balance volume that you could say the move up was just a trendline backtest.
Keeping it short below 21.75. Above that and my hourly count is wrong.
If 21.75 is breached to the upside, then the GDX triangle is likely expanding and another leg up has started. I will publish a new count.
https://www.tradingview.com/x/6Uq7pqlh/
Impressive, Dreamer! We’re right near the 21.75 mark. If it’s going to break, I’d suspect it must do so with a bullish flare, but to me, it looks like it’s out of gas and not ready to do so on it’s first try. The next fall (green arrow) is substantial but I don’t have the guts to short it.
Thanks, as always, for your posts!