A new high above 1,222.72 invalidated the main hourly Elliott wave count and added confidence to the alternate hourly Elliott wave count. The alternate has some support from volume analysis, and its target remains the same today.
Summary: In the short term, a bounce may continue higher for another day to about 1,232. This bounce at its end should offer an opportunity to join the larger downwards trend.
Profit target is now at 1,183 (measured rule) or 1,160 (Elliott wave).
Always use a stop and invest only 1-5% of equity on any one trade.
New updates to this analysis are in bold.
Last monthly charts and alternate weekly charts are here, video is here.
Grand SuperCycle analysis is here.
WEEKLY CHART
The Magee bear market trend line is added to the weekly charts. This cyan line is drawn from the all time high for Gold on the 6th of September, 2011, to the first major swing high within the following bear market on the 5th of October, 2012. This line should provide strong resistance.
At this stage, a triangle still looks most likely and has the best fit for cycle wave b.
Within a triangle, one sub-wave should be a more complicated multiple, which may be primary wave C. Primary wave C may not move beyond the end of primary wave A above 1,374.91. This invalidation point is black and white.
At this stage, it looks like primary wave C is now complete at the hourly and daily chart level. A new low on Friday below 1,214.81 cannot be minor wave B within intermediate wave (Y) within primary wave C, so now primary wave C must be over.
Primary wave D of a contracting triangle may not move beyond the end of primary wave B below 1,123.08. Contracting triangles are the most common variety.
Primary wave D of a barrier triangle should end about the same level as primary wave B at 1,123.08, so that the B-D trend line remains essentially flat. This involves some subjectivity; price may move slightly below 1,123.08 and the triangle wave count may remain valid. This is the only Elliott wave rule which is not black and white.
Finally, primary wave E of a contracting or barrier triangle may not move beyond the end of primary wave C above 1,295.65. Primary wave E would most likely fall short of the A-C trend line. But if it does not end there, then it can slightly overshoot that trend line.
There are three alternate wave counts that have been published in the last historic analysis, which is linked to above. They are all very bullish. They will only be published on a daily basis if price shows them to be true with a new high now above 1,295.65.
DAILY CHART
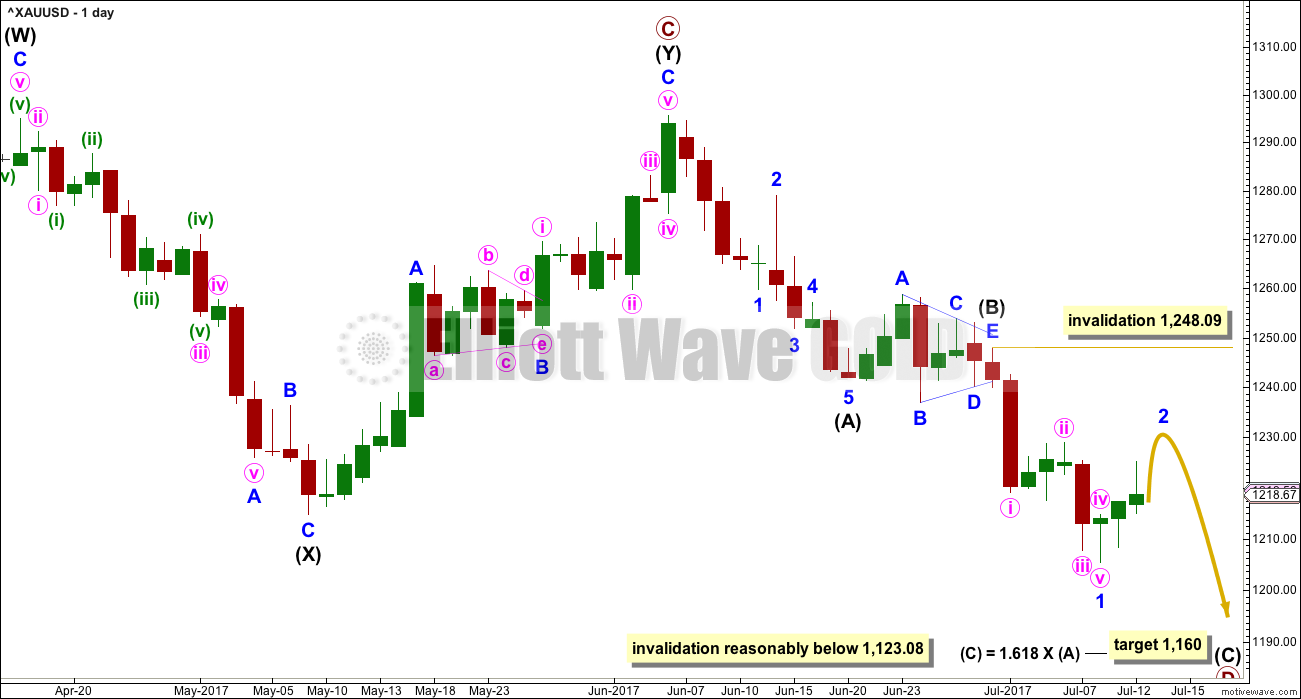
A new low below 1,214.81 could not be minor wave B within intermediate wave (Y) and has now provided strong confirmation that intermediate wave (Y) is over.
A common range for triangle sub-waves is from about 0.8 to 0.85 the prior sub-wave, this gives a range for primary wave D from 1,158 to 1,149. A Fibonacci ratio is used to calculate a target, which is just above this common range, for intermediate wave (C) now that intermediate waves (A) and (B) look to be complete. At this stage, to try and see the whole of primary wave D complete at Monday’s low does not look right. The B-D trend line would be too steep for a normal looking contracting Elliott wave triangle, and primary wave D would have been far too brief at only 5 weeks duration. For the wave count to have the right look and good proportions (as Gold almost always does), primary wave D should not be labelled over yet.
If primary wave C is correctly labelled as a double zigzag, then primary wave D must be a simple A-B-C structure and would most likely be a zigzag. With a triangle complete in the position labelled intermediate wave (B), the idea of a zigzag unfolding lower is strengthened. This may not be labelled a second wave as second waves do not subdivide as triangles. Triangles appear in positions of fourth waves, B waves, or within combinations.
Intermediate wave (A) lasted only ten days. Intermediate wave (B) has lasted eight days. As intermediate wave (C) is expected to be longer in length than intermediate wave (A), it may also be longer in duration and may last a Fibonacci thirteen days as the first expectation or a Fibonacci twenty one days as the next expectation. So far it has lasted only eight days.
Intermediate wave (C) must subdivide as a five wave motive structure, either an impulse or an ending diagonal. An impulse is much more likely; so let us assume that is the more likely structure until proven otherwise, or until some overlapping suggests a diagonal may be possible.
Within intermediate wave (C), minor wave 2 may not move beyond the start of minor wave 1 above 1,248.09.
Primary wave A lasted 31 weeks, primary wave B lasted 23 weeks, and primary wave C may have been complete in 25 weeks.
Primary wave D should be expected to last at least 8 weeks (but most likely longer). The next Fibonacci ratio in the sequence would be a Fibonacci 13 and then 21.
HOURLY CHART
Minor wave 1 looks to have been over at the last low on the 10th of July. Minor wave 2 so far looks like it may be completing as a double zigzag. The 0.618 Fibonacci ratio is a reasonable target about 1,232. This coincides reasonably well with prior support at 1,236.50.
Within minor wave 2, the first zigzag labelled minute wave w fell slightly short of the 0.382 Fibonacci ratio. Minute wave x is brief and shallow, typical of X waves within multiple zigzags.
Minute wave y may now be deepening the correction, achieving the purpose of a double zigzag to have a clear slope.
Within minute wave y, the correction of minuette wave (b) may not move beyond the start of minuette wave (a) below 1,214.94. In the short term, a new low below 1,214.94 could not be a continuation of minuette wave (b), so at that stage either my labelling of minor wave 2 would be wrong, or it may be over already.
If price breaks below the cyan support line, that would provide a very strong signal that minor wave 2 should be over and minor wave 3 downwards should be underway.
Minor wave 2 may end now within the next 24 hours.
TECHNICAL ANALYSIS
WEEKLY CHART
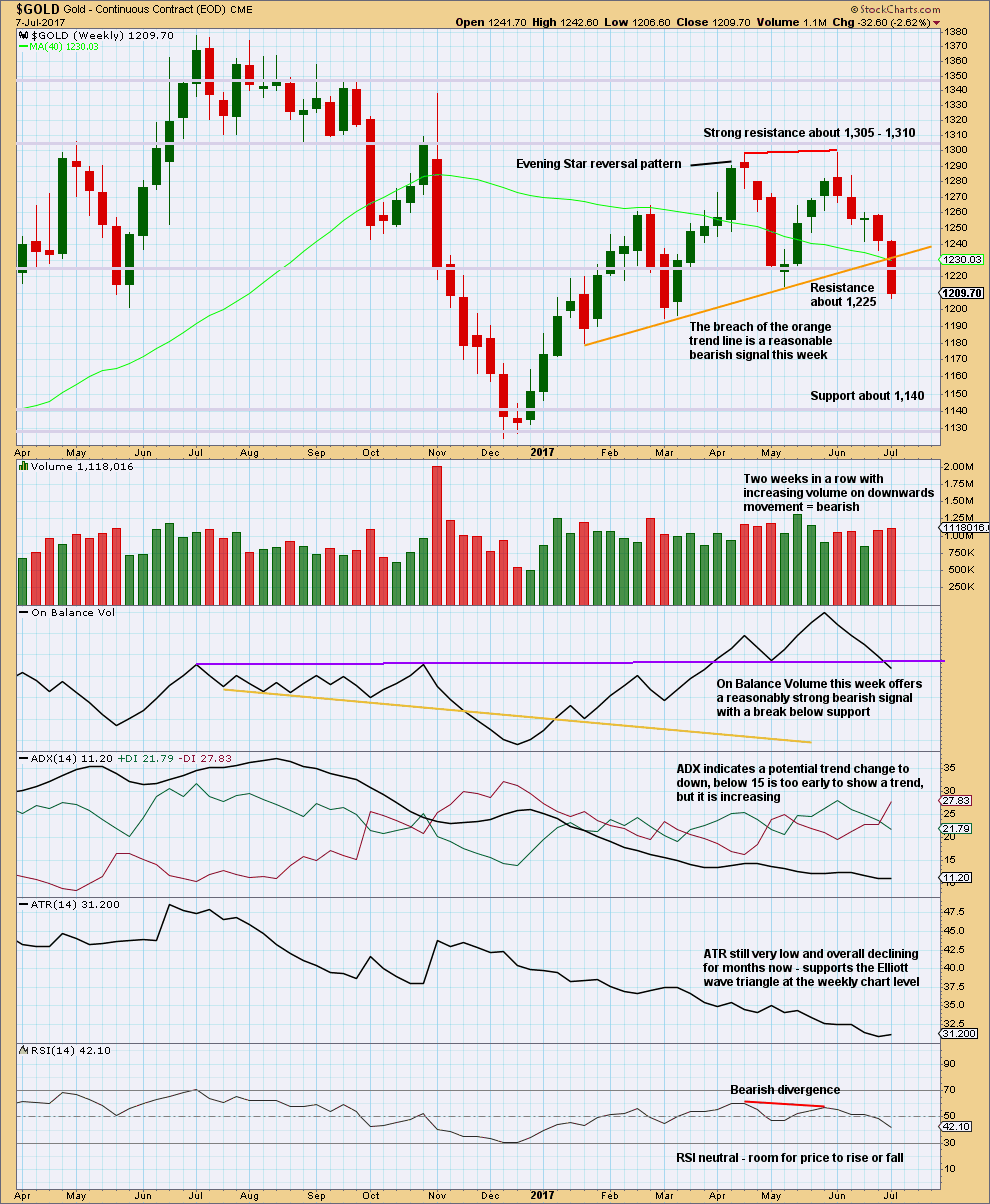
Click chart to enlarge. Chart courtesy of StockCharts.com.
This chart offers strong support to the Elliott wave count.
The breach of the orange trend line by price is bearish. On Balance Volume gives a reasonable bearish signal, which should be given weight. Volume is bearish. ADX is slightly bearish. RSI is bearish.
Only ATR indicates weakness for the bigger picture (the Elliott wave triangle at the weekly chart level), but this does not preclude price from falling further here though.
DAILY CHART
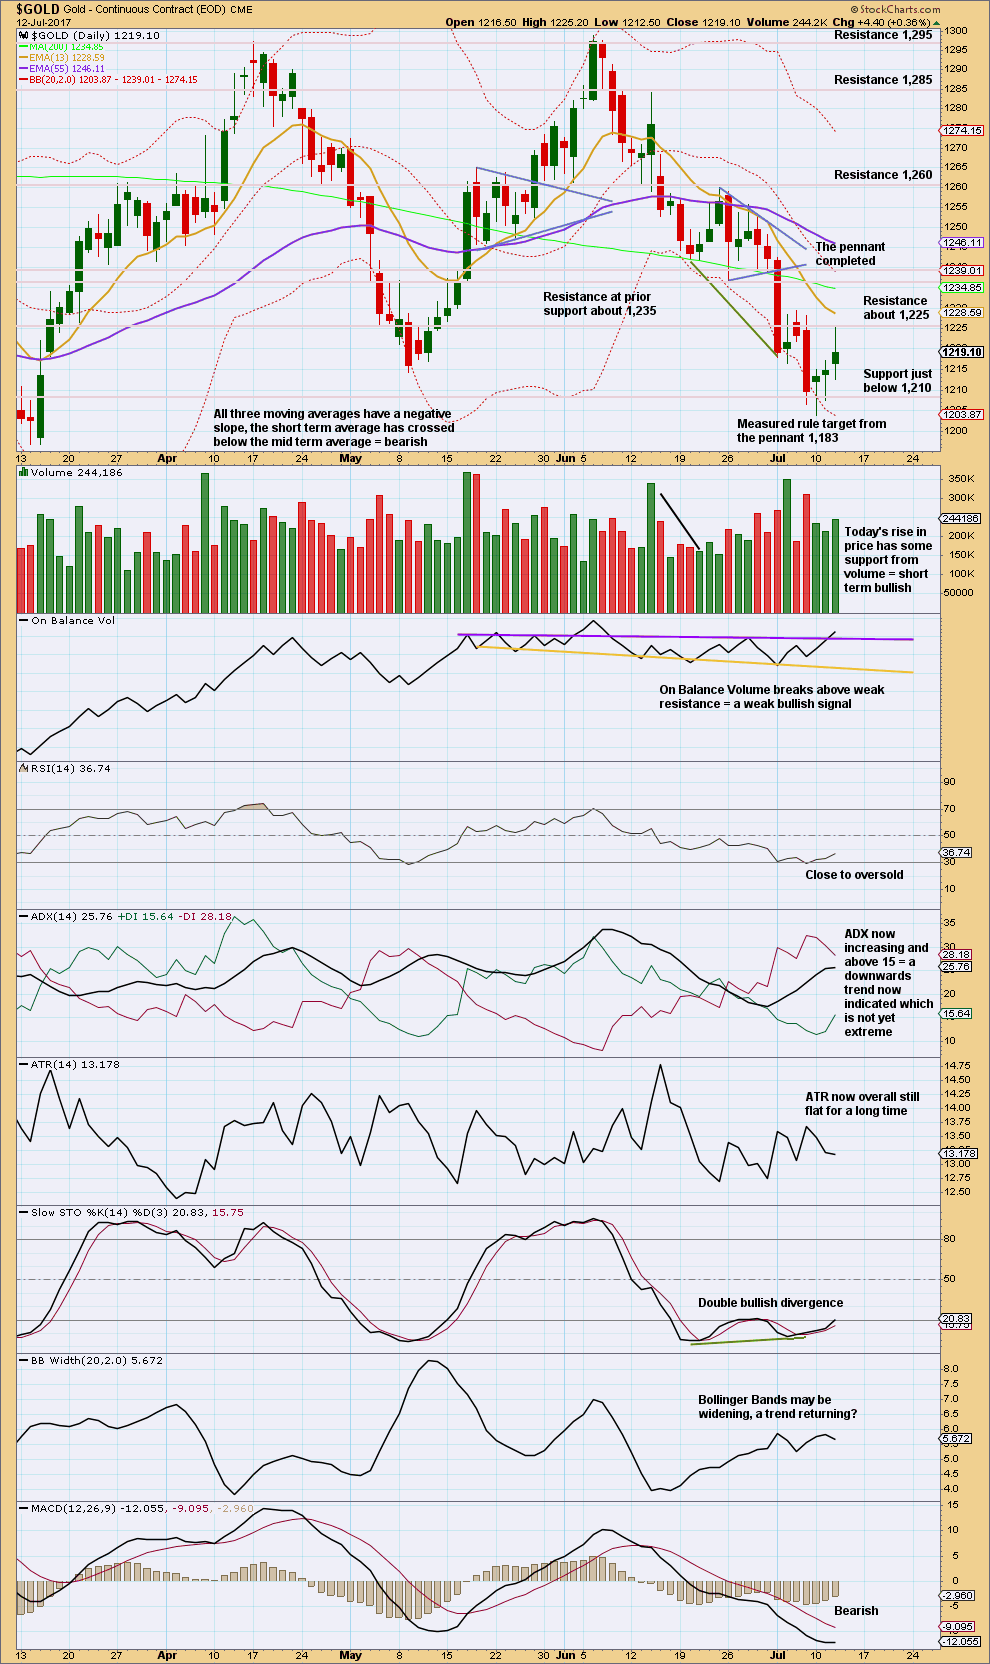
Click chart to enlarge. Chart courtesy of StockCharts.com.
For StockCharts NY session only data, there is a long upper wick on today’s candlestick that is not as long as BarChart’s. This candlestick is slightly bearish. If another green candlestick completes for Thursday’s session with a long upper wick, that would be a very strong indication that the bounce should be over.
Volume and On Balance Volume today suggests the bounce is not over.
Look for strong resistance, and the bounce to end, at prior support of the pennant pattern at 1,236.50.
GDX
DAILY CHART
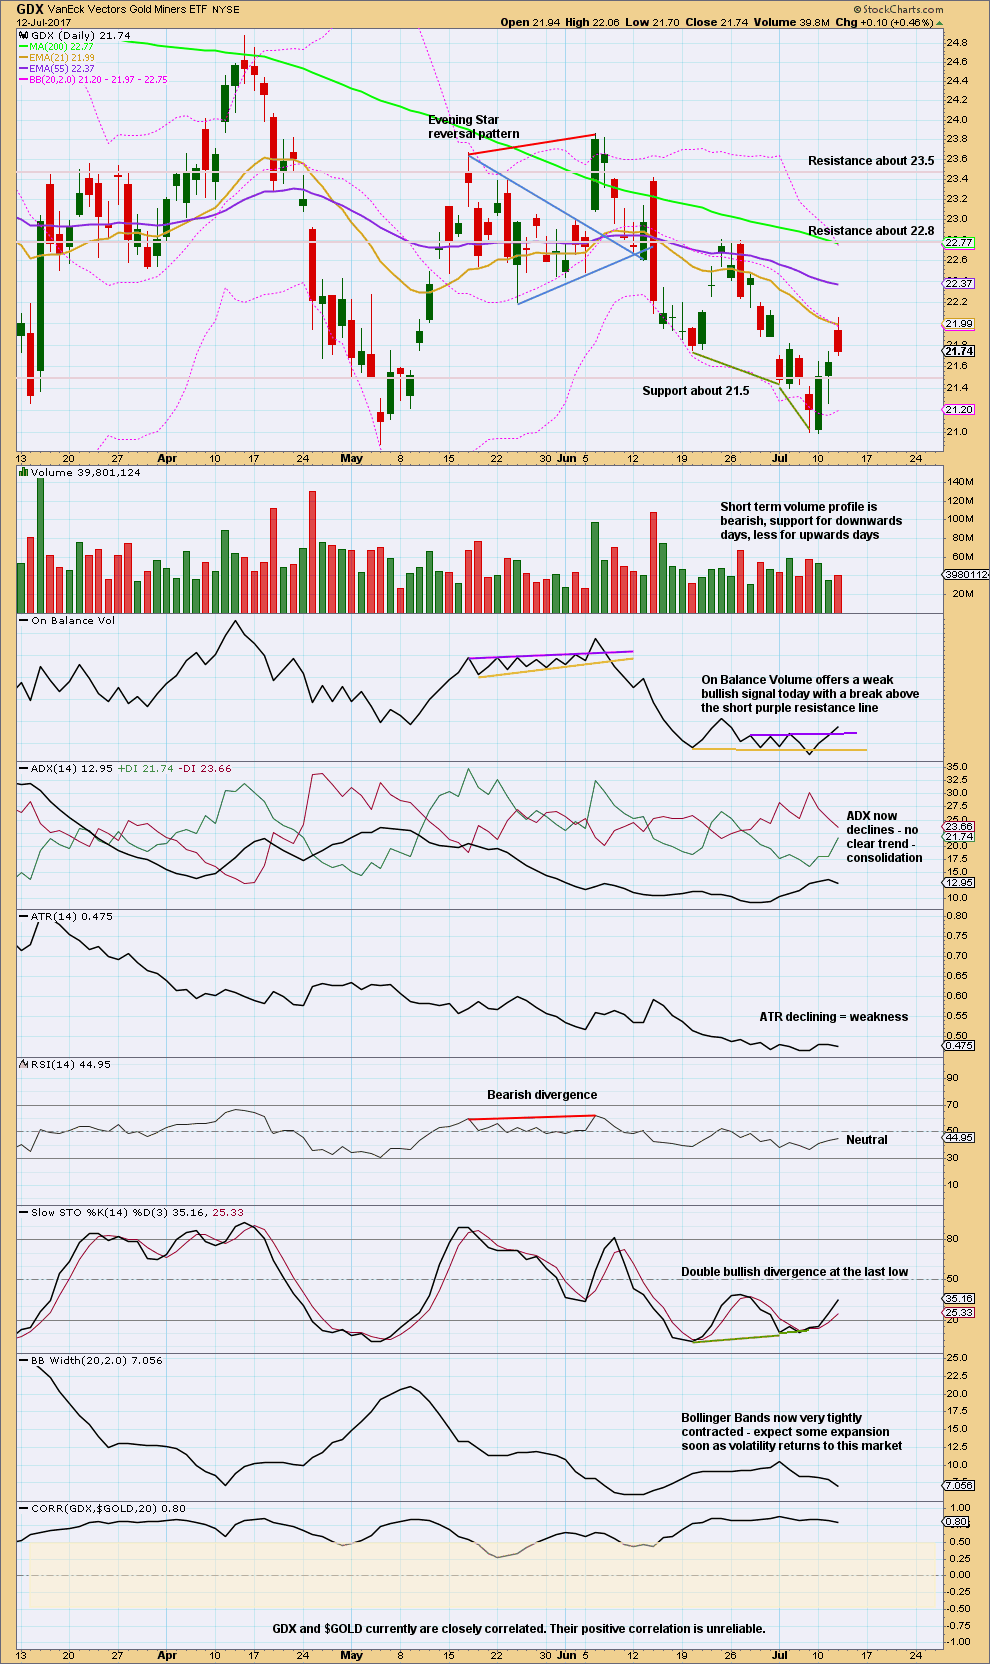
Click chart to enlarge. Chart courtesy of StockCharts.com.
With the last gap now closed, next resistance is about 22.80.
Some increase in volume during the last session for an upwards day (although it closed red) is slightly bullish for the short term. This in conjunction with On Balance Volume suggests the bounce is not over here.
This analysis is published @ 07:16 p.m. EST.

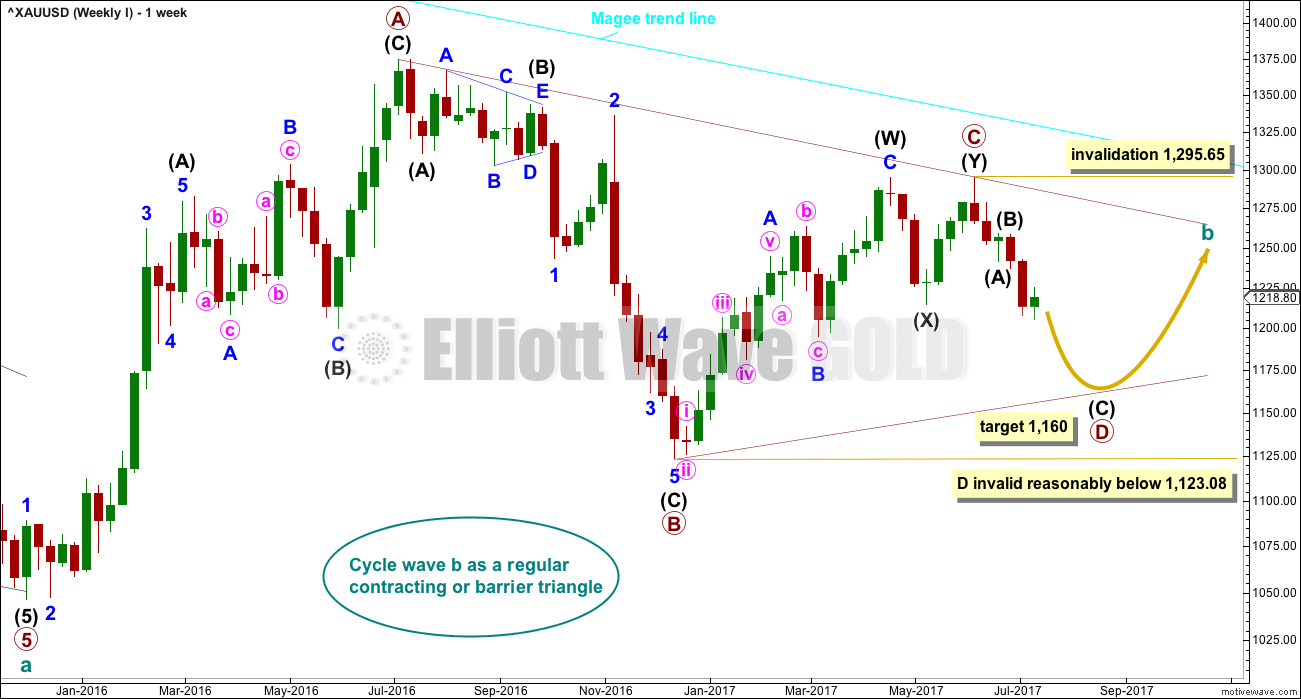
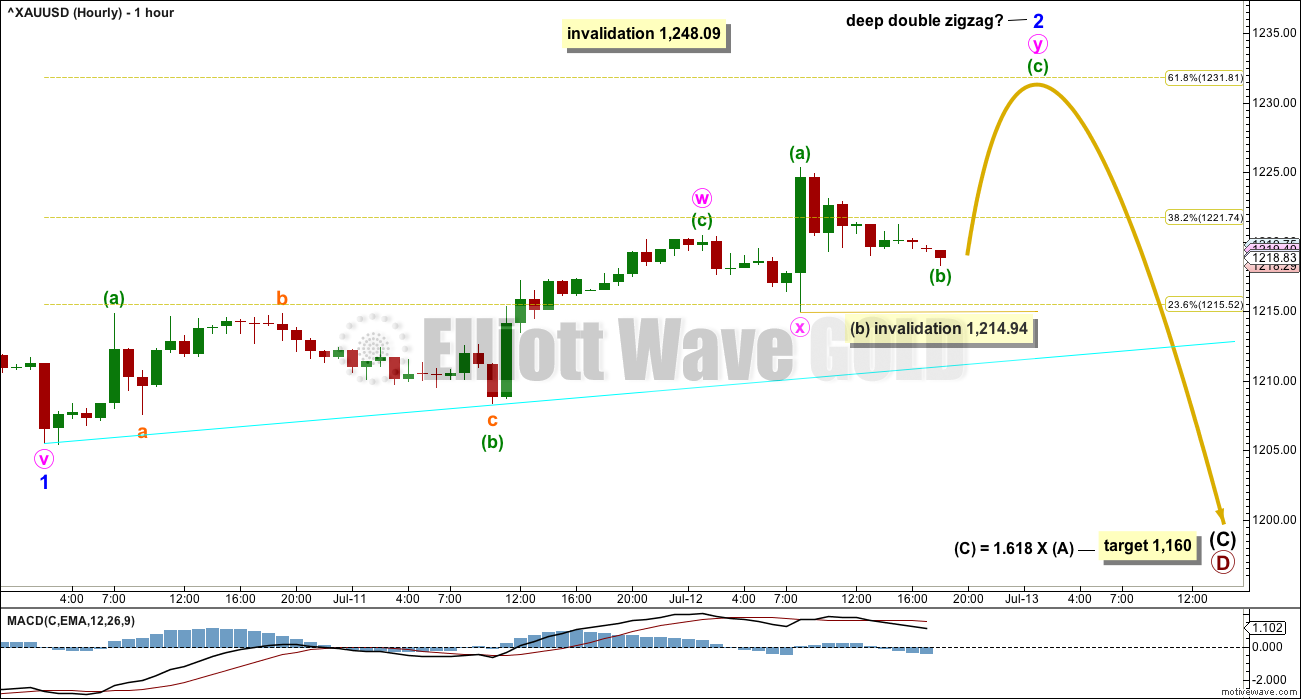
It looks now more like minor 2 is a single zigzag, not a double.
Minute b now looks finished.
Now up and away for minute c.
This is a counter trend movement. My strong advice would be to stay with the trend. Use a bounce as an opportunity to join the trend.
If trying to tade this upwards be aware there is more risk. There are multiple corrective structures, and although my labelling so far indicates a zigzag it may yet morph into something else. It is impossible for me to tell you with any reasonable confidence during a correction exactly how price is going to make it’s smaller moves. The focus should be on identifying when the correction is over and when we can join the trend.
Only the most experienced of traders should ever try to trade corrections. If you do please reduce risk, expose only 1-3% of equity and always use a stop. Accept the possibility of losses and manage them.
Second post of Spot The Mistakeshere. for those who want to use it as a learning tool, or just to have some fun. Yeah, I said fun. Elliott wave is fun!
Darn it. This comment was in moderation all session.
Will leave posting the answers to the little quiz for one more session to give more people an opportunity to have a go.
Will go now and respond to your efforts.
50% long and dying to go all in right now, but feels so bleak and hopeless. Will refrain from doing it but staying with the current long position. There seems to be some buying being uncovered at this level, for now. Heavy overhead resistance still looms. Need a catalyst to break out one way or another.
Hi Lara,
I placed a comment on July 12th analysis- Developing an Alt for Gold. Would you take a look when you can….and let me know if my example based on multiples makes any sense.
Thanks….Melanie
Okay
You have it exactly right.
Gold Daily Analysis
Data as at market close, July 12
===========================
Gold prices spiked to a high of 1225.33 on Wednesday, immediately after Yellen’s written testimony was released. According to her statement, the Fed “continues to expect that the evolution of the economy will warrant gradual increases in the federal funds rate over time”. Investors took it to mean that the Fed is not expected to raise interest rates in their next meetings in order to reach the neutral Fed funds rate. However, there was no follow through, and prices slipped gradually soon after.
It is telling that the spike had not breached the brown uptrend trendline (not shown), which was support turned resistance. At the same time, prices had also not broken above the purple downtrend resistance line which I had drawn in the Weekend Analysis. This means that prices are in a consolidation mode, waiting for reinforcements to launch another assault at those two trendlines.
Herein lies the crux of the gold movement. If prices can break above the brown and the purple trendlines, then the bearish trend becomes greatly diminished. With added vigour, the trend can easily be nudged into bullish mode once again, with 1260 and 1300 within gunsight. But, if gold is unable to break above these trendlines convincingly, then the bears will resume control, steering towards the previous low of 1205.41, and thence towards their camp at the 1195-1184 region. Further forays could bring prices down to 1160. Let’s explore these possibilities using Ichimoku.
The Daily Ichimoku Chart shows an invitingly green kumo until the second week of August. The possibilities are an attack of the cloud region, or at worst, a benign drop. IF prices could break above the staunch resistance of the brown and purple trendlines, then the obstacles are the daily tenkan-sen resistance at 1228.60 followed by the 200 day SMA at 1234.85. Forging ahead, the 50 day SMA at 1248.69, followed closely by the daily kijun-sen resistance at 1251.40, would next be tested. Breaching these would bring prices into the relative safety of the cloud. BUT, in the short-term, gold is still in bear territory. The tenkan-sen remains way below the kijun-sen, and both lie below the cloud. Moreover, at the daily level, price still remains below both the tenkan-sen and the kijun-sen. On balance, the bulls still have a lot of work to do. I would say that their first mission is to breach both the brown and purple trendlines. If this comes to pass, prices will be pushed towards 1260 at least. But, if the bulls chickened out in battle, then a drop towards at least 1180 is in order. By today, if not this week, some clarity should prevail.
How is copper looking Lara or anyone have a count
We might be in minute ii of minor 3 of intermediate (A) right now. I have a feeling this will be a deep 2nd wave…
Any chance you can show copper on a chart I am new to Elliott wave and sometimes have trouble picturing it without a chart thanks for all your help
Looking very nice indeed today for a punt on the short side IMO.
That green trend line has been held since August 2011, has been tested now at least 10 times and doesn’t have too steep a slope. It has very strong technical significance. Expect resistance to very likely hold there, so each time price comes up to the line it offers a good entry to go short.
The two upper wicks of the last two daily candlesticks are long, that looks bearish.
Ari. In case you missed it, I’ve replied to your query on oil in the same day that you posted, i.e. yesterday. To recap, there is not much change in the movement. Price is in the C subwave of a second wave. My price target is the same as Lara’s with the possible exception that it might complete slightly earlier at the weekly cloud bottom boundary at 47.32.
Thanks Alan 🙂