Price has moved sideways and remains above the invalidation point on the hourly chart. The correction is taking a little longer than expected.
Summary: In the short term, a bounce may continue higher for another one or two days now, to end about 1,228 to 1,232. This bounce at its end should offer an opportunity to join the larger downwards trend.
Profit target is now at 1,183 (measured rule) or 1,160 (Elliott wave).
Always use a stop and invest only 1-5% of equity on any one trade.
New updates to this analysis are in bold.
Last monthly charts and alternate weekly charts are here, video is here.
Grand SuperCycle analysis is here.
WEEKLY CHART
The Magee bear market trend line is added to the weekly charts. This cyan line is drawn from the all time high for Gold on the 6th of September, 2011, to the first major swing high within the following bear market on the 5th of October, 2012. This line should provide strong resistance.
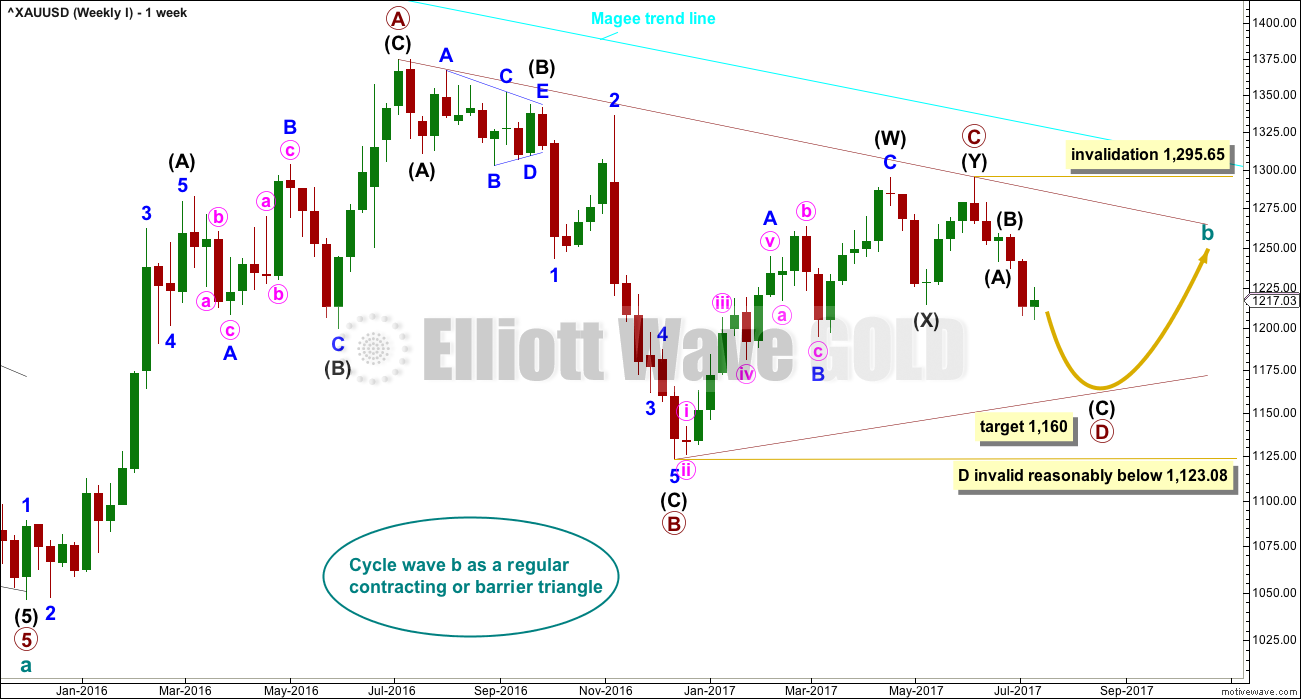
At this stage, a triangle still looks most likely and has the best fit for cycle wave b.
Within a triangle, one sub-wave should be a more complicated multiple, which may be primary wave C. Primary wave C may not move beyond the end of primary wave A above 1,374.91. This invalidation point is black and white.
At this stage, it looks like primary wave C is now complete at the hourly and daily chart level. A new low on Friday below 1,214.81 cannot be minor wave B within intermediate wave (Y) within primary wave C, so now primary wave C must be over.
Primary wave D of a contracting triangle may not move beyond the end of primary wave B below 1,123.08. Contracting triangles are the most common variety.
Primary wave D of a barrier triangle should end about the same level as primary wave B at 1,123.08, so that the B-D trend line remains essentially flat. This involves some subjectivity; price may move slightly below 1,123.08 and the triangle wave count may remain valid. This is the only Elliott wave rule which is not black and white.
Finally, primary wave E of a contracting or barrier triangle may not move beyond the end of primary wave C above 1,295.65. Primary wave E would most likely fall short of the A-C trend line. But if it does not end there, then it can slightly overshoot that trend line.
There are three alternate wave counts that have been published in the last historic analysis, which is linked to above. They are all very bullish. They will only be published on a daily basis if price shows them to be true with a new high now above 1,295.65.
DAILY CHART
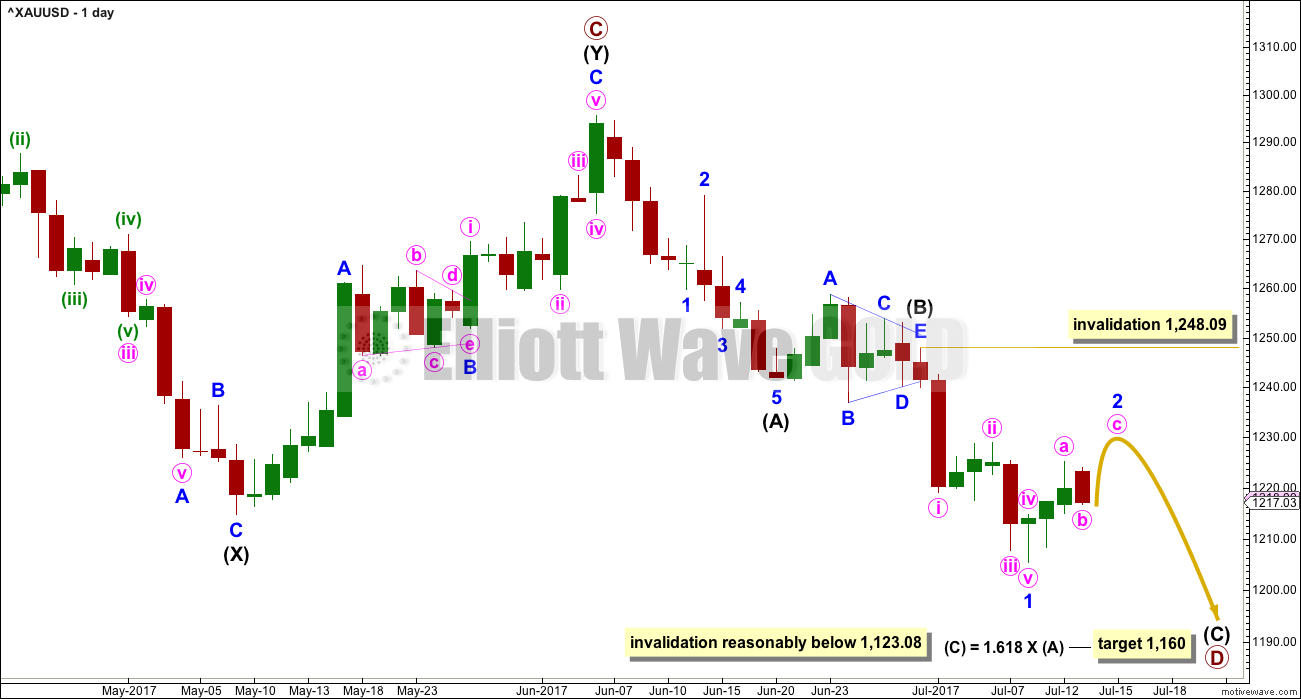
A new low below 1,214.81 could not be minor wave B within intermediate wave (Y) and has now provided strong confirmation that intermediate wave (Y) is over.
A common range for triangle sub-waves is from about 0.8 to 0.85 the prior sub-wave, this gives a range for primary wave D from 1,158 to 1,149. A Fibonacci ratio is used to calculate a target, which is just above this common range, for intermediate wave (C) now that intermediate waves (A) and (B) look to be complete. At this stage, to try and see the whole of primary wave D complete at Monday’s low does not look right. The B-D trend line would be too steep for a normal looking contracting Elliott wave triangle, and primary wave D would have been far too brief at only 5 weeks duration. For the wave count to have the right look and good proportions (as Gold almost always does), primary wave D should not be labelled over yet.
If primary wave C is correctly labelled as a double zigzag, then primary wave D must be a simple A-B-C structure and would most likely be a zigzag. With a triangle complete in the position labelled intermediate wave (B), the idea of a zigzag unfolding lower is strengthened. This may not be labelled a second wave as second waves do not subdivide as triangles. Triangles appear in positions of fourth waves, B waves, or within combinations.
Intermediate wave (A) lasted only ten days. Intermediate wave (B) has lasted eight days. As intermediate wave (C) is expected to be longer in length than intermediate wave (A), it may also be longer in duration and may last a Fibonacci thirteen days as the first expectation or a Fibonacci twenty one days as the next expectation. So far it has lasted only nine days.
Intermediate wave (C) must subdivide as a five wave motive structure, either an impulse or an ending diagonal. An impulse is much more likely; so let us assume that is the more likely structure until proven otherwise, or until some overlapping suggests a diagonal may be possible.
Within intermediate wave (C), minor wave 2 may not move beyond the start of minor wave 1 above 1,248.09.
Primary wave A lasted 31 weeks, primary wave B lasted 23 weeks, and primary wave C may have been complete in 25 weeks.
Primary wave D should be expected to last at least 8 weeks (but most likely longer). The next Fibonacci ratio in the sequence would be a Fibonacci 13 and then 21.
HOURLY CHART
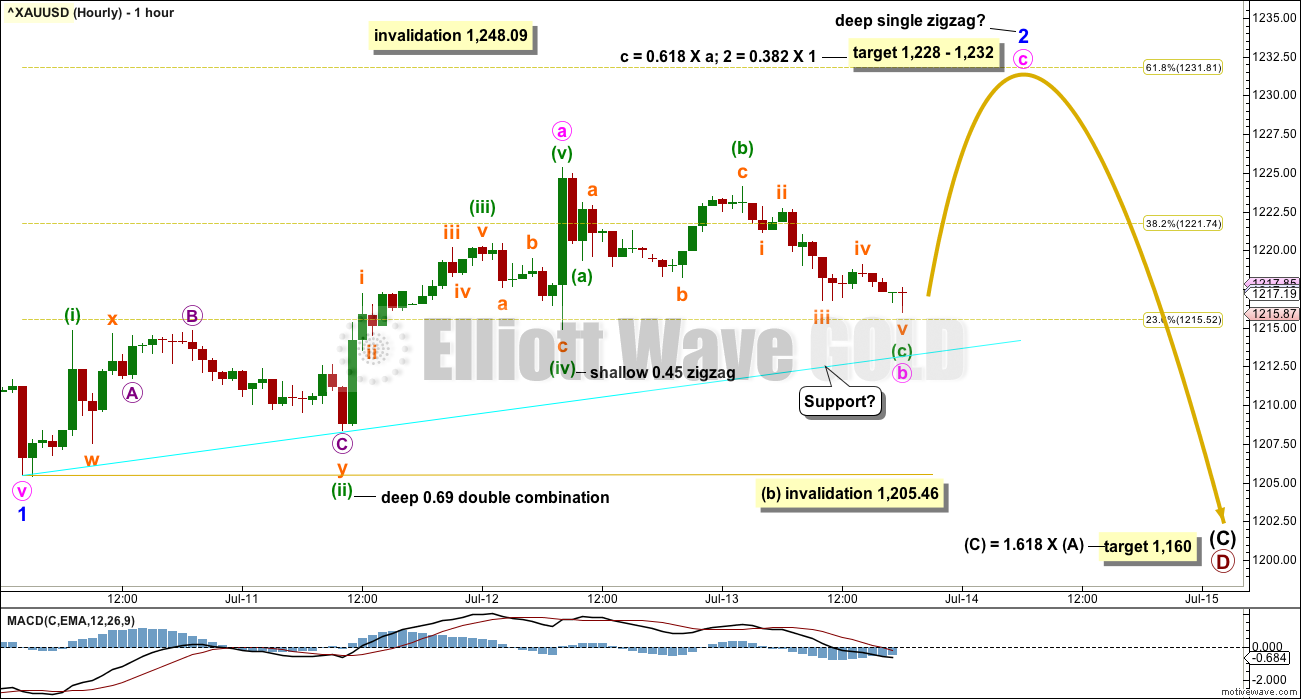
Minor wave 2 now looks like a single zigzag may be completing.
There are still multiple structural options within this correction for minor wave 2. Due to the greater variety of structures within corrections as compared to motive waves, it is impossible for me to tell you with a reasonable level of confidence exactly which structure will unfold. As a correction continues the labelling within it usually changes, so flexibility is important. For this reason it not advisable to try and trade the small movements within corrections.
The focus during corrections is to identify when they are over, when an opportunity to join the larger trend arises.
A $4 target zone is calculated for the bounce of minor wave 2 to end. If it takes another two days, it may total a Fibonacci five sessions.
Minor wave 2 may not move beyond the start of minor wave 1 above 1,248.09.
TECHNICAL ANALYSIS
WEEKLY CHART
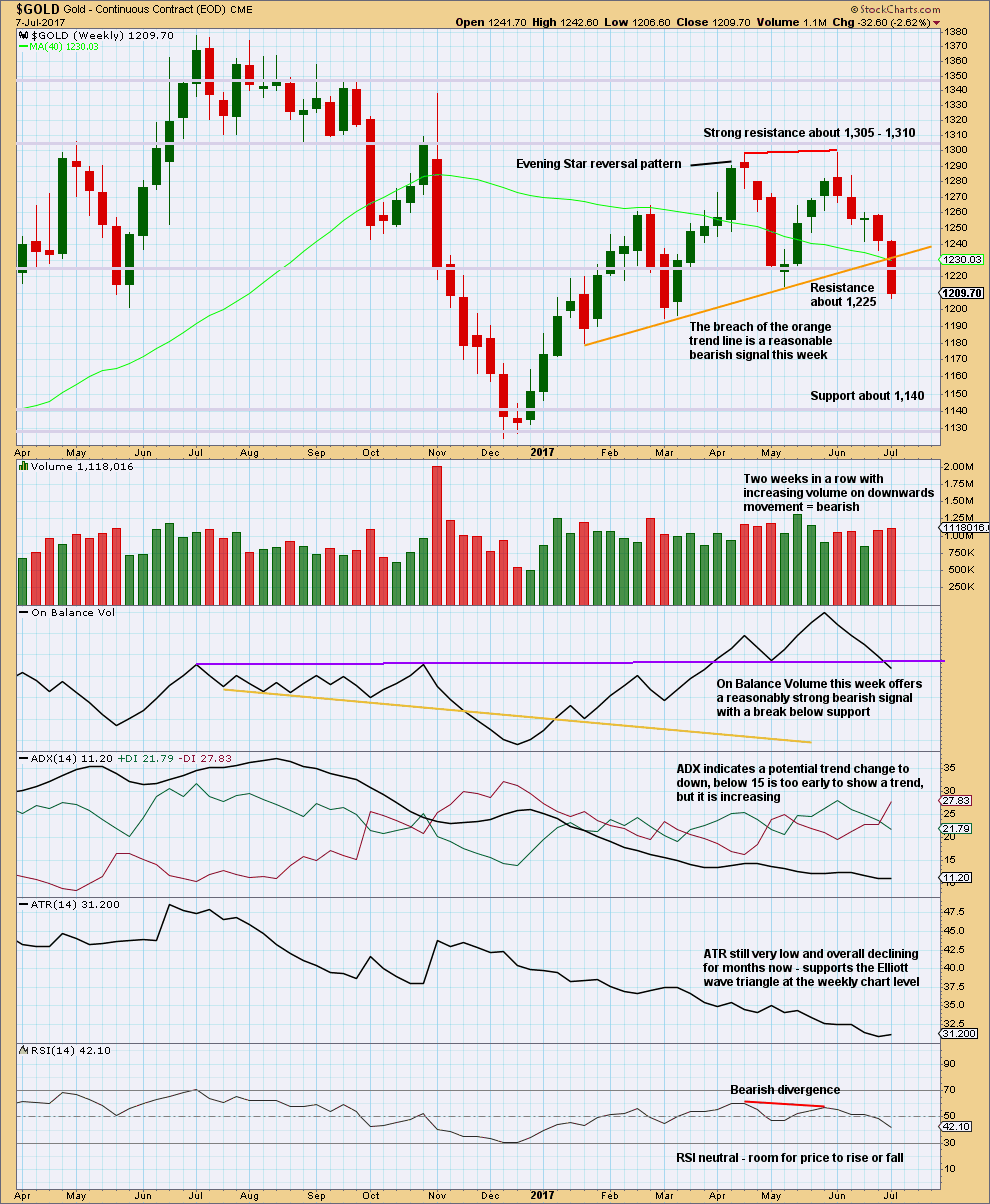
Click chart to enlarge. Chart courtesy of StockCharts.com.
This chart offers strong support to the Elliott wave count.
The breach of the orange trend line by price is bearish. On Balance Volume gives a reasonable bearish signal, which should be given weight. Volume is bearish. ADX is slightly bearish. RSI is bearish.
Only ATR indicates weakness for the bigger picture (the Elliott wave triangle at the weekly chart level), but this does not preclude price from falling further here though.
DAILY CHART
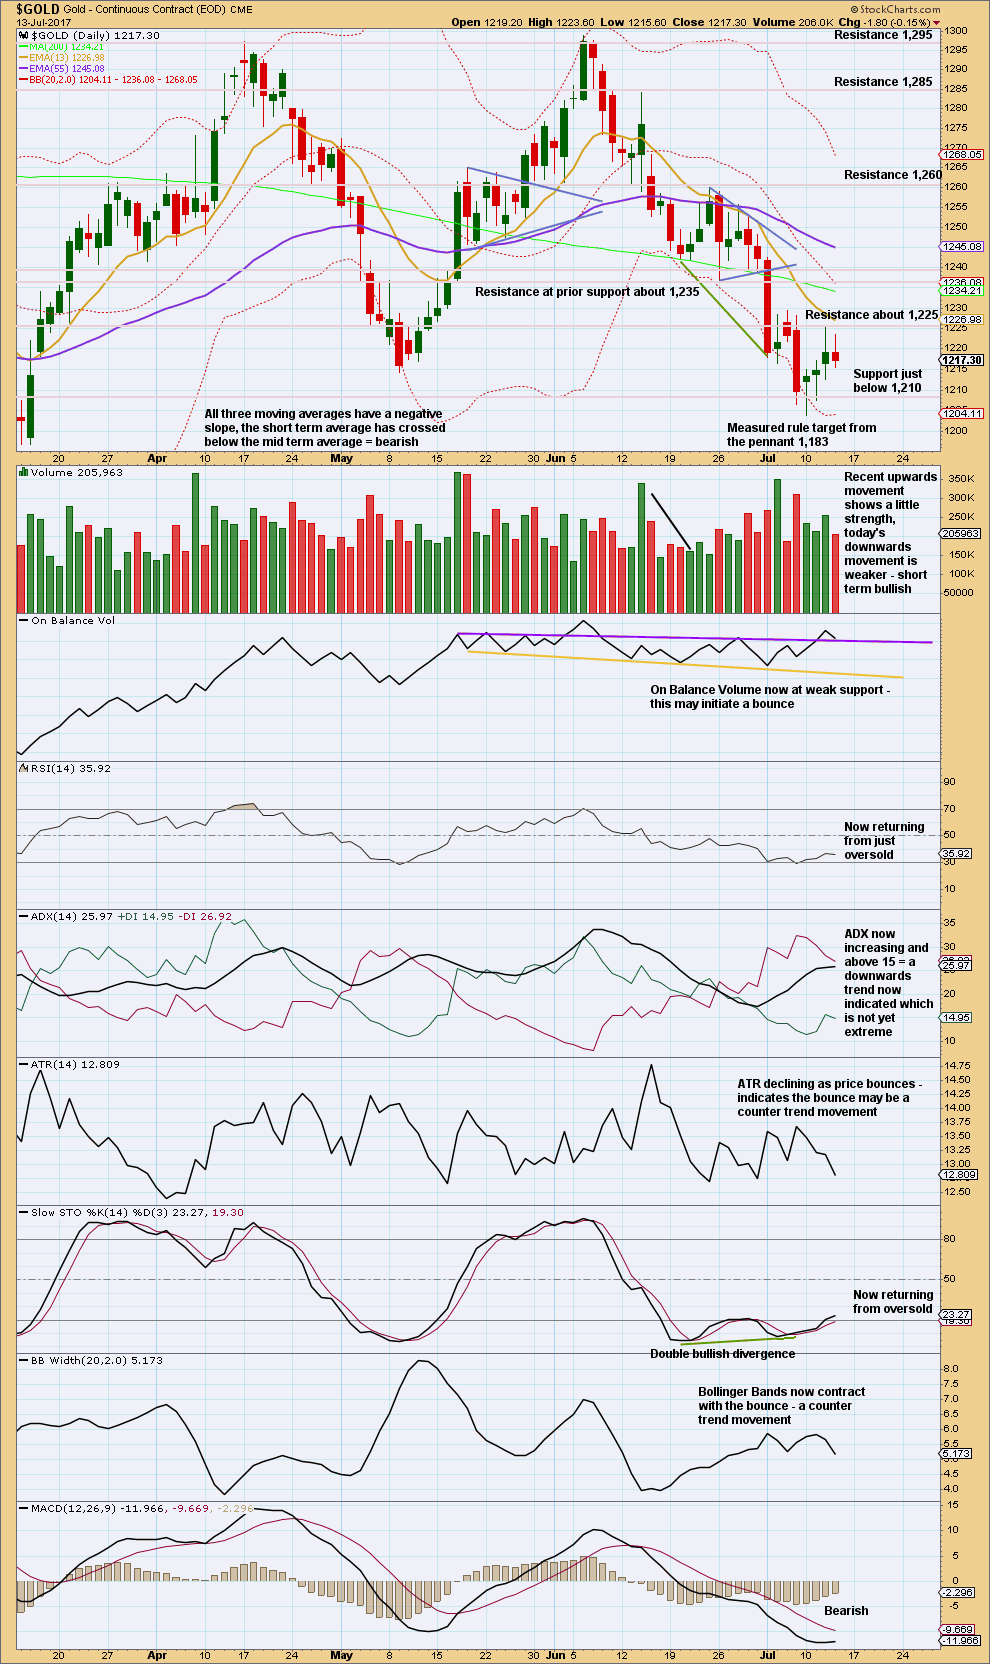
Click chart to enlarge. Chart courtesy of StockCharts.com.
Volume and On Balance Volume today still suggest the bounce is not over.
Look for strong resistance, and the bounce to end, at prior support of the pennant pattern at 1,236.50.
GDX
DAILY CHART
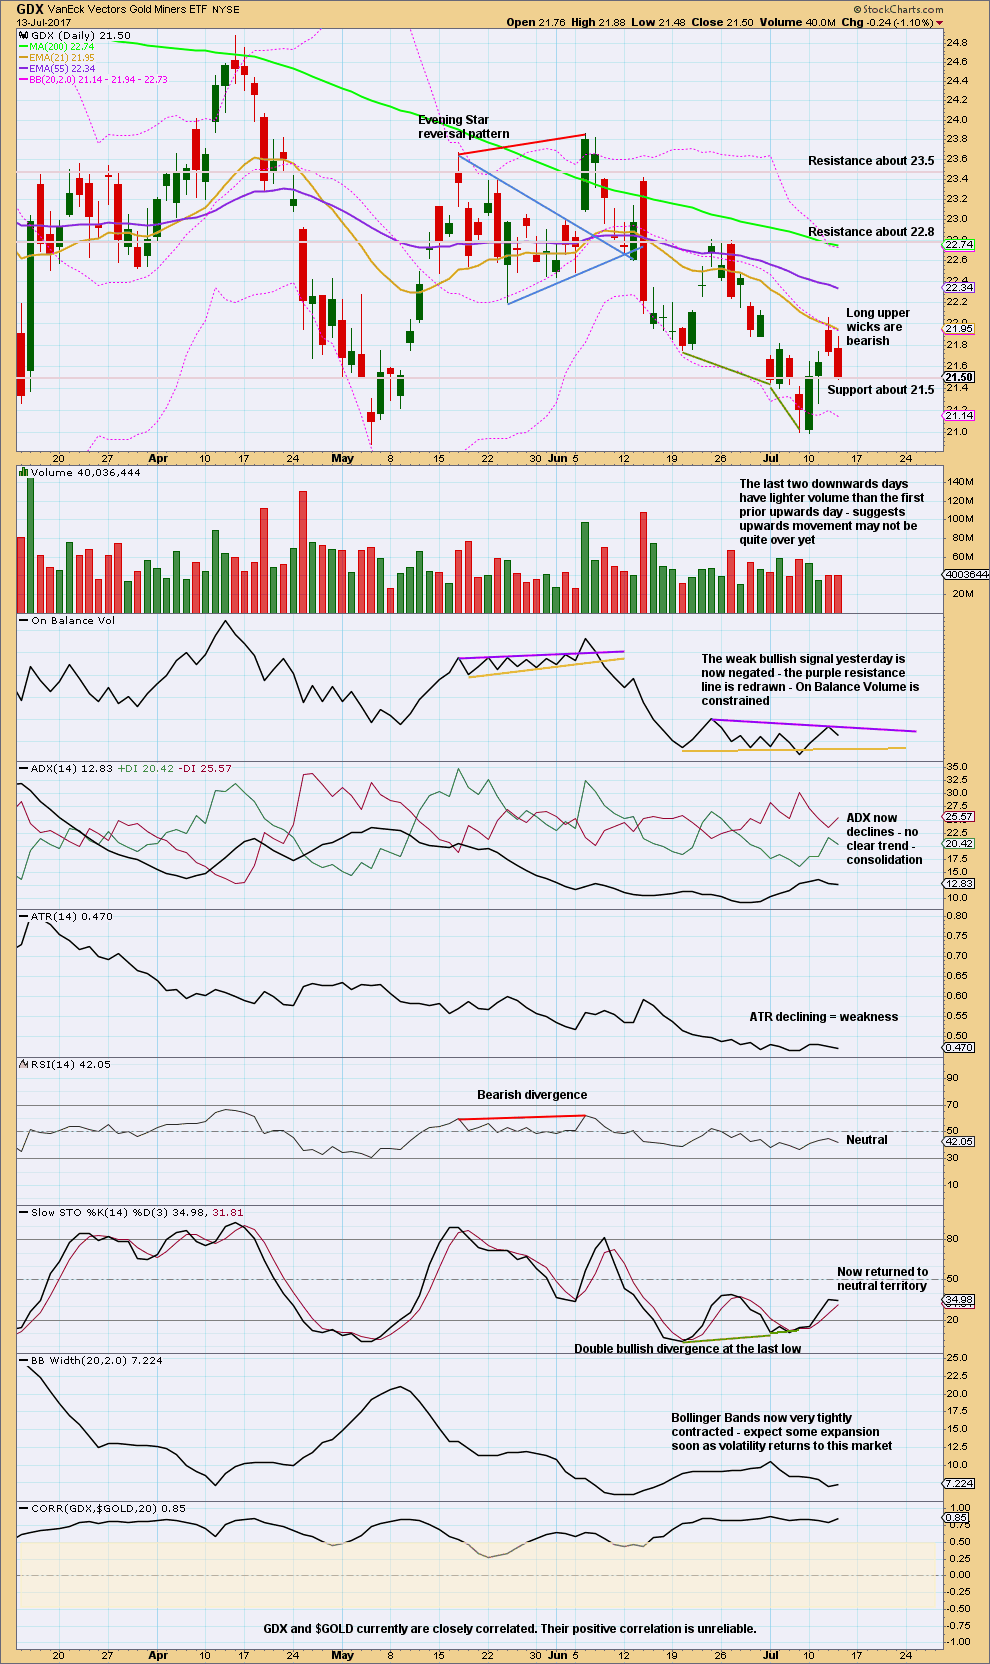
Click chart to enlarge. Chart courtesy of StockCharts.com.
With the last gap now closed, next resistance is about 22.80.
Looks like GDX’s upwards bounce is not yet over.
This analysis is published @ 07:03 p.m. EST.

Lara, is it possible that gold rallies up toward the cyan trendline then rolls over to fall towards primary wave C target of about 1180? To me gold has broken it’s downward trendline, and this looks like the path it would take in order to complete primary wave C of the triangle.
Stockchart daily shows a bullish harami with a breakout to north. What is called a pop gun. So if this has happened, then two more days to the north can be expected. Let´s wait for new EW count. I am excited and looking for opening on monday.
Imo with a bullish reversal in play, will look to stay (staying) long both Gold & Silver for an upturn on weekly outlook basis…. the bears appear to be losing it with Gold price having got a little bottomy at 1217+… Just a view. Best to follow Lara’s analysis though.
Strong hands won”t be affected, but it is an almost certain bet the banksters are going to run long stops with at least one more flush. I just absolutely love it when they pull that very predictable stunt just before a major trend change. Lara’s sharp analysis makes it really easy to take advantage and I am surprised more people don”t smack “em. As a matter of fact, quite a few traders probably do which is why you so often see such sharp reversals off bottoms. I suspect lots of savvy tradrrs open buy stops just below recent lows in anticipation… 😉
Thank you Lara.
Listening to Lara’s call to 1230’s, bought NUGT yesterday prior to US close and sold this afternoon. Nice profit. Jumped on DUST when GDX was @ 21.99. Sold it at closing, again with a decent profit – I just don’t like to hold any position open over the weekend.
Today, I am celebrating 1 year of market trading – it’s a baby step toward taking control of my investment instead leaving it to some guy sitting in the office following what the home office is telling them to do and producing mere 6% a year. My return is 135% this year thanks to people like Lara. Have a great weekend.
That’s fabulous Kyong Park!
Please just remember to manage risk. Even after a year…. you could still hit a bad run. You want your trading account to be able to withstand that.
If you learn only risk management from me I will have done a great job.
I am opening a small initial short position via the GLD August 118/123 call credit spread with a bid/ask of 0.77/0.79 per contract. I am going to give price a bit of room to move higher with a credit limit order or exactly 0.85 per contract. If not filled in a day or two I will take the bid for Gold’s resuming down-trend. How are you guys trading it? 🙂
COT numbers and charts are out. They look pretty good for bullish case. But as Lara shows, bulls are not out of the woods yet by any means:
http://snalaska.com/cot/current/charts/GC.png
sold half of my long position earlier, but letting the rest ride over the weekend.
So far so good….
Let’s see what the classic TA says after NY closes and Stockcharts data is available.
If I’m right then now is the perfect entry to go short. The larger trend is still down, until proven otherwise. And price hasn’t proven it otherwise yet.
If this upwards move shows weakness in volume that would be a good sign. If the candlestick can close with a long upper wick that’d be good too.
Looking at prior support of the triangle on the daily chart (the consolidation that I’ve labelled intermediate wave (B) ) it has it’s low at 1,237.05. So there is still a little room to the upside for this re-test.
This is such typical price behaviour. Consolidate, breakout, curve back up / down to re-test. When we see price do that it offers a low risk high reward entry point to join a larger trend.
Now, this doesn’t always work. Nothing in TA is 100% certain. But it works much more often than it fails. So if we take every opportunity we shall have some losses, but we shall also have more gains.
And that is why risk management is so important. Always use a stop. Invest only 1-5% of equity on any one trade. That way your account can sustain the worst case scenario of 10 losses in a row and still have enough left to keep trading. Math. That’s what those guidelines are based upon. Use math and take out some of the emotion.
It does feel like the gold market is not following through yet. The gold stock volume just isn’t where I would expect it to be, less than average 90day vol in Nem for example. I would expect the vol in gold stocks to be double the average in a new move up. That being said the commercial position is screaming buy buy buy. This doesn’t always catch the exact bottom, but medium to longer term is bullish. Here is the fear…..not much volume in the gold stocks and a stock market that could collapse. This would bring all stocks down with it, possibly even the gold stocks like 2008. I think it might be better to buy options on slv and Gld out a bit to avoid a possible gold stock market collapse should the entire market go into a black hole. If so, would be the buy of the century. Right now commercial short position in silver is less than it was in Jan 2016 before the big move up. If the market does go down as Lara has analyzed this will be a great buying opportunity in my opinion. On the flip side commercials keep going long the dollar, opposite of there gold hedge, which is confusing. Which hedge is right? A new all time high in the market should strengthen the dollar, yet it is down today. This makes me feel that it is being managed. So next week should tell who will win, the stock market sucking in dollars or the gold market. We are very near a major inflection point andLara has given us due notice. …….yikes
I wonder if someone big is in the know about a possible event that would cause a flight to safety worldwide. This would explain the increase in both the dollar and gold simultaneously. Perhaps a North Korean incident. Money would rush out of Japan, South Korea and other counties surrounding NK in search of safety in gold and maybe the dollar too, for a bit. Treasuries have long been sought after in times of trouble. This too shall pass.
COT structure getting very interesting. I posted something on it earlier but it’s in moderation. It is indeed at levels not seen in a long time. Agreed re: the rotten gold stocks lol. They are horrible. I wouldn’t count on a market crash though, as it’s quite bullish, even though it’s not impossible and there are some weaknesses here and there, but it’s got too much going for it. The USD still looks awful.
Gold needs to go above 1250, and gold stocks need to break out on volume. Until then, stay nimble and small if playing the bull side. It very well could be that a confirmation of the bull, if that is what is in store, happens in a gigantic move in one day
“This would explain an increase in both the dollar and gold simultaneously “… meant an increase in commercial net long positions. The commercials have been dumping both gold and dollar short positions over the previous few weeks. This means they are positioning themselves for both the dollar and gold to go up.
Imo will look for 1225-20 to hold for an eventual take out of 1232+… lets see.
Lara: “Within intermediate wave (C), minor wave 2 may not move beyond the start of minor wave 1 above 1,248.09.”
Thanks for excellent reports.
If gold invalidates hourly and daily chart what is next in the tool box?
Thanks.
One of the alternates in the historic analysis.
This. It has a low probability because it’s trying to see intermediate (A) as a five. That wave looks much more like a three.
Also, now within minor C of intermediate (B) of primary Y: the rather obvious triangle that in the main count is labelled intermediate (B) (on the main count daily chart) must be ignored.
Here minor C must be a five wave impulse. And you can’t label the triangle as a second wave correction within that impulse because second waves can’t subdivide as triangles.
Maybe Intermediate wave B could subdivide as a W-X-Y, although overall I agree this count is less likely than the more bearish main count.
Boo Ya. Had a feeling, should have gone all in, but I’ll take it. Let’s see what gold is made of now. Many things are in place for a new bull move if that is what is in store. Or it can just stall and be a move to test resistance before another big fall. We shall see
Wow Lara nailed it again great job
Never ceases to amaze me how spot on Lara’s analysis can be sometimes 🙂
Well, it looks really good so far, and I did get the direction right, but it has to properly reverse before we can say I’ve nailed it.
But thank you for your confidence.
Gold Daily Analysis
Data as at market close, July 13
===========================
Gold prices attempted to rally again on Thursday, being the second day of Yellen’s testimony to Congress. But this time round, gold prices were capped at 1224.10 before subsequently sinking to a new low at 1215.14.
The technical picture is not much different from the one shown in yesterday’s report. Price had so far not launched an assault on the brown or purple resistance trendlines yet. But having said that, prices have rebounded somewhat from the 1215.14 low and could make another attempt today. So, yesterday’s big picture analysis still remains valid: “If prices can break above the brown and the purple trendlines, then the bearish trend becomes greatly diminished. With added vigour, the trend can easily be nudged into bullish mode once again, with 1260 and 1300 within gunsight. But, if gold is unable to break above these trendlines convincingly, then the bears will resume control, steering towards the previous low of 1205.41, and thence towards their camp at the 1195-1184 region. Further forays could bring prices down to 1160.”
The Daily Ichimoku Chart shows that the cloud has turned green and would persist until the second week of August. But, in the short-term, gold remains in bear territory. The tenkan-sen remains way below the kijun-sen, and both lie below the cloud. Moreover, at the daily level, price still remains below both the tenkan-sen and the kijun-sen. The daily tenkan-sen at 1226.10 has proved to be a difficult obstacle to the bulls. So, if the bulls manage to overcome the brown and purple trendlines, and the tenkan-sen as well, then they will need to negotiate the 200 day SMA at 1234.21. A rejection here would send the bulls packing and head towards a test of the March 10th low of 1195.22, and thence the January 27th low of 1181.41.
At the moment, I don’t see anything that could push gold prices strongly beyond the 200 day SMA (and from there rally towards the cloud). Momentum has turned from down to neutral as MACD has turned flat. The lack of vigour in the MACD, coupled with the disinterest shown by the 5-day RSI, points to selling opportunities on short-term rallies rather than buying into the market. With Yellen’s testimony over, investors have only her words and fresh economic data today to dictate the direction of gold prices. Since the theme of Yellen’s remarks seemed to centre on inflation, today’s U.S. Consumer Inflation report takes on added importance. Gold could erase the gains attributed to Yellen’s dovish comments if the CPI comes out well above the forecast. (Forecast is 0.1%, up from the previous -0.1%). The rally could extend even further if the number comes out as expected or lower.
Alan, I notice you keep mentioning brown and purple trendlines but there are none on the chart. Could you please point me to the date where the chart had those lines, or better yet, draw them in again? I’ve lost track as to what you are refering. Thank you.
They are in the Weekly Analysis. In order to see the lines, we will have to zoom out to a longer timeframe, and that wouldn’t be suitable for the Intraday.
For those of you interested in the current fortunes of gold stocks. Short video.
http://theuptrend.evsuite.com/gold-and-silver-stock-trends-20170713/
Not cool. Your intention may be honorable but it’s not cool to pitch another service site. If I want someone else’s opinion, I can search for it myself.
No, it’s okay. I have zero problems with competition. It makes us all healthier I think. I also have no problems with members sharing what they think is other useful analysis from other analysts here.
He appears to be using simple support and resistance mostly, but I would strongly note, he’s not looking at the Gold cash index, he’s looking at the Gold / Silver ratio index. So for members clicking on that link please keep that in mind. Pretty sure you’d notice the charts look really different anyway.
Lara, he’s referring to the XAU which is a gold stock index, very much like the HUI. He normally analyses the stock market, but occasionally ventures into gold stocks. I am not a subscriber.
Okay, I saw Gold / Silver and assumed it was a ratio he was looking at.
That’s the problem with assumptions. It makes an ass out of u and me 🙂
I’ve chosen to delete your last comment in case it is taken badly. And because I think I’ve dealt with the issue above.