
For Friday a bounce was expected to continue to about 1,228 to 1,232. Price bounced exactly as expected to reach a high of 1,231.73.
Summary: The bounce is over here, or it may be over on Monday with a very little more upwards movement. If price does move higher, it looks very limited with strong resistance above at 1,236.50. This bounce may be an opportunity to join the larger downwards trend.
Profit target is now at 1,183 (measured rule) or 1,160 (Elliott wave).
Always use a stop and invest only 1-5% of equity on any one trade.
New updates to this analysis are in bold.
Last monthly charts and alternate weekly charts are here, video is here.
Grand SuperCycle analysis is here.
WEEKLY CHART
Click chart to enlarge.
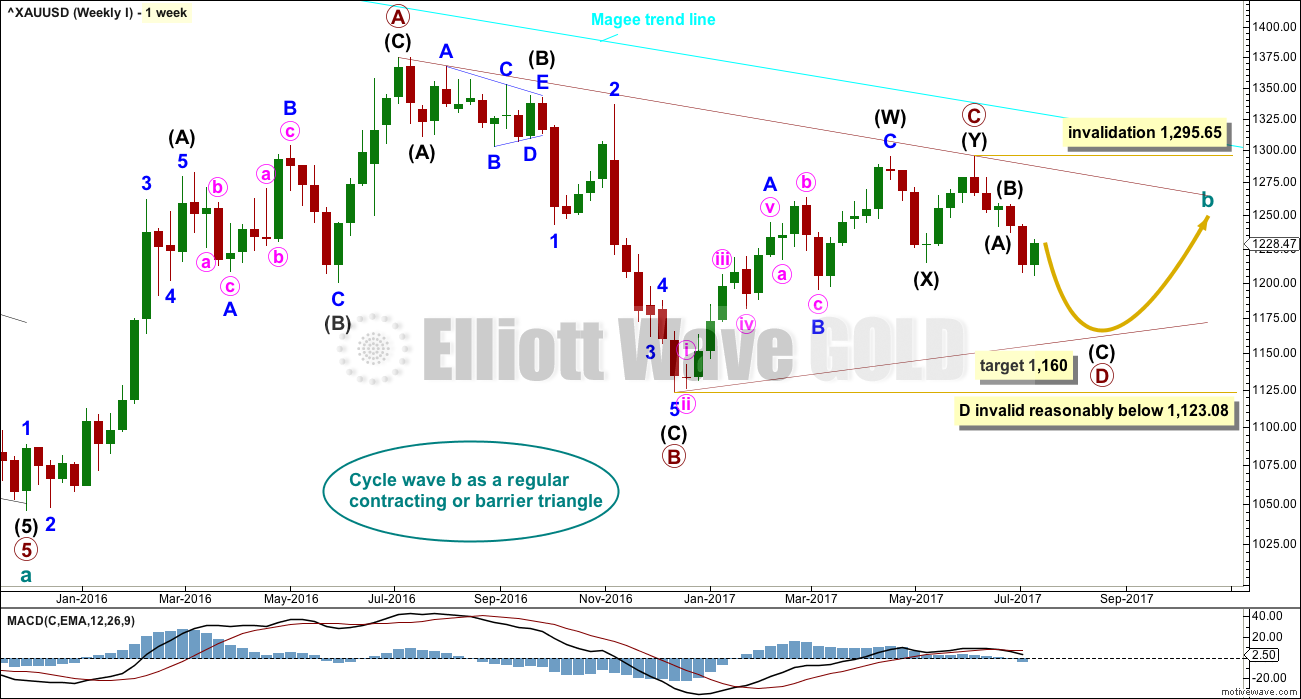
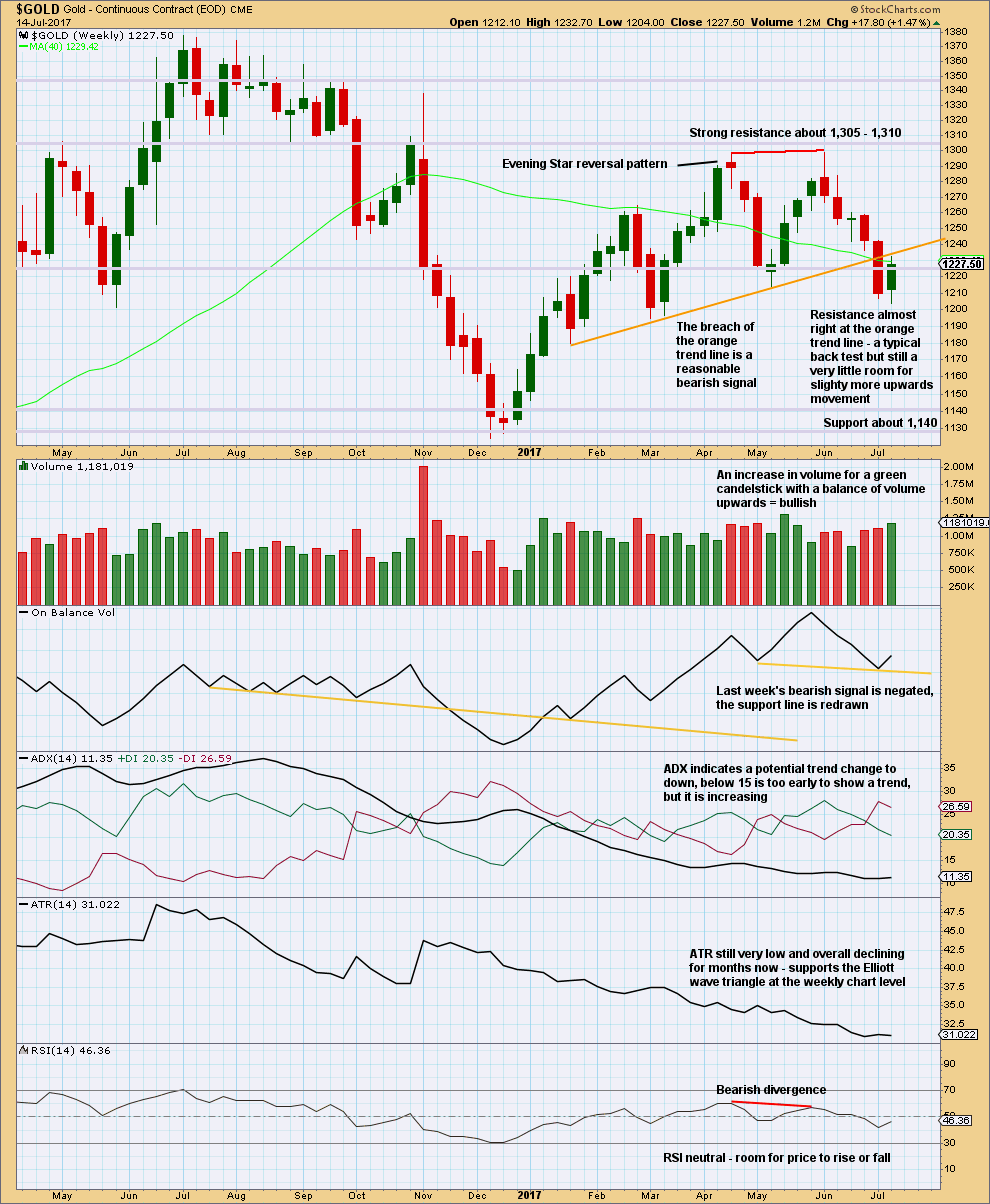
The Magee bear market trend line is added to the weekly charts. This cyan line is drawn from the all time high for Gold on the 6th of September, 2011, to the first major swing high within the following bear market on the 5th of October, 2012. This line should provide strong resistance.
At this stage, a triangle still looks most likely and has the best fit for cycle wave b. It has some support from declining ATR and MACD now beginning to hover about zero.
Within a triangle, one sub-wave should be a more complicated multiple, which may be primary wave C.
Primary wave D of a contracting triangle may not move beyond the end of primary wave B below 1,123.08. Contracting triangles are the most common variety.
Primary wave D of a barrier triangle should end about the same level as primary wave B at 1,123.08, so that the B-D trend line remains essentially flat. This involves some subjectivity; price may move slightly below 1,123.08 and the triangle wave count may remain valid. This is the only Elliott wave rule which is not black and white.
Finally, primary wave E of a contracting or barrier triangle may not move beyond the end of primary wave C above 1,295.65. Primary wave E would most likely fall short of the A-C trend line. But if it does not end there, then it can slightly overshoot that trend line.
Primary wave A lasted 31 weeks, primary wave B lasted 23 weeks, and primary wave C may have been complete in 25 weeks.
Primary wave D should be expected to last at least 8 weeks (but most likely longer). The next Fibonacci ratio in the sequence would be a Fibonacci 13 and then 21.
There are three alternate wave counts that have been published in the last historic analysis, which is linked to above. They are all very bullish. They will only be published on a daily basis if price shows them to be true with a new high now above 1,295.65.
DAILY CHART
Click chart to enlarge.
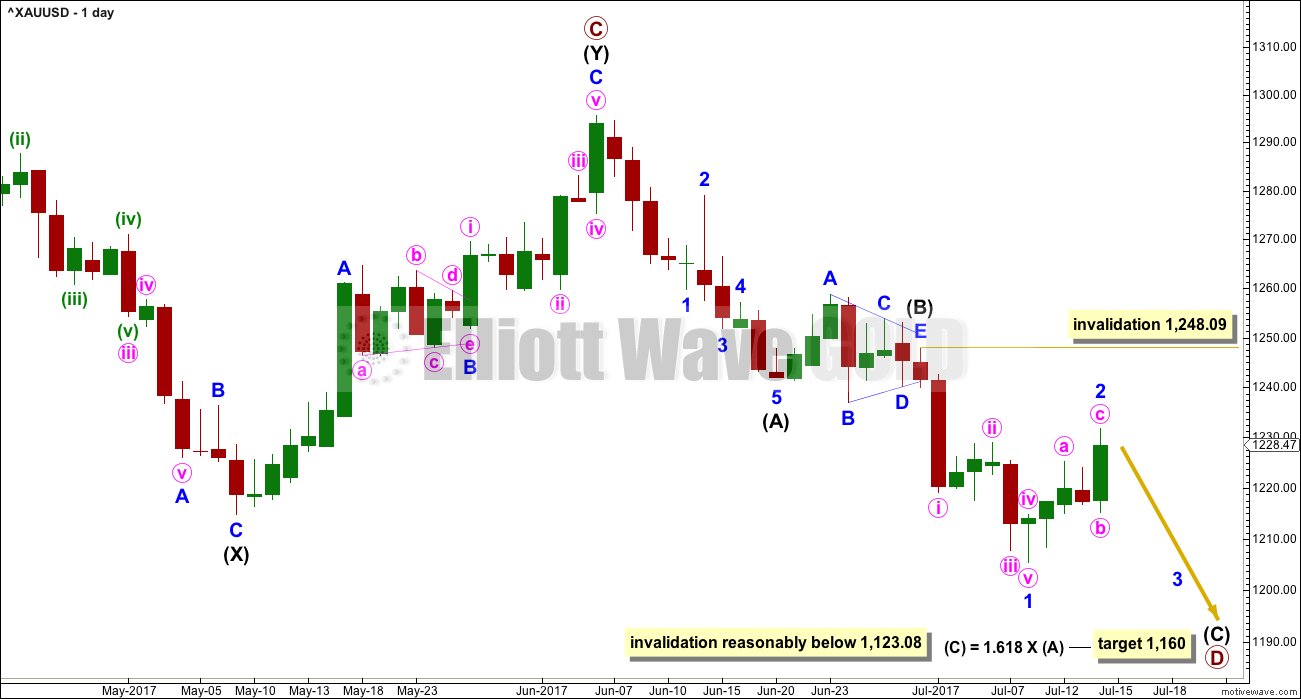
A common range for triangle sub-waves is from about 0.8 to 0.85 the prior sub-wave, this gives a range for primary wave D from 1,158 to 1,149. A Fibonacci ratio is used to calculate a target, which is just above this common range, for intermediate wave (C) now that intermediate waves (A) and (B) look to be complete. At this stage, to try and see the whole of primary wave D complete at Monday’s low does not look right. The B-D trend line would be too steep for a normal looking contracting Elliott wave triangle, and primary wave D would have been far too brief at only 5 weeks duration. For the wave count to have the right look and good proportions (as Gold almost always does), primary wave D should not be labelled over yet.
If primary wave C is correctly labelled as a double zigzag, then primary wave D must be a simple A-B-C structure and would most likely be a zigzag. With a triangle complete in the position labelled intermediate wave (B), the idea of a zigzag unfolding lower is strengthened. This may not be labelled a second wave as second waves do not subdivide as triangles. Triangles appear in positions of fourth waves, B waves, or within combinations.
Intermediate wave (A) lasted only ten days. Intermediate wave (B) has lasted eight days. As intermediate wave (C) is expected to be longer in length than intermediate wave (A), it may also be longer in duration and may last a Fibonacci thirteen days as the first expectation or a Fibonacci twenty one days as the next expectation. So far it has lasted only ten days.
Intermediate wave (C) must subdivide as a five wave motive structure, either an impulse or an ending diagonal. An impulse is much more likely; so let us assume that is the more likely structure until proven otherwise, or until some overlapping suggests a diagonal may be possible.
Within intermediate wave (C), minor wave 2 may not move beyond the start of minor wave 1 above 1,248.09.
HOURLY CHART
Click chart to enlarge.
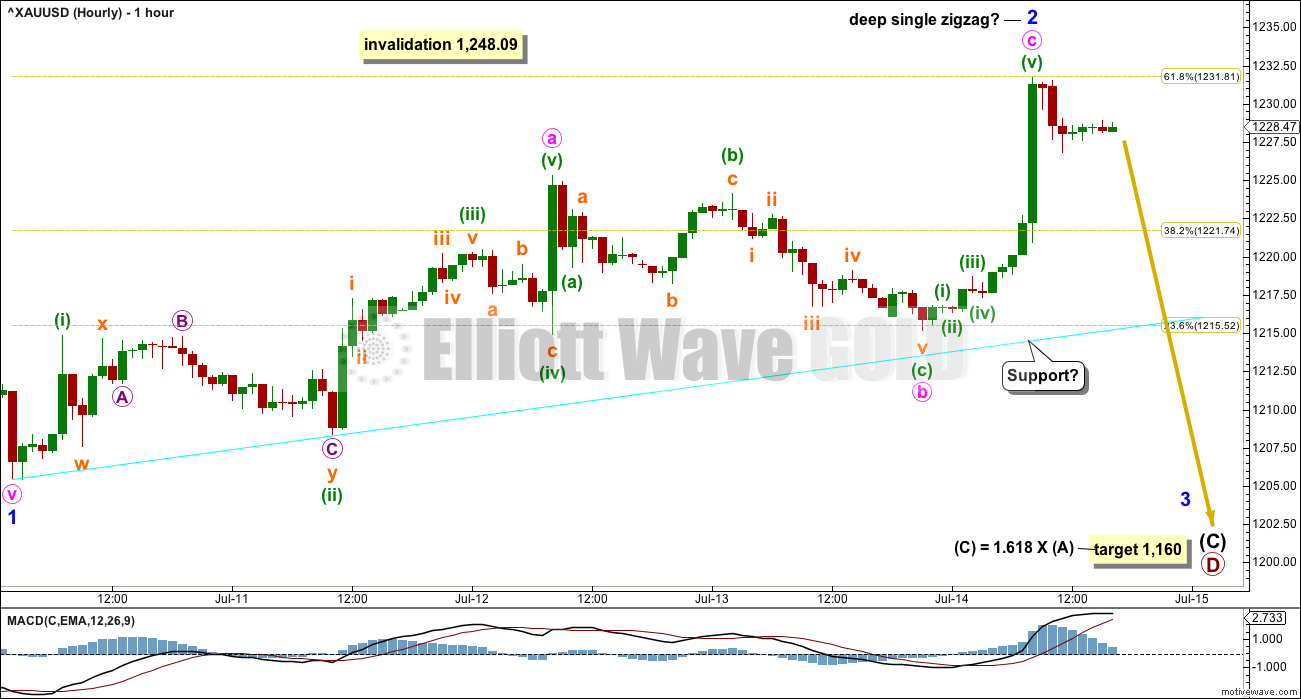
Minor wave 2 now looks best as a completed zigzag. There is no Fibonacci ratio between minute waves a and c.
Minor wave 2 may have ended almost perfectly at the 0.618 Fibonacci ratio of minor wave 1.
Minute wave c may have ended with a swift and strong fifth wave, typical of commodities. While this tendency is more common within Gold’s third waves, it can also show up in its C waves. That may have happened on Friday.
However, some doubt must be on this main hourly wave count due to volume analysis and the structure of the small wave down at the end of Friday’s session. On the five minute chart, this looks like a three wave structure and not a five. If it is a three, then the high is not in place.
A support trend line may serve better here than an Elliott channel. If price breaks below the cyan support line, then take that as a strong indication that the bounce is over and the next wave down is underway.
ALTERNATE HOURLY CHART
Click chart to enlarge.
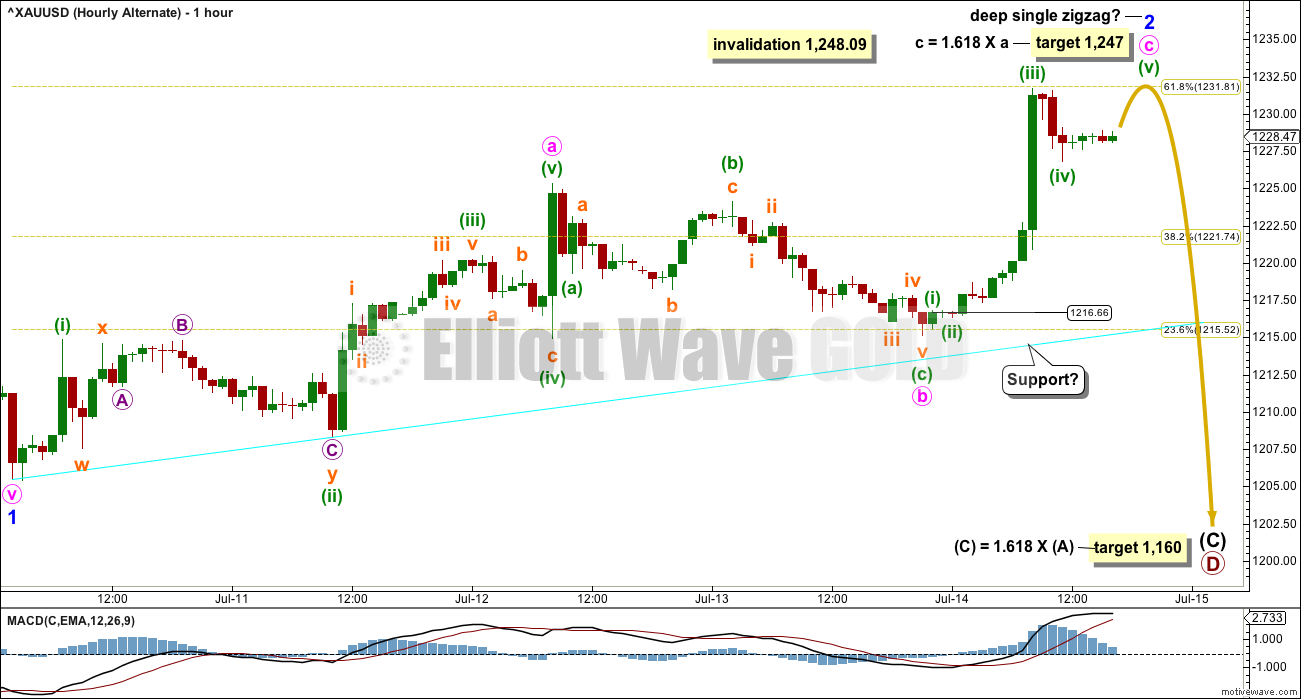
I have tried to see minute wave a only over at Friday’s high and it will not fit. I have also considered a possible double zigzag structure but this does not have a very good look.
If minor wave 2 is continuing, then at this stage the best wave count would see it still as a single zigzag, with minute wave c incomplete.
Because minuette wave (iv) may not move into minuette wave (i) price territory below 1,216.66, a new low below this point could not be minuette wave (iv), so at that stage minute wave c and minor wave 2 should be over.
If price breaks below the lower edge of the cyan trend line, this wave count would be discarded in favour of the main wave count.
The next Fibonacci ratio to calculate a target for minor wave 2 to end produces a target that looks to be too high. I do not have much confidence in this target. I have more confidence in resistance about 1,236.50. If minor wave 2 continues higher, it may be only by a little.
TECHNICAL ANALYSIS
WEEKLY CHART
Click chart to enlarge. Chart courtesy of StockCharts.com.
After a breach of the orange trend line, price is now typically curving up for a back test. What would be most typical to see now would be for price to move down and away. That does not always happen, but because it happens much more often then it offers support to the Elliott wave count. The alternate hourly wave count would allow for a little more upwards movement to come up to touch the trend line; there is just a little room there.
DAILY CHART
Click chart to enlarge. Chart courtesy of StockCharts.com.
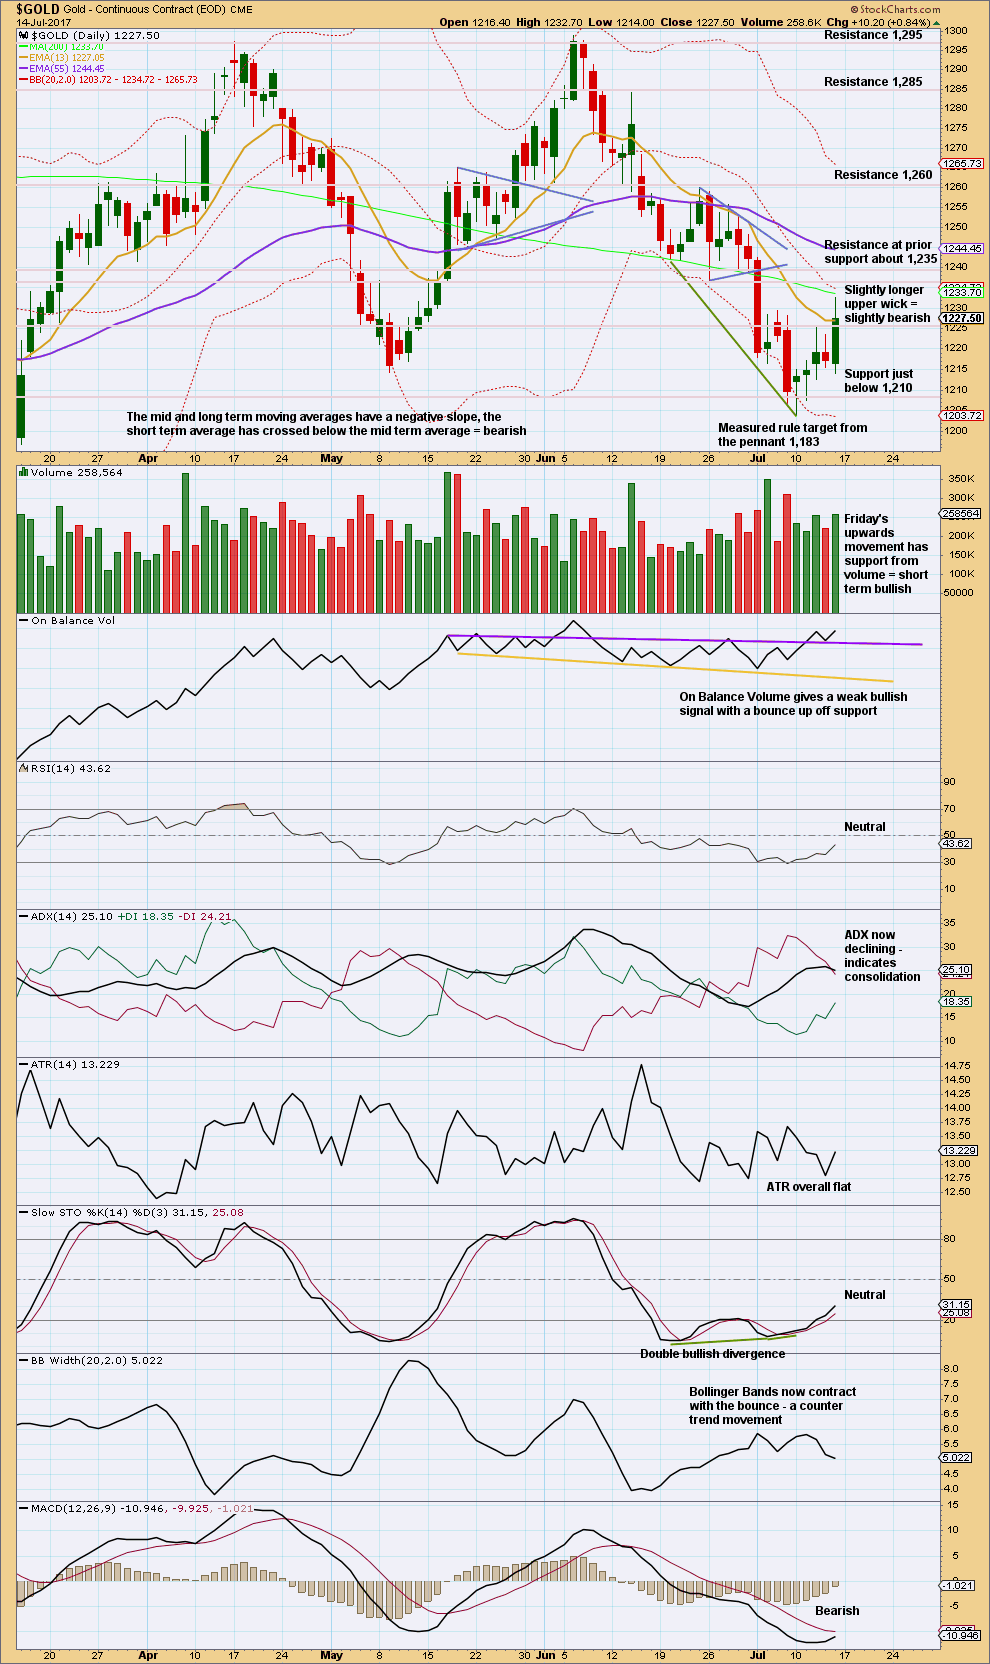
Volume suggests that the bounce is still not over. There is a little room for price to move higher.
GDX
DAILY CHART
Click chart to enlarge. Chart courtesy of StockCharts.com.
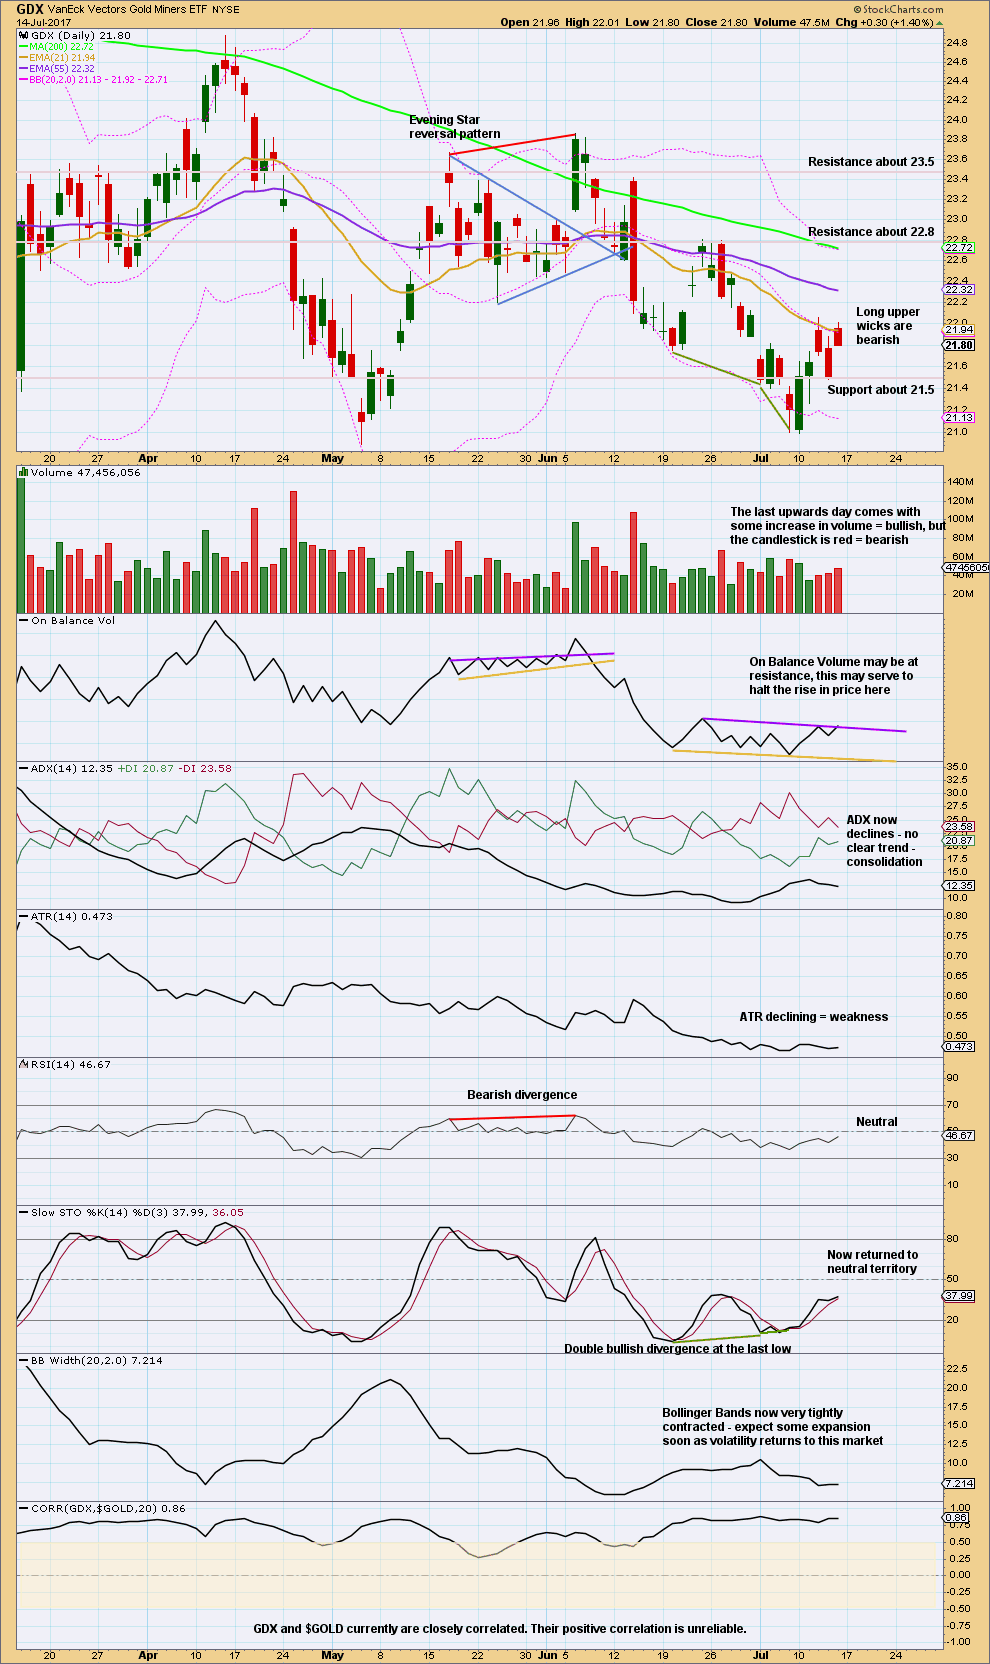
It looks a little more like the bounce may be over for GDX.
This analysis is published @ 11:49 p.m. EST on 15th July, 2017.
I don’t post often, but I agree with Lara’s analysis. GLD is the etf that I follow and it just retracing back to its resistance point and where it broke down. I would use this bounce to take profits on the long side. Taking a short tomorrow. Happy trading!
Main count updated.
Second waves can be very deep. Their purpose is to convince us that price will continue in their direction.
While price remains below 1,248.09 we still have a series of lower lows and lower highs at the daily chart level. The trend is still down, until proven otherwise.
Again, it is possible that minor 2 could be over. I’ve drawn the Elliott channel today about this zigzag. Price is now sitting on the upper edge. That’s okay, sometimes C waves do that. They can be strong.
When / if this channel is breached to the downside (the lower edge breached that is) then it would offer confidence that a third wave down is underway.
If price keeps going up use the target on the alternate at 1,247.
Got filled today on initial half of short GLD position via August 120/125 bear call credit spread for credit of 0.40, a very good entry price. Will add second half on breach of EW channel for full complement. Here’s hoping we don’t get a bear raid via futures overnight.
Imo don’t see why Gold price should not get further overbought and bull higher for 1242+ slowly turning resistance in to support; a stop at 1230 or previous close 1228.xx should work. Its tense staying long at these over ought levels 1234-35 with a slow down in momentum lol. Lets see what happens and if Gold price can get us past 1250…. Interesting. GL all!
Agreed. If gold were about to turn down in a big way at resistance as the bear count expects, i feel like it would be showing a lot more weakness in the tape at present. I’m not sure if should even have gotten this far. Seems to me it is gearing up for a run at the 50 dma at a minimum. But I’m still saying small and playing it close on the long side
I know hoping doesn’t sound like a sound investment thinking, but I am hoping GDX and GOLD will bounce off the resistance / support line and head down.
This is Part (2). I will post the graph as a reply. The system still doesn’t allow me to post both together.
The Hourly Ichimoku chart shows that the tenkan-sen lies above the kijun-sen, and both lie above the kumo. Gold prices are trading above these two lines. The kumo is turning green in the next hour. The trend has become bullish. If price continues to rise, the next resistance will be the weekly kijun-sen resistance at 1238.40, followed by the weekly top cloud boundary at 1249.00.
It appears that the high at 1231.73 reached last Friday was only minuette 3 of Minute C, with minuette 4 settling at 1226.81. Now, minuette 5 is underway. If minuette 5 = 0.618 * minuette 3, it would end at 1236.31. But then, minuette 5 could also extend. We’ll just have to let this upwave play out.
Data accurate as at 9:50 am ET.
Interesting Alan. 1236 is where I have the backtest of the trendline that was broken on 7/3. It was up there this morning on gold futures.
Agreed Vince. I think you and I are referring to the same line. I have it as the brown trendline in the post below: Part (1).
Ichimoku Gold Intraday Update (Part 1)
Data as at 9:30 am ET July 17
=================================
The daily chart shows that gold prices had broken out of the purple downtrend line, and is attempting to break above the brown support-turned-resistance uptrend line. If prices do break above the brown line as well, an increasingly bullish outlook obtains.
I was trying to post the second part of the update, but encountered a 404 error. I would need to post it after the system resets.
Looks like I may have punted on 3rd down Friday when I shorted copper looking for it to turn down soon we shall see
Brandon
Be careful shorting Basic material complex.
———————————————————————–
Emerging Markets And Basic Materials Breaking Out Together
“This last chart for tonight is a weekly line chart which is showing the potential breakout underway. What the emerging markets and basic materials sectors are strongly suggesting is that there is a big move coming which has global implications for growth even if we can’t rationalize why at this point in time. We should see a very strong rally over the next 2 years or so equal to the rally out of the 2009 low to the 2011 high. Have a great weekend. All the best…Rambus”
http://news.goldseek.com/GoldSeek/1500237180.php
I was waiting for this outbrake. So what now 🙂
The bullish trade from the day chart should end at 1248.09$. I guess this is too much for one day.
At this juncture I might like to scale back a bit and restrict my posts to the weekend summary, with the occasional updates should prices deviate markedly from the intended trend. It is rather taxing having to do an analysis on a daily basis, leaving me with less time for my other pursuits. Moreover, there is not much change on a day-to-day basis. Lara’s website does not provide any idea of readership, other than responses to a post, which makes me wonder whether there are only a few people consistently reading the daily ones. If the readership is low, then the cost-benefit ratio is really quite atrocious.
Alan,
Some here only want to read Lara’s guidance, which is fine since that’s what they are paying for.
Others also take advantage of “the community” created here by many smart subscribers with valuable viewpoints, Elliott Wave or other technical analysis. I personally think that your short intraday thoughts on the market when Lara is unavailable are most helpful to members that may need some reassurance or guidance.
I know there are many more that read the comments here and just don’t have time to post or just don’t want to post.
I’m confident that you have a solid base of followers that appreciate your hard work, myself included. Best to contribute as your schedule permits than to burn yourself out. It’s very generous of you to share your thoughts as time permits. 😍
+1
Thanks for posting your analysis Alan!
Of course Dreamer is absolutely right – you need not burn yourself out.
So, we’ll continue following your comments whenever you are able to post. Much appreciated!
I pay attention to you and Dreamer than Lara. Both of you are more definitive with where you think things are going. I don’t get as much value for “if it goes this way then b happens and if b happens then a happens and if a happens z happens but if z and a happens q happens” and essentially all that really boils down to is it will either go up or down. Please keep posting
Thanks Ivne for your support.
To be fair to Lara, her posts come a few hours after market close. Mine is much nearer to the market open the next day, and so the price changes in those few hours have been factored in. Also, Lara has to cover all bases. This market is already quite difficult to analyse as it stands. Prices could swing either way, often without much warning. In terms of personality, Lara is trained in science, and scientists are more circumspect. I am an engineer by training, and we have been disciplined with a pragmatist outlook, and so our approaches are quite different.
Wow.
You have made no positive contribution to comments in this membership. You have been critical of my analysis, and not in a constructive manner. Your last comment told other members here they were consistently wrong and you were using them as a contrarian indicator.
I asked you to email me and you haven’t.
Now you admit you’re not actually here for my analysis.
Your membership will be cancelled.
Silence or lack of comments from readers is not lack of appreciation. It is called silent majority.
Clarification of Lara analysis in complex highly EW technical term some times needs an alternative way to reinforce the message.
I read post and comment to the clear understanding of the wave counts.
Thanks for posting.
Alan, your work is appreciated. If you need to cut back to weekends only, than do so. Like Dreamer said, you have been very generous with your time and efforts to share frequent updates with us. Thank you, for everything that you do for us.
I love your post please keep them coming as time permits
I do read almost everything on the site and take it into account, when trading/investing. Do appreciate the different angles, but I have little time to respond, as I am a full-time, professional investor, so I concentrate on Lara’s work and additional comments. Thanks for your contribution. Appreciate it.
I appreciate your comment – I believe most people are reading and learning like myself but don’t know enough to comment or share.
Thanks to all who replied. I am indeed overwhelmed by the degree of support shown. I am quite busy on Tuesdays and Thursdays. On other days, I can still squeeze in some time (except this Friday). I’ll try to post as often as my schedule permits.
Thank you. Your posts are critical to my positioning…you’ve been extremely accurate. Take a break when needed, but pls know your work is not in vain. Thanks
I agree with you Alan that you should only post as your time allows. And it should be comfortable for you.
No one is paying you for your analysis, you have no obligation to do it.
Be assured that there are scores of people reading your comments every day. The 80:20 rule: 80% will read, only 20% will engage.
You are most valued here, by me and all other members too.
Hi Allen,
I have been impressed by the amount of work you put into your posts. They definitely are appreciated. Giving financial advice is very daunting in that you want people to understand the potential move in either direction, ergo leading to a long post. I hope you continue to post what you are comfortable with as I know I will find it useful, Thanks again
Hourly GDX thoughts
https://www.tradingview.com/x/KaJQal4Q/
Seeing some mixed signs for GDX:
Bullish signs:
> Price went up on Friday on slightly increased volume
> The weekly candle is a bullish engulfing on a slight increase in volume
Bearish signs:
> Gold made higher highs on Friday and GDX did not, creating a bearish divergence
> No bullish signal yet from OBV
Other developments:
The move down from the 23.86 high is looking corrective so far. This questions the idea that my triangle count for GDX on the weekly / daily charts is complete.
Since February, a falling / descending wedge may be forming and may be close to completion. This pattern would expect a move up very soon.
Sharing an updated triangle count based on this weeks developments
https://www.tradingview.com/x/uC4mNf7a/
If you look at the wedge on a longer time frame there is no breakdown on GDXJ below (like the shorter time frames)
GDX I meant
Gold 60
https://www.tradingview.com/x/27uGxAzr/
Thank you for sharing your hard work
Sorry I posted this in the previous analysis. Reposting it here. Lara, is it possible that gold rallies up toward the cyan trendline then rolls over to fall towards primary wave C target of about 1180? To me gold has broken it’s downward trendline, and this looks like the path it would take in order to complete primary wave C of the triangle.
Sorry, to add to what I said earlier, maybe, we have completed the ABC, B being the move from 1240 to 1260. Or is that too short to be a B wave? Thanks
You probably meant to say a fall toward the 1180 target for primary wave D not C as your post stated rin dang.
A substantial move back up would imply that primary D was over and Lara said in her analysis that its duration would have been far shorter than reasonable expectation. At any rate, a subsequent primary E would have to be constrained by the top of primary C at 1295.65
Hi Lara… I was looking at your last analysis of Bitcoin….would you say that the count of Bitcoin is in cycle wave II correction, that could last a year? and the possibiloty that it corrects up to .80 fibonacci retracement? Thank you,
Best regards.
I won’t be posting an analysis on silver as Lara had updated very recently, and there isn’t much that I could add on.
US Oil Weekly Ichimoku Analysis
Data as at market close of July 14
============================
The WTI crude oil market rallied a bit from the 43.65 low to a high of 46.74 on Friday, almost challenging the 47.32 high reached the week before.
Prices have traded above both the tenkan-sen and the kijun-sen. The tenkan-sen had made a positive crossover with the kijun-sen on Monday, providing a signal for this rally. Prices had also briefly broken above the 50-day SMA on Friday, only to fall back below it. Although MACD is rising, the 5-day RSI is at the 70 overbought mark, indicating a price fall is imminent. This divergence in the two indicators, together with the likely continued pressure of the 50-day SMA, may mean a slowdown in the rise in price this coming week. I would think that prices could poke above the cloud slightly, just like in mid- to late May. The highest it could go would most likely be the 200-day SMA currently at 49.59. I would expect a turnaround anywhere between the top cloud boundary at 47.03, and 49.59.
The events which could influence the oil price this coming week would be the API report on Tuesday and the US Energy Information’s inventories report on Wednesday. The price action and the positive response last week to potentially bearish news seem to suggest that an upside bias is forming. Given the bearish fundamentals and the strong upside action, the rally last week was likely being driven by aggressive speculation. If this speculative buying continues and shorts begin to cover then an exhaustive candle would appear, most likely towards the end of this coming week. Although the Fed is priming for a weaker dollar to support the oil market, I don’t think it can truly work out.
End of Week Analysis
Data as at the market close of July 14
===============================
Gold markets briefly fell in the wee hours of Monday morning but found support at 1205.41 to bounce significantly, reaching a high of 1231.73 on Friday before dipping slightly into the weekend market close.
The high reached on Friday is right smack at the confluence of the brown uptrend line, which was support turned resistance, and the purple downtrend resistance line. Rejection would mean that prices will turn down from there, and the market should then drop towards the psychological 1200 round number this coming week. If we break down from there, then gold would continue on to the support given by the pink uptrend line. This line is drawn from the two past major lows and should have some relevance.
The alternative scenario is that gold price could assert itself and breach both resistance lines, providing the first indication of an emerging bullish trend. This means that we will probably go looking towards the 1300 level over the longer term, as we have several times during the year.
The kumo is red for the near future but it is relatively thin such that it doesn’t provide much resistance or support for any price change should prices enter it. At the weekly level, the tenkan-sen remains above the kijun-sen, and this should cushion any drop in prices. But, take note though that the kijun-sen is rising rapidly, and a negative crossover cannot be discounted. Should that happen, bearishness would be increased. Moreover, prices are still below both lines. In order for the bull to come alive, prices need to break above both the tenkan-sen and the kijun-sen followed by the upper cloud boundary, currently at 1249.25. We are at the cross-roads, and the coming week should provide some clarity.
Imo Gold price is bearish but appears bottomy at 1217+ and should bull higher to test 1241-51 range (about 50% retrace H 1295 / L 1205); ADX has dropped and an upturn in MacdMA suggests a rally for the week… Lets see how this plays out; don’t mind getting stomped out… GL to all!