The bounce has continued as the alternate hourly Elliott wave count expected.
Summary: There is very strong resistance close by at 1,236.50 which price may not be able to overcome. This is still expected to be a counter trend bounce that presents an opportunity to join the larger downwards trend. Very light volume today offers some support to this view.
If it continues a little higher, then expect this bounce to now end within the next 24 hours. The target at 1,242 – 1,247 may be too high
Profit target is now at 1,183 (measured rule) or 1,160 (Elliott wave).
Always use a stop and invest only 1-5% of equity on any one trade.
New updates to this analysis are in bold.
Last monthly charts and alternate weekly charts are here, video is here.
Grand SuperCycle analysis is here.
WEEKLY CHART
The Magee bear market trend line is added to the weekly charts. This cyan line is drawn from the all time high for Gold on the 6th of September, 2011, to the first major swing high within the following bear market on the 5th of October, 2012. This line should provide strong resistance.
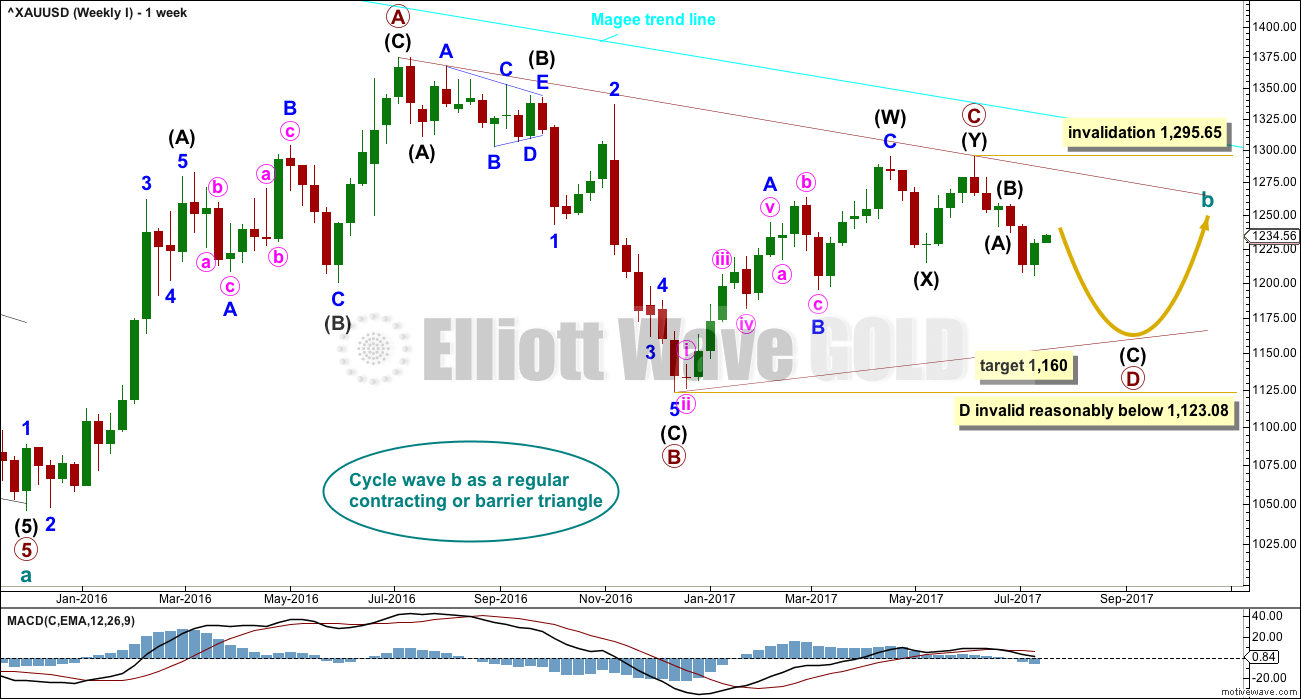
At this stage, a triangle still looks most likely and has the best fit for cycle wave b. It has some support from declining ATR and MACD now beginning to hover about zero.
Within a triangle, one sub-wave should be a more complicated multiple, which may be primary wave C.
Primary wave D of a contracting triangle may not move beyond the end of primary wave B below 1,123.08. Contracting triangles are the most common variety.
Primary wave D of a barrier triangle should end about the same level as primary wave B at 1,123.08, so that the B-D trend line remains essentially flat. This involves some subjectivity; price may move slightly below 1,123.08 and the triangle wave count may remain valid. This is the only Elliott wave rule which is not black and white.
Finally, primary wave E of a contracting or barrier triangle may not move beyond the end of primary wave C above 1,295.65. Primary wave E would most likely fall short of the A-C trend line. But if it does not end there, then it can slightly overshoot that trend line.
Primary wave A lasted 31 weeks, primary wave B lasted 23 weeks, and primary wave C may have been complete in 25 weeks.
Primary wave D should be expected to last at least 8 weeks (but most likely longer). The next Fibonacci ratio in the sequence would be a Fibonacci 13 and then 21.
There are three alternate wave counts that have been published in the last historic analysis, which is linked to above. They are all very bullish. They will only be published on a daily basis if price shows them to be true with a new high now above 1,295.65.
DAILY CHART
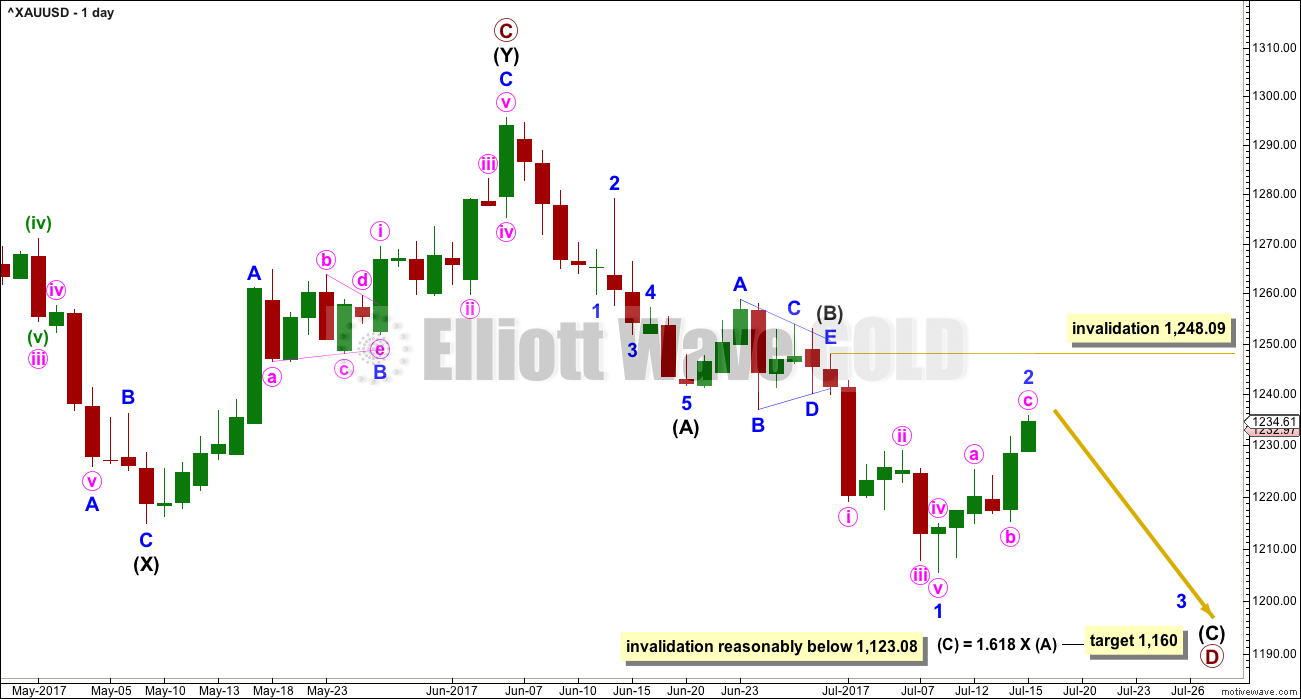
A common range for triangle sub-waves is from about 0.8 to 0.85 the prior sub-wave, this gives a range for primary wave D from 1,158 to 1,149. A Fibonacci ratio is used to calculate a target, which is just above this common range, for intermediate wave (C) now that intermediate waves (A) and (B) look to be complete. At this stage, to try and see the whole of primary wave D complete at Monday’s low does not look right. The B-D trend line would be too steep for a normal looking contracting Elliott wave triangle, and primary wave D would have been far too brief at only 5 weeks duration. For the wave count to have the right look and good proportions (as Gold almost always does), primary wave D should not be labelled over yet.
If primary wave C is correctly labelled as a double zigzag, then primary wave D must be a simple A-B-C structure and would most likely be a zigzag. With a triangle complete in the position labelled intermediate wave (B), the idea of a zigzag unfolding lower is strengthened. This may not be labelled a second wave as second waves do not subdivide as triangles. Triangles appear in positions of fourth waves, B waves, or within combinations.
Intermediate wave (A) lasted only ten days. Intermediate wave (B) has lasted eight days. As intermediate wave (C) is expected to be longer in length than intermediate wave (A), it may also be longer in duration and may last a Fibonacci thirteen days as the first expectation or a Fibonacci twenty one days as the next expectation. So far it has lasted only eleven days.
Intermediate wave (C) must subdivide as a five wave motive structure, either an impulse or an ending diagonal. An impulse is much more likely; so let us assume that is the more likely structure until proven otherwise, or until some overlapping suggests a diagonal may be possible.
Within intermediate wave (C), minor wave 2 may not move beyond the start of minor wave 1 above 1,248.09.
HOURLY CHART
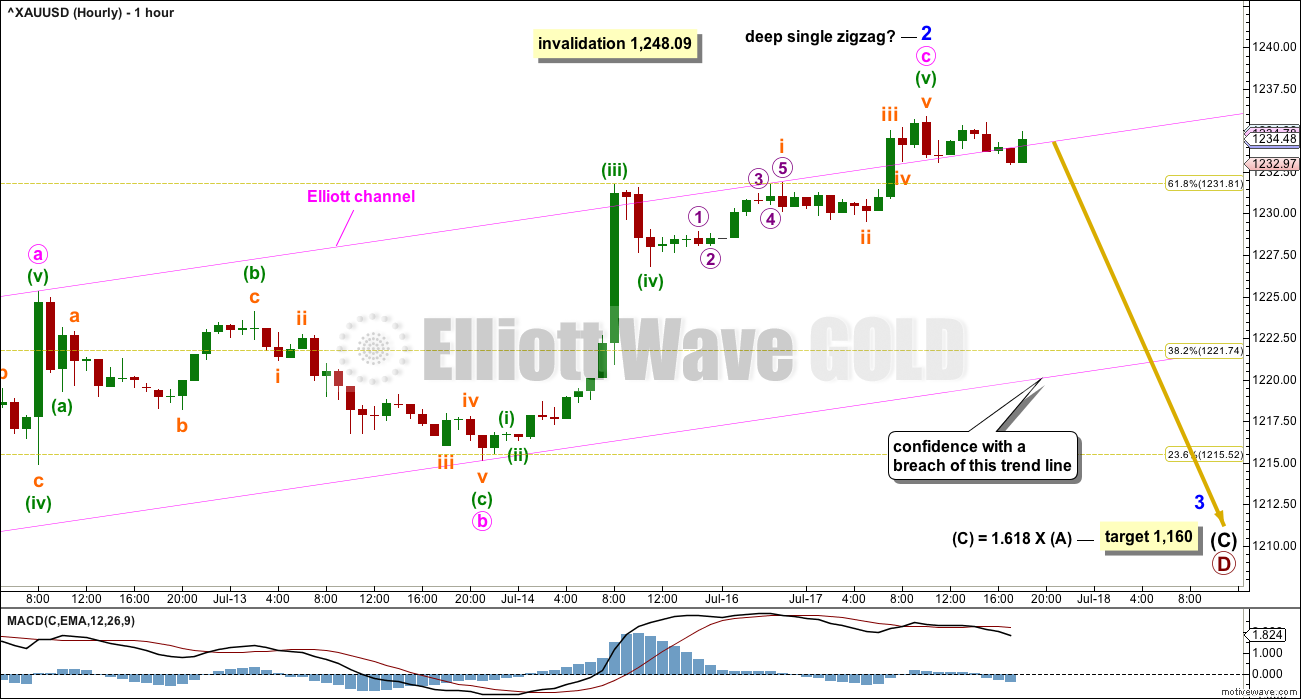
Minor wave 2 may still be a completed zigzag. Minute wave c is now just 0.82 longer than equality in length with minute wave a.
An Elliott channel is now drawn about minor wave 2. Draw this from its start to the end of minute wave b, then place a parallel copy on the end of minute wave a. When price breaks below the lower edge of this channel, it would provide confidence that minor wave 2 is over and minor wave 3 is underway.
MACD shows the middle of minute wave c labelled minuette wave (iii) is the strongest portion of upwards movement This wave count fits with MACD.
However, while price remains above the lower edge of the Elliott channel, it must be accepted that the alternate below may be right and price may yet move a little higher.
ALTERNATE HOURLY CHART
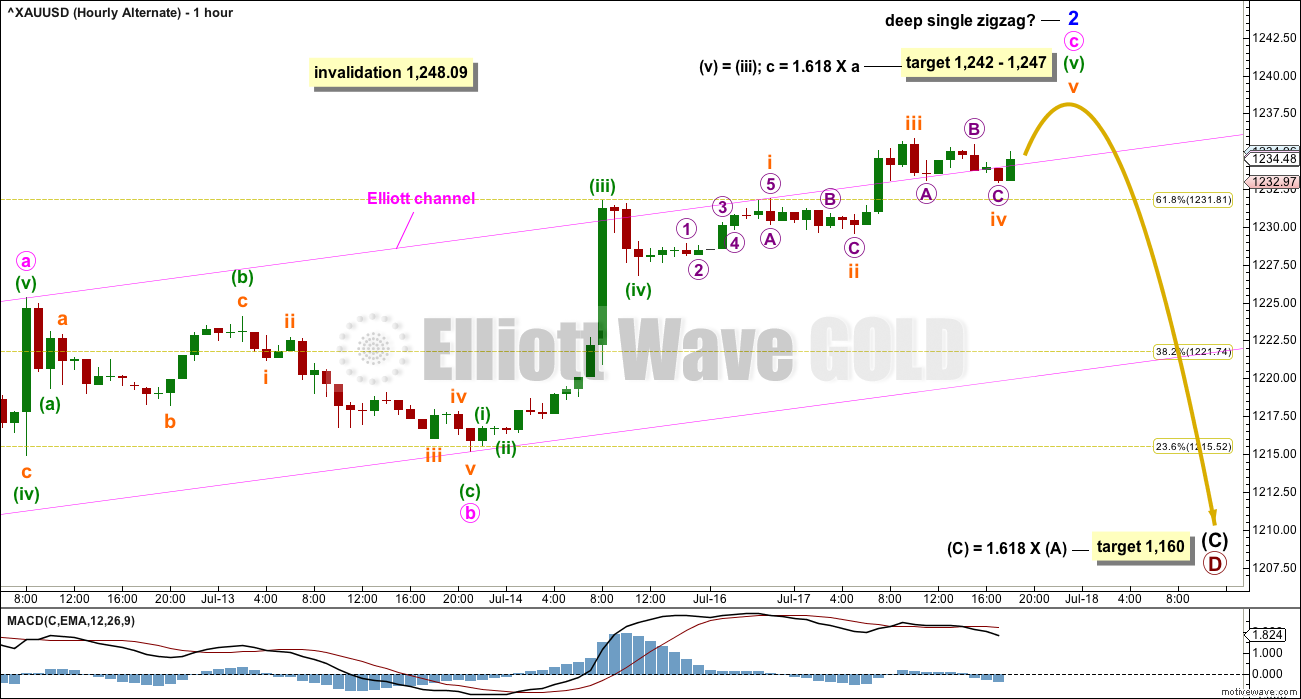
If minor wave 2 is continuing, then at this stage the best wave count would see it still as a single zigzag with minute wave c incomplete.
The next Fibonacci ratio to calculate a target for minor wave 2 to end produces a target that looks to be too high, so I do not have much confidence in this target. I have more confidence in resistance about 1,236.50. If minor wave 2 continues higher, it may be only by a little.
The target for minor wave 2 to end is now widened to a zone calculated at two wave degrees. Favour the lower edge of the zone (but that still may be too high).
TECHNICAL ANALYSIS
WEEKLY CHART
Click chart to enlarge. Chart courtesy of StockCharts.com.
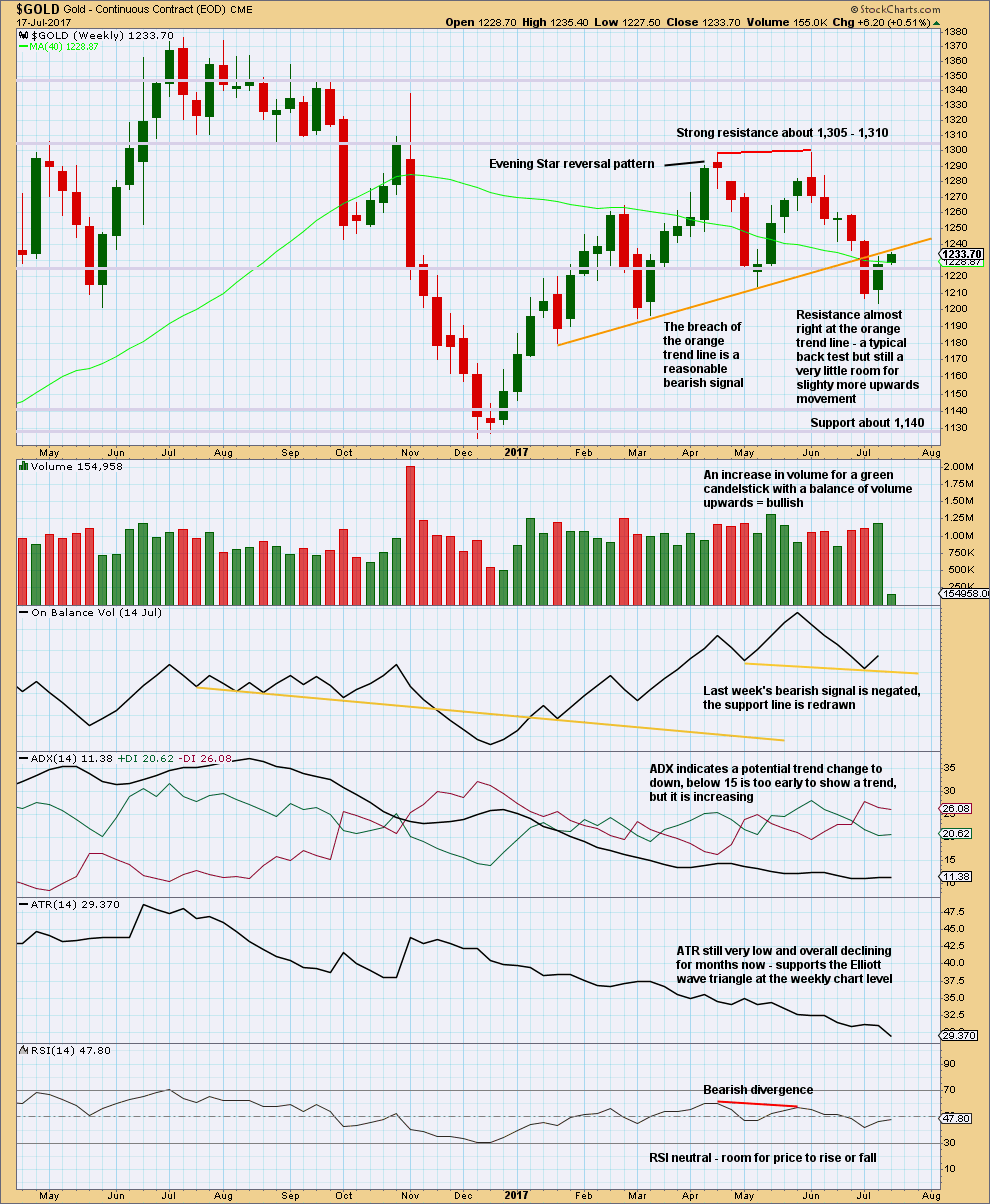
After a breach of the orange trend line, price is now typically curving up for a back test. What would be most typical to see now would be for price to move down and away. That does not always happen, but because it happens much more often then it offers support to the Elliott wave count.
This chart is updated today to show Monday’s movement.
Zooming in on this trend line it is still slightly above price, so there may still be a little room for the bounce to move higher. Resistance above is strong and now very close by. This bounce should now end within the next 24 hours.
DAILY CHART
Click chart to enlarge. Chart courtesy of StockCharts.com.
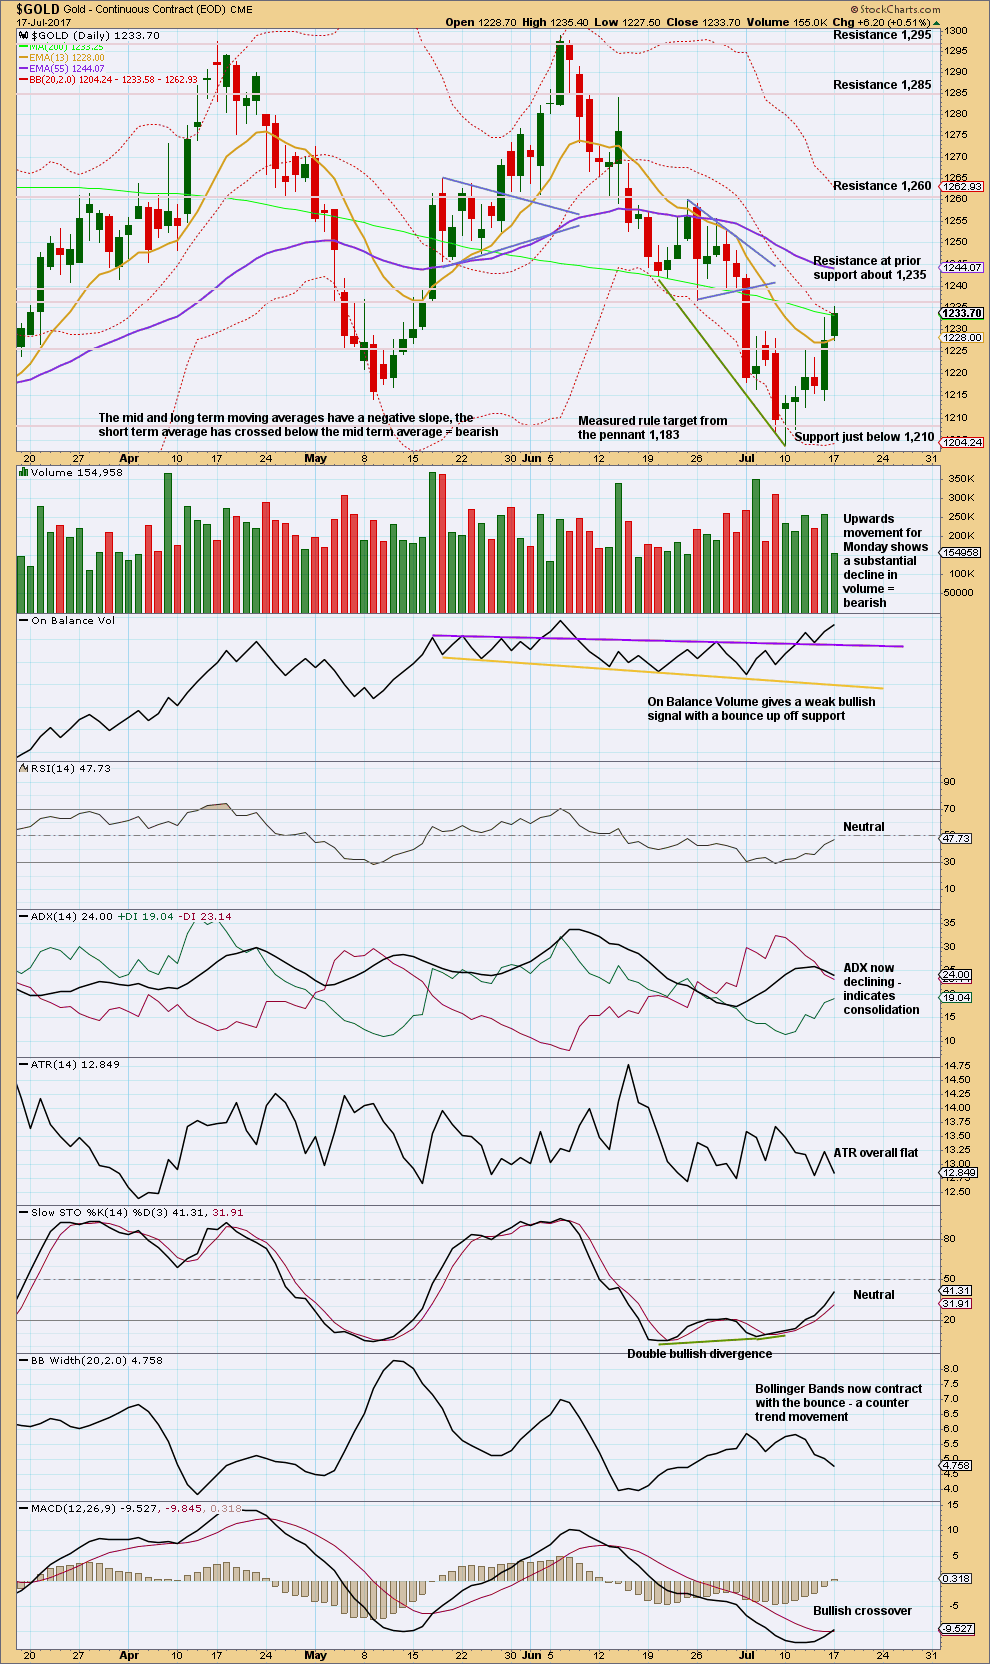
Volume today suggests the bounce is more likely now to be over.
Little weight is given to the bullish crossover on MACD. Only if price can break above resistance at 1,236.50 would that be given more weight.
GDX
DAILY CHART
Click chart to enlarge. Chart courtesy of StockCharts.com.
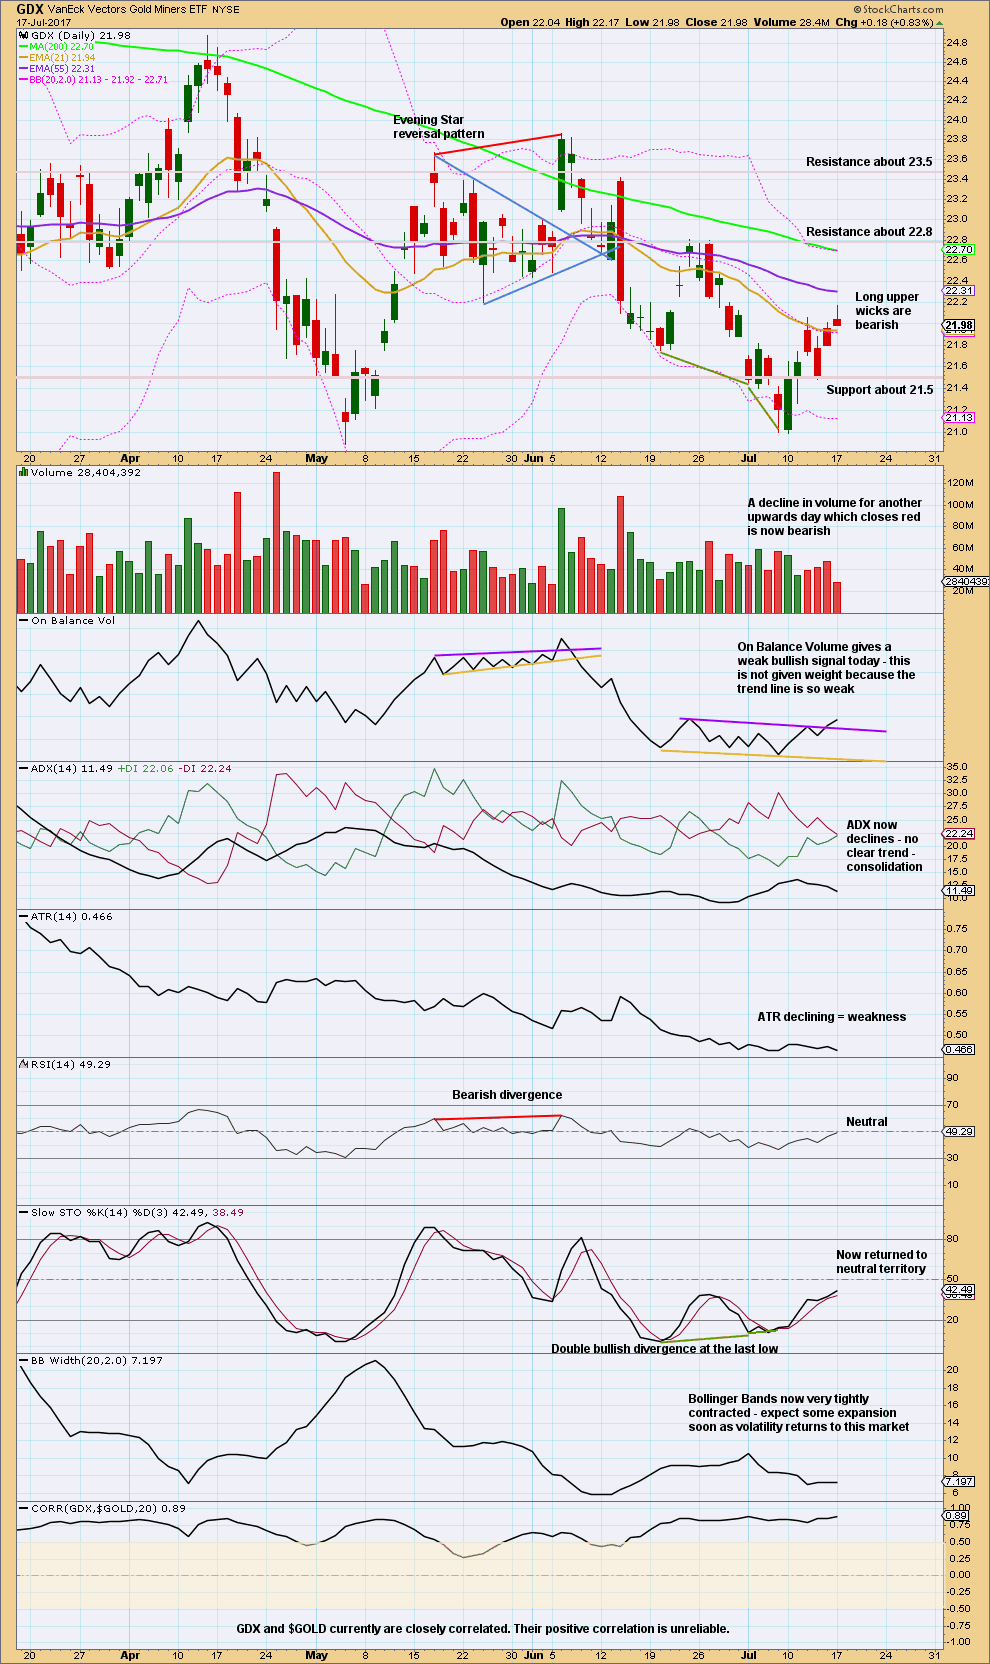
For GDX more weight is given today to candlestick colour and upper wicks than the weak bullish signal today from On Balance Volume. It looks again like the bounce may be over here for GDX, and this view has some support now from declining volume.
This analysis is published @ 07:27 p.m. EST.

Nothing has changed.
Lara’ $1242 -$1247 target for the alternate is alive and well. Bull case is very weak, imo.
Volume shows a reasonable increase today.
The trend line (gold) on the weekly chart (published in an extra post) is now well breached. Price is back above resistance.
This shifts the outlook short term from bearish to bullish.
I’ll be publishing one of the bullish alternates, in last historical analysis it was Weekly II, today. So that we have a road map to use if price breaks above 1,248.09.
Updated hourly chart:
Second waves can be deep. When they are they convince us price will continue in their direction, only to see a quick reversal and a strong move in the other direction when the third wave begins.
Let’s see again what volume is doing. If it is weaker than yesterday I shall jump in short with a stop just above the invalidation point. If it is stronger I’ll wait to see what happens.
Been selling longs on the way up, but now holding on to the last little bit for one more potentially big move up. If it doesn’t materialize, so be it. Was a nice trade. I’d be too scared to short here though. Does not feel toppy at all. Feels like it’s just eating away at resistance while shorts make a last stand to defend this level. Good luck to all either way!
~4 pts away from invalidation on the Alt.
Sure looks like this wants to jump the creek…
I must say the banksters have been a model of restraint of late!
They must be watching that trend-line to decide when to execute the familiar flush.
If it turns out to be a third wave down it should be a doozy! 🙂
I’m willing to bet more on the bearish case/Lara’s count at this time:
1. Dollar index oversold at RSI of near 27, lowest all year. We’re due for a bounce here or very soon.
2. Considering how high Glod and silver are up today, GDX and GDXJ are looking lethargic. I’d be more bullish if both were up more than 2%.
3. Long upper wick on the last 2 hour chart sides more towards a reversal coming shortly.
Just my humble opinion…
Logical, Nem leads up or down, is now slightly down.
Don’t know how that plays out with EW, or technically but my scenario fits with USD weakness and exhaustion of bears. Need bulls to be excited again to gather that upward momentum for another push down to 1180.
USD/JPY needs to reverse if gold is going to drop. I suspected we have an incomplete D wave. Gold will rise up to cyan trend line then fall back down to 1180 to complete D wave. Time will tell
Filled on my August GLD bear call credit spreads. Sold 115/120 for 2.78
I manage to complete my errands earlier today, and had some time to analyse gold prices. We are now at an interesting juncture. Prices can go higher, or it can go lower. If it goes lower, there is a backtest which will further provide room for decisions to be made. All in, this will not be smooth sailing from this point; clarity is only possible when the noise dies down.
=========================
Gold Daily Analysis
Data as at 5:30 am ET, July 18
=========================
Gold prices rallied on Monday, reaching as high as 1238.71 just after midnight. Prices had broken out of the purple downtrend resistance line. This line was drawn from the beginning of this drop at 1295.65 on June 6. In the case of the brown uptrend support line, prices had breached the line on the down day of July 3. It can be observed that prices have turned around and are backtesting this line. Currently, it is right smack at the brown line. Now, if prices can break above this line, then a bullish scenario becomes confirmed. But, it could be just a backtest and fails. In that eventuality, the bearish scenario becomes confirmed once the purple resistance line is breached. In between, it is just limbo. Further developments today can shed some light on this.
The Daily Ichimoku Chart shows that the cloud remains green. StockCharts didn’t show 26 days into the future, but on other platforms it can be discerned that the kumo remains green until the second week of August. In the short-term, the tenkan-sen is still below the kijun-sen, and both lie below the cloud, a bearish set-up. Meanwhile, gold has been trading above the tenkan-sen and is attempting to overcome the kijun-sen resistance. But first, it has to overcome the brown resistance line. We are at a critical stage: if price breaks above the brown resistance line, bulls would find renewed strength and prices could target the 1240 level followed by the bottom cloud boundary at 1250.38. A rejection here would first see a pullback towards the 1215 region for a backtest of the purple resistance line now turned support. Short-term support is at 1230, followed by 1215. Bulls do not want to see prices below 1215.
Gold prices continued the rally, reaching as high as 1242.27, at which minuette 5 is slightly larger than minuette 3. Prices had poked above the brown resistance line, so if the price rise remains unabated, then tomorrow’s candle will lie above the brown line, meaning an established bull. At 1242.27, price is only 33 cents short of the kijun-sen. So, next upward target, if prices continue to rise, will be the kijun-sen resistance.
Thanks for the updates Alan. Very much helpful to know what to look out for…
Thanks Ari.
Alan- Before declaring reversal in trend gold need to clear 1248. IMO.
The BO of trend line is an early warning for what to expect soon!
Rest assured, Papudi.
I have increased confidence in the bull but the bear is not going to take it lying down. My confirmation target for a fully entrenched bull market is much higher. Gold price has to clear the top boundary of the daily kumo, currently in the 1260 region, before I can declare the bear’s demise.
Gold price has already risen above the daily kijun-sen resistance. Next assault target is the bottom cloud boundary at 1255.23. If gold price is not going to fall decisively soon, with every step the bulls will become more and more invigorated. Who knows, I might have to drag out my bullish EW double zigzag scenario in which the recent low of 1205.41 on July 10 is THE low, and a multi-month bull market is in the making.
“Venezuela’s cushion of cash fell to its lowest point in over 20 years amid the nation’s political turmoil.
Foreign reserves — funds meant to weather tough economic times — fell below $10 billion for the first time since 1995, according to central bank data published Sunday. Venezuela, which has more oil than any other country in the world, was once the richest country in Latin America.
What’s more: Most of Venezuela’s foreign reserves aren’t even in hard cash. They’re mostly in gold bars, which change in value as the price of gold wavers in global markets. ”
I wonder if they will be able to avoid flooding the market with Gold in the coming months?
http://money.cnn.com/2017/07/17/news/economy/venezuela-reserves-20-year-low/index.html?iid=hp-toplead-dom
Not too long ago Chavez got its 200 ton back from West. Thats all she has.
More than that amount of gold sold every day on COMEX.
We are getting a preview of the destiny of most Western economies.
The smug retort I generally get of “It can’t happen here!” when I voice this opinion makes me all the more convinced. There is a deafening silence about what is happening in Puerto Rico and the impending Greek 20 plus billion (which they clearly cannot make) debt payment in the lame stream media.
As you indicated, hard to believe we are looking at what once used to be one of the wealthiest countries in the Western hemisphere, and still the repository of probably the world’s richest oil reserves.
I agree with Lara. I think the move up in GDX should be complete today. The move up is weak on low volume.
https://www.tradingview.com/x/nrsHAXuT/
Dreamer
Thank you for your thoughtful and supplementing uploads.
You’re welcome 😊
Lara, you might want to verify the accuracy of this on your charts. I see the 2001 low trendline coming in at approximately 1,185. Almost right on your target….
https://www.tradingview.com/x/jRIvY1ER/
I can’t quite replicate that trend line…
I used the late Dec 2016 low instead of the Dec 2015 low. I think there’s a little play in how such a long trendline is placed
Aha. Yes, if it’s drawn that way then there is a very little room for more downwards movement. Here it is zoomed in.
Or it could bounce up here, just above the line.