
Price has overcome resistance at 1,236.50. The target on the alternate Elliott wave count has been reached.
Summary: A break above resistance with some support from volume looks bullish. Stronger volume today suggests this upwards movement is not over. The target is now at 1,260.
An old very bullish wave count is published today; it has been in the historic analysis for a while. Classic technical analysis still offers more support to the first revised wave count than this more bullish second count.
Always use a stop. Invest only 1-5% of equity on any one trade.
New updates to this analysis are in bold.
Last monthly charts and alternate weekly charts are here, video is here.
Grand SuperCycle analysis is here.
FIRST ELLIOTT WAVE COUNT
WEEKLY CHART
Click chart to enlarge.
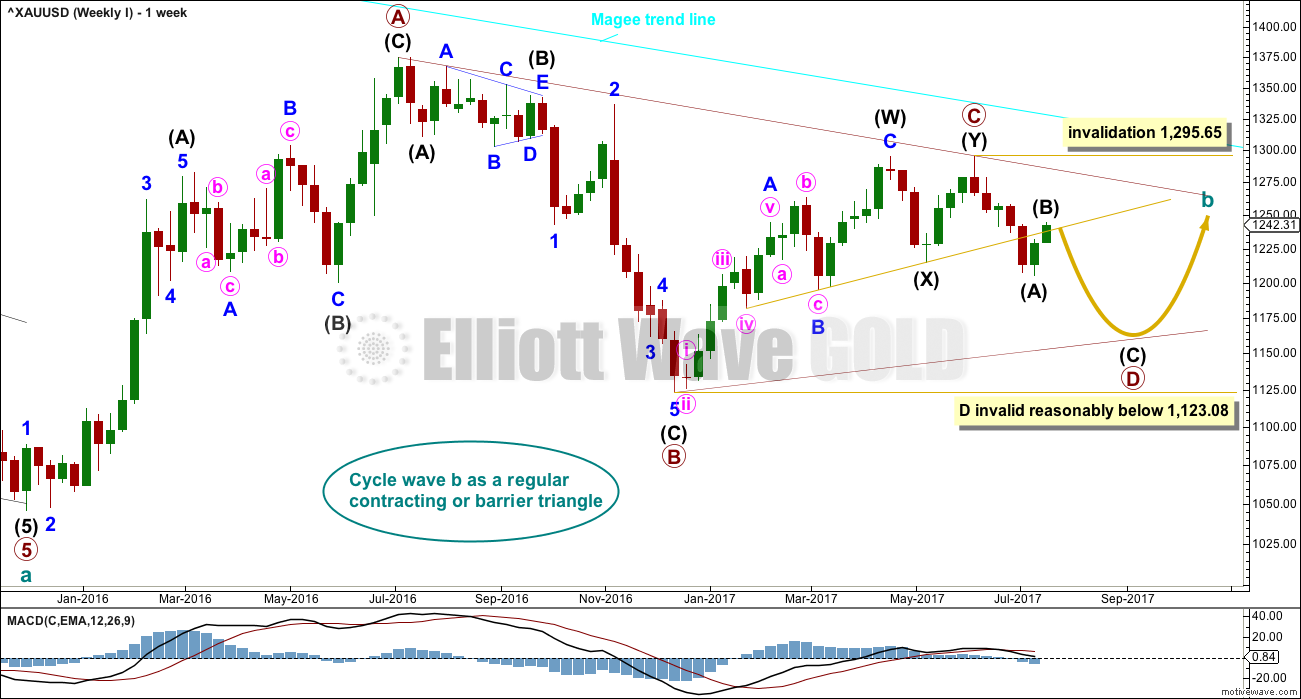
The Magee bear market trend line is added to the weekly charts. This cyan line is drawn from the all time high for Gold on the 6th of September, 2011, to the first major swing high within the following bear market on the 5th of October, 2012. This line should provide strong resistance.
A more recent support line (gold colour) has been added and today’s upwards movement has now broken above this line, so it has not provided resistance as was expected. This substantially reduces the probability of this first wave count to now about even with the second wave count.
At this stage, a triangle still looks possible and has the best fit for cycle wave b. It has some support from declining ATR and MACD now beginning to hover about zero.
Within a triangle, one sub-wave should be a more complicated multiple, which may be primary wave C.
Primary wave D of a contracting triangle may not move beyond the end of primary wave B below 1,123.08. Contracting triangles are the most common variety.
Primary wave D of a barrier triangle should end about the same level as primary wave B at 1,123.08, so that the B-D trend line remains essentially flat. This involves some subjectivity; price may move slightly below 1,123.08 and the triangle wave count may remain valid. This is the only Elliott wave rule which is not black and white.
Finally, primary wave E of a contracting or barrier triangle may not move beyond the end of primary wave C above 1,295.65. Primary wave E would most likely fall short of the A-C trend line. But if it does not end there, then it can slightly overshoot that trend line.
Primary wave A lasted 31 weeks, primary wave B lasted 23 weeks, and primary wave C may have been complete in 25 weeks.
Primary wave D should be expected to last at least 8 weeks (but most likely longer). The next Fibonacci ratio in the sequence would be a Fibonacci 13 and then 21.
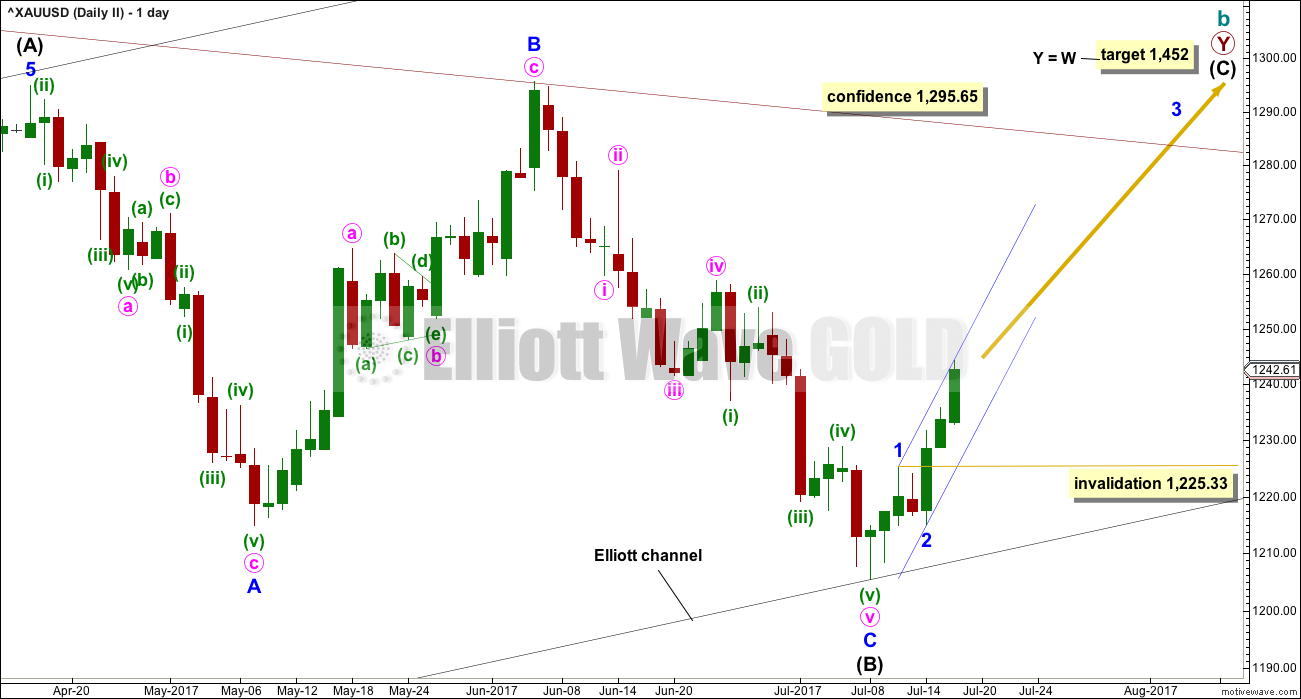
The structure within primary wave D is now relabelled. Current upwards movement is now seen as intermediate wave (B).
A breach of resistance with some support from volume indicates that one of the more bullish wave counts published in historic analysis may be correct. It will be published today to provide a road map should price continue higher.
DAILY CHART
Click chart to enlarge.
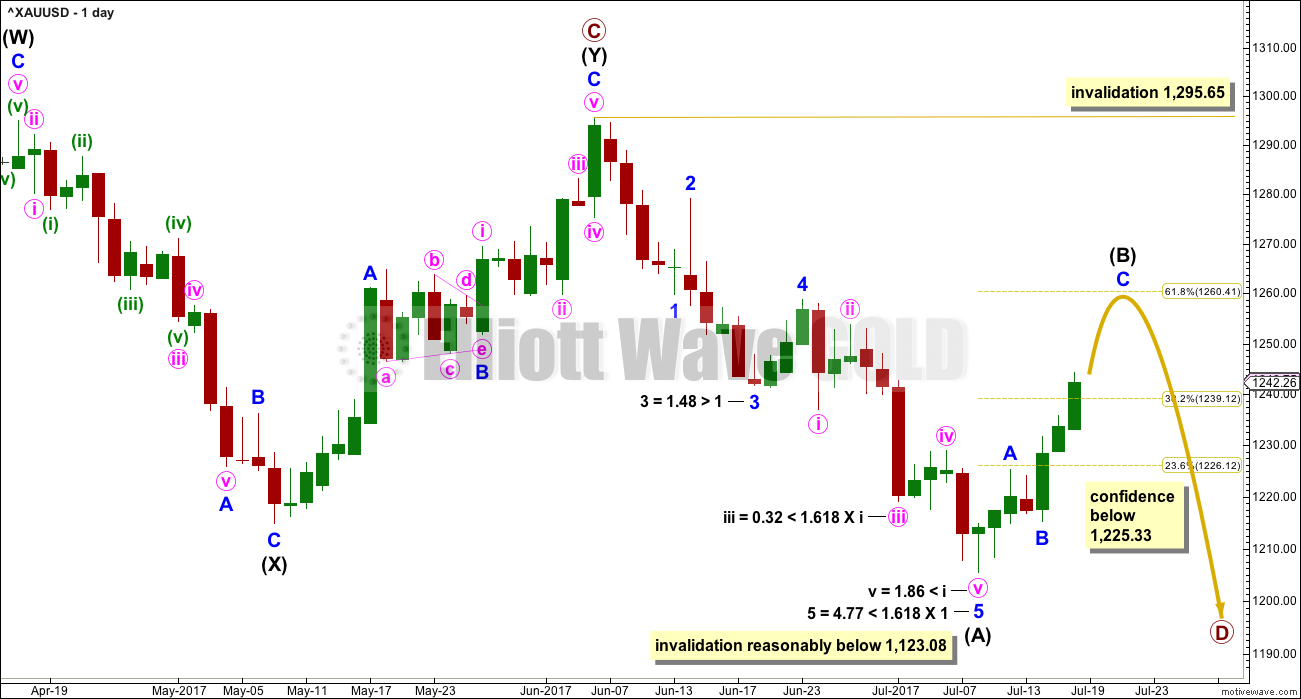
A common range for triangle sub-waves is from about 0.8 to 0.85 the prior sub-wave, this gives a range for primary wave D from 1,158 to 1,149. At this stage, to try and see the whole of primary wave D complete at Monday’s low does not look right. The B-D trend line would be too steep for a normal looking contracting Elliott wave triangle, and primary wave D would have been far too brief at only 5 weeks duration. For the wave count to have the right look and good proportions (as Gold almost always does), primary wave D should not be labelled over yet.
If primary wave C is correctly labelled as a double zigzag, then primary wave D must be a simple A-B-C structure and would most likely be a zigzag.
The structure of primary wave D is relabelled today. Current upwards movement would not fit within a channel about prior downwards movement, so this is now clearly a new wave and not a short term bounce. It is possible that only intermediate wave (A) was over at the last low and the current bounce is intermediate wave (B).
Unfortunately, this moves the invalidation point much higher to 1,295.65. But with current upwards movement lasting longer and now deeper than it was expected to be, this now has better proportion.
HOURLY CHART
Click chart to enlarge.
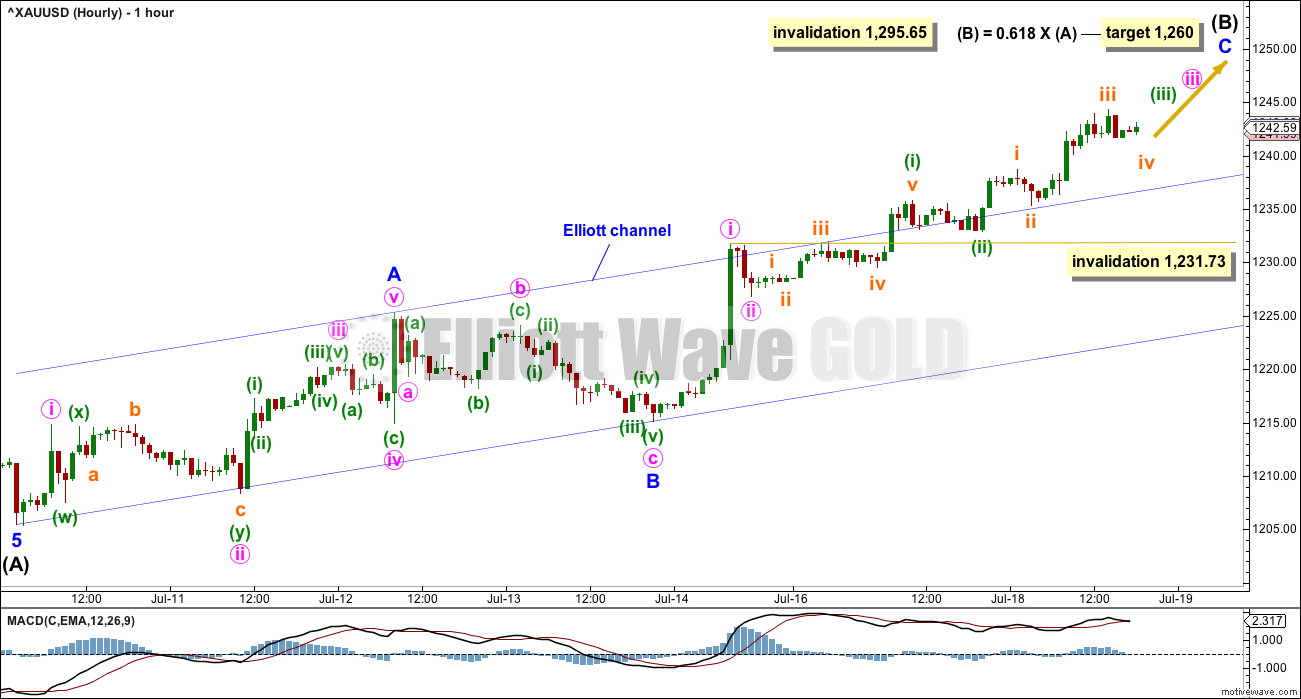
Upwards movement may be a zigzag for intermediate wave (B). Zigzags subdivide 5-3-5, exactly the same as the start of an impulse.
There is more than one way to label this upwards movement.
Now that intermediate wave (B) has moved reasonably above the 0.382 Fibonacci ratio, the next Fibonacci ratio in the sequence at 1,260 will be used.
Minor waves A and B look correct. The variation possible is most likely within minor wave C. Minor wave C must be a five wave structure.
Within minor wave C, minute waves i and ii may be complete. Minute wave iv, when it arrives, may not move into minute wave i price territory below 1,231.73.
This wave count now expects a few more days of upwards movement towards the target. The channel may then be redrawn as a best fit, probably to look more like the channel on the second hourly chart. When that channel is breached by downwards movement, it would offer a strong indication that upwards movement is over and the next wave down is then underway.
SECOND ELLIOTT WAVE COUNT
WEEKLY CHART
Click chart to enlarge.
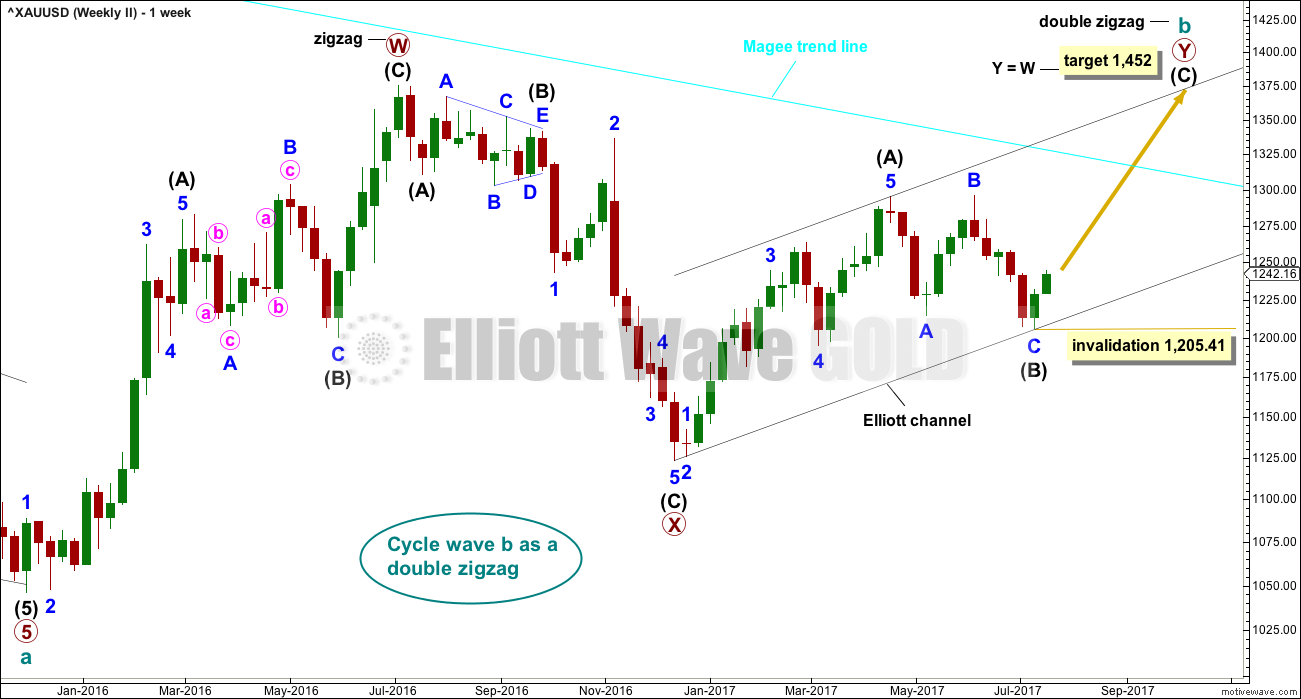
This wave count has been published only in historical analysis. Price shows us today this wave count may be correct, so it will be published on a daily basis.
There are more than 23 possible corrective structures that B waves may take, and although cycle wave b fits best at this stage as a triangle (first wave count), it may still be another structure. This wave count looks at the possibility that it may be a double zigzag.
If cycle wave b is a double zigzag, then current upwards movement may be part of the second zigzag in the double, labelled primary wave Y.
The biggest problem with this wave count is the structure of intermediate wave (A). This upwards wave looks very much like a three and not a five. This upwards wave must be seen as a five for this wave count to work.
Within the second zigzag of primary wave Y, intermediate wave (B) is a completed regular flat correction. Minor wave C ends just slightly below the end of minor wave A avoiding a truncation. There is no Fibonacci ratio between minor waves A and C.
The target remains the same as previously published for this wave count.
Along the way up, some resistance should be expected at the cyan Magee trend line.
Within intermediate wave (C), no second wave correction may move beyond the start of its first wave below 1,205.41.
It is my judgement today that this second wave count has only a slightly lower probability than the first wave count. This is why I have named them “first” and “second” rather than “main” and “alternate”.
DAILY CHART
Click chart to enlarge.
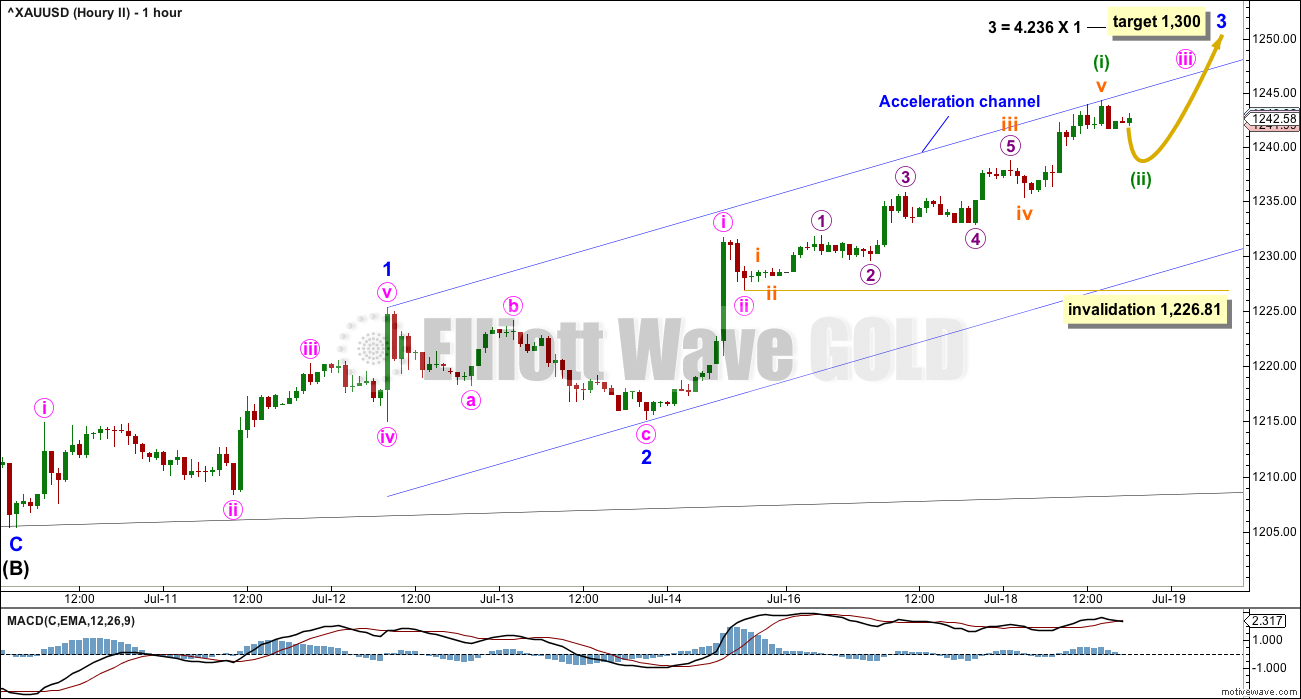
Intermediate wave (C) may be unfolding as an impulse. So far minor waves 1 and 2 may be complete. It is common for Gold to exhibit short first waves and very long extended third waves.
When minor wave 3 is complete, then minor wave 4 may not move down into minor wave 1 price territory below 1,225.33.
HOURLY CHART
Click chart to enlarge.
A-B-C of a zigzag subdivides 5-3-5. This is exactly the same as 1-2-3 of an impulse. Both wave counts at the hourly chart level may have the same subdivisions.
There is more than one way to label the subdivisions within this upwards movement. This second wave count will look at the possibility that the third wave is extending because that is extremely common.
The target for minor wave 3 is reasonable given that minor wave 1 was very short. This is not an uncommon Fibonacci ratio for Gold, and it fits with the higher target for minor wave 5 to end primary wave Y.
Minute wave iii may only subdivide as an impulse. So far only minuette wave (i) may be complete. Minuette wave (ii) may not move beyond the start of minuette wave (i) below 1,226.81.
If this second wave count is correct, then price should not break below the lower edge of the acceleration channel. If price does that, then the probability of this second wave count would substantially decrease in favour of the first wave count.
This second wave count will have a reasonable probability while price remains within the acceleration channel.
TECHNICAL ANALYSIS
WEEKLY CHART
Click chart to enlarge. Chart courtesy of StockCharts.com.
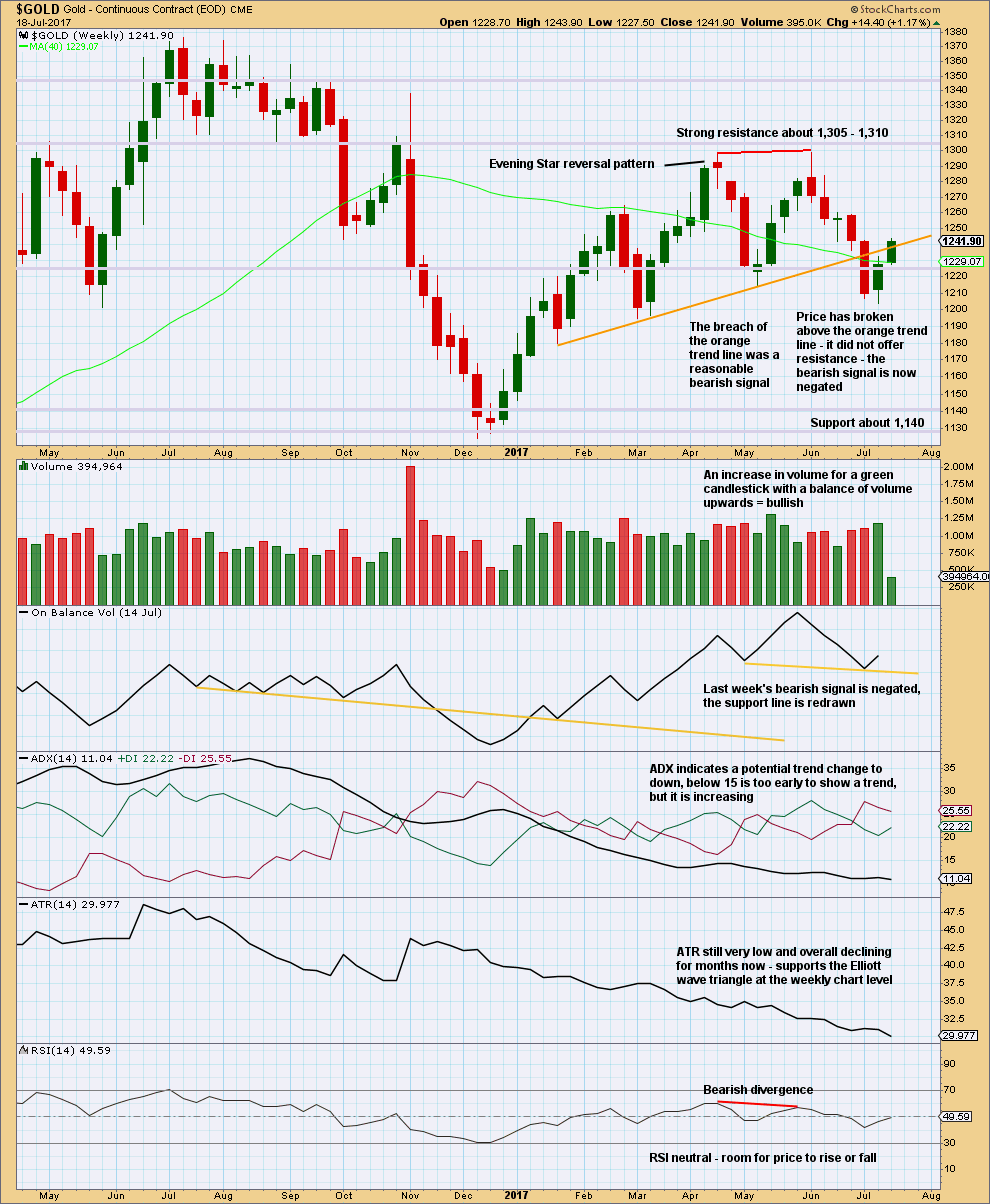
This chart is again updated today to now show the breached orange trend line. The prior bearish signal is negated, so the breach is a bullish signal. This supports the second Elliott wave count.
DAILY CHART
Click chart to enlarge. Chart courtesy of StockCharts.com.
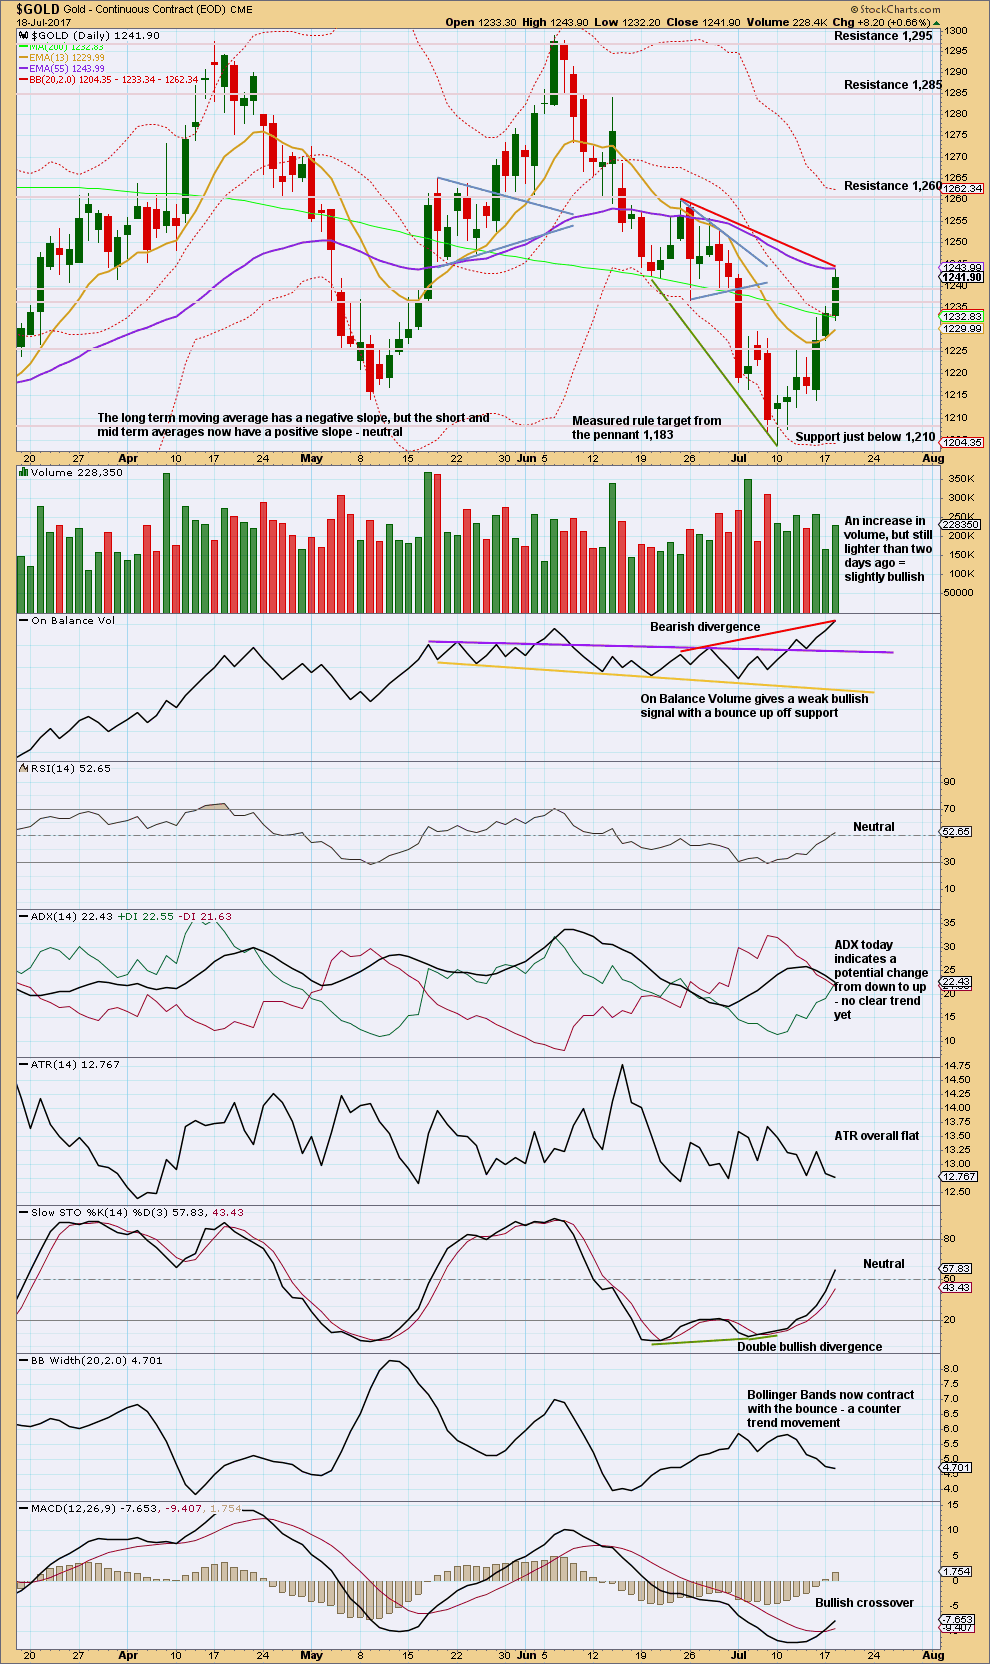
If the first wave count is correct, then current upwards movement is a B wave.
In support of the first wave count: bearish divergence with price and On Balance Volume, still relatively light volume, declining ATR, and contracting Bollinger Bands.
In support of the more bullish second wave count: MACD and the weak bullish signal from On Balance Volume breaking above a resistance line.
On balance, at this stage it is my judgement that the first wave count has more support than the second wave count. This would change if the volume profile becomes more bullish, ATR begins to increase, and Bollinger Bands widen with upwards movement.
GDX
DAILY CHART
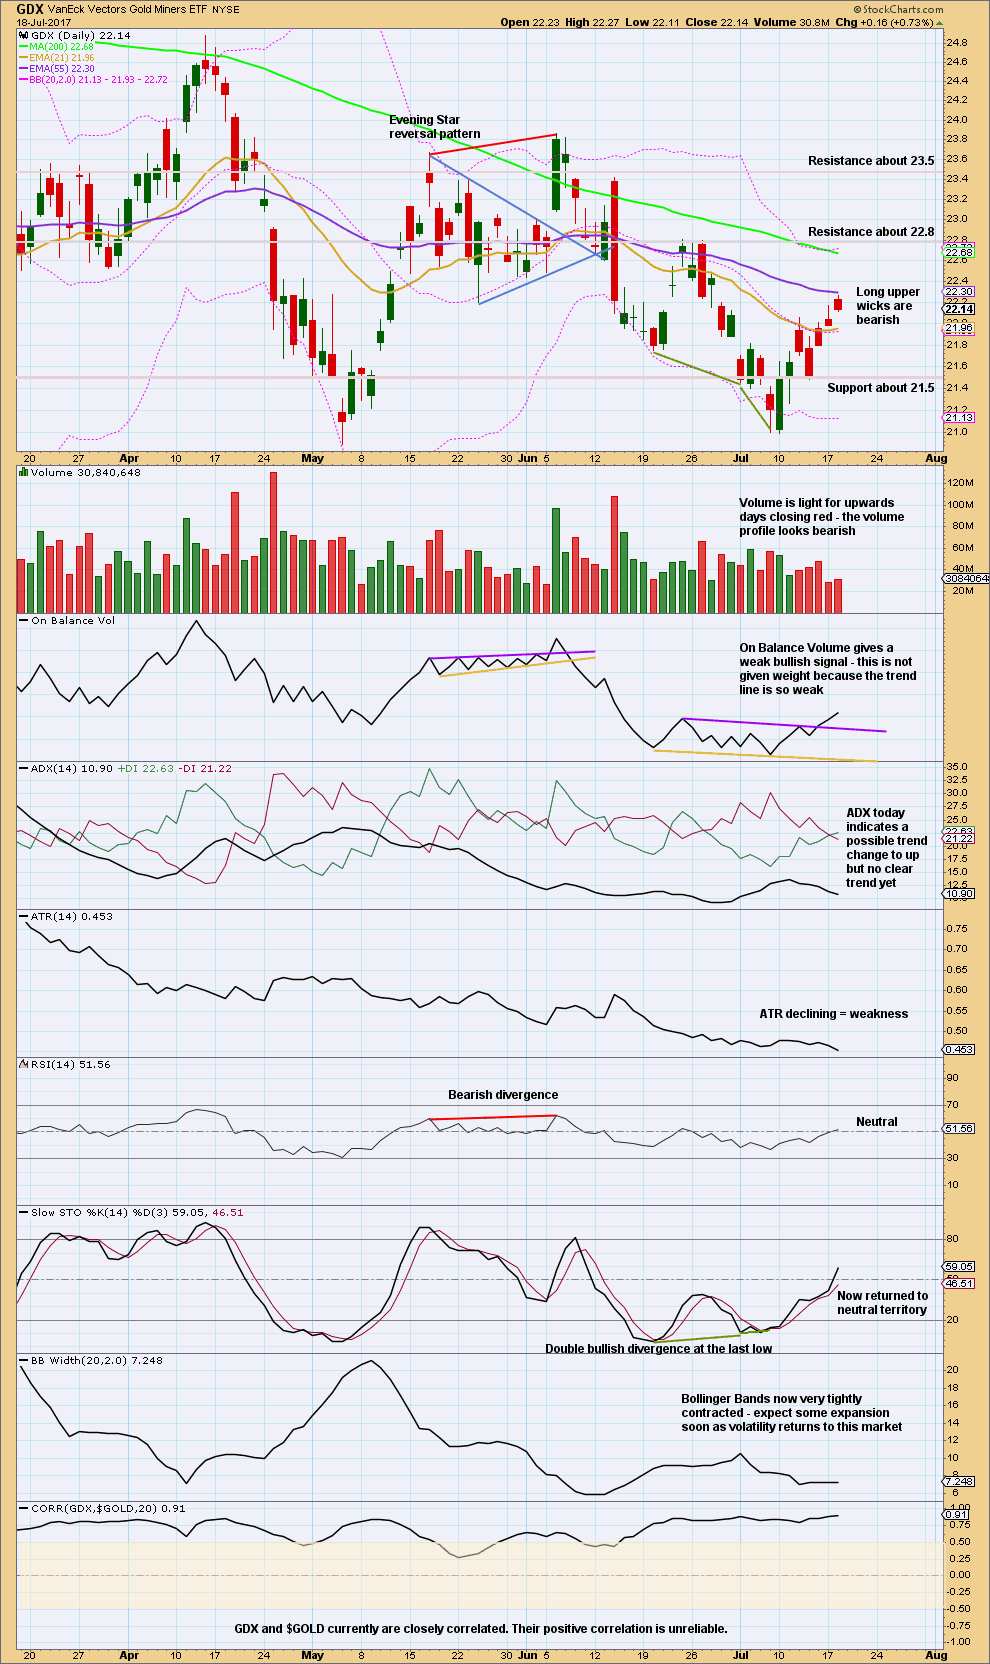
Click chart to enlarge. Chart courtesy of StockCharts.com.
Recently, GDX has led Gold. This may happen again here. If it does, then both should be bearish. The rise in GDX is looking weak so far because it lacks volume and range.
The last three candlestick patterns complete a Stalled pattern. This is a reversal pattern but not a strong one.
This analysis is published @ 08:10 p.m. EST.
Gold has a cute(?) habit of making a run at the 200 day sma during sideways movement or downtrends and even staying above it for a bit before going back to meandering or decline to complete its move. I suspect we are about to see a repeat performance.
😴😴 (please wake me up, when
gold does something) 😴😴
First hourly chart updated:
This inside day is completing a long legged doji. It may be minute iv.
If the target at
2,160*edit: 1,260 is wrong, it’s going to be too high.That does coincide with an area of prior strong resistance and support though, so it should offer resistance.
do you mean if target is wrong we will go over 1260 or we will stay below 1260?
Below
Ichimoku Gold Intraday Update
Data as at 9:50 am ET, July 19
==========================
Gold prices made a successful backtest of the brown resistance-turned-support trendline, dropping as low as 1236.39 before bouncing sharply from there. The daily candle straddles the trendline but did not punch through. If there are no further backtests, then prices are on the way up. The next resistance would be the bottom cloud boundary at 1255.23, followed by the top cloud boundary in the 1260s. The going today is likely to be a struggle. The daily tenkan-sen lies below the kijun-sen, a negative scenario, but the cloud is green. The bull is still trying to manifest itself as prices are trading above the tenkan-sen, and slightly above the kijun-sen.
Thank you Alan for updating regularly. Nothing more than a side ways chop today with 1236/35 barely holding. Imo the bulls may have had their day; gold price should be looking to top soon. Let’s see how we close today.
Thanks Lara for publishing the latest alternate bullish count. the reliable indicator of PM sector trend GSR is either backtesting BO or if dips below 75.5 will indicate which wave count is in play.
Watch the GSR. Also few PM related currencies ; Swiss Franc, Yen and $AUD are showing PM sector bullishness.
A weekly chart of Swiss Franc is included. It broke out three weeks ago after making a double bottom which defined the final gold bottom in 2015.
In 2015 Franc was freed from Euro ind in week it jumped higher. Gold followed and put in the 1307 high.
Thanks Lara.
Note it is a weekly chart. So the weekly candle is not complete just yet.
So the last couple of days I’ve missed the call on GDX expecting price to turn down. Price has continued up, albeit with weak gains on low volume. The market keeps throwing us curve balls.
At this point it’s still hard to say that a strong move up is starting. Zooming back out to the weekly level, price looks like a backtest of the orange triangle lines shown on this chart. I think it still makes sense for price to make a new low below 20.89 before a more sustained move up starts. The most recent low was only 20.99.
Looking for more clarity within the next couple of days.
https://www.tradingview.com/x/3nnOlkQx/
I agree Dreamer. My bearish call credit spreads so far are flying green flags.
That is one thing I like about trading spreads. It does not take long to find out if your wrong about the trade. They also give you the flexibility of pivoting when it turns out that you are. Besides, that all important and oh so predictable bankster flush has yet to make an appearance. Does anybody really think they are going to let the bulls sit comfortably on any significant trend change without shaking the trees? Come on guys…you know the drill…!!! 🙂 🙂 🙂
The chart shows the gold miners and AUD. My observation is that historically the gold miners and AUD tend to move in the same direction over the intermediate term. The Aussie Dollar has broken out fairly strongly breaching both the downtrend and horizontal resistance. Tshould this be a genuine breakout and this historical relationship continues.
Sorry this should have read this breakout is supportive of higher prices for gold and the miners should this be a genuine breakout and this historical relationship continues
Gold Daily Analysis
Data as at market close, July 18
===========================
Gold prices continued to rally on Tuesday. As at market close, prices had broken out of:
(a) the purple downtrend resistance trendline;
(b) the 200-day SMA at 1232.83; and
(c) the brown support-turned-resistance trendline.
Prices had also touched the kijun-sen.
The market has turned from bearish to weakly bullish, weakly bullish because prices are still trading below the cloud. If prices could rise further, it would test the 50-day SMA at 1247.88 followed by the bottom cloud boundary. If prices could rise above the top cloud boundary, gold would then become strongly bullish. The momentum of the upward movement ought to bring gold towards 1260, and following a brief pullback, proceed towards the 1300 region and possibly higher. The bulls may at last be vindicated, with 1205.41 as THE low for this leg of the race.
The price action to watch today is whether prices could pullback and backtest the brown now resistance-turned-support trendline. If prices do bounce off from there and rise higher, then confidence in the bullish trend sets in. But if prices plunge below the brown trendline then the bearish scenario reasserts itself and we would be on our way to visit the 1180 region once again.
The green kumo is invitational to the bulls, and so is the MACD histogram which is printing in the black with an upward trajectory, pointing to higher prices. On the cautionary side, the 5-day RSI has reached the overbought area. But I reckon that the deciding vote will be cast by the backtest of the brown trendline.
It seems way too early to be switching to bullish on gold. The high of 1,244 today, was right in the middle of the 1,242 – 1,247 target posted yesterday. Nothing has changed, imo
The first count is only short term bullish.
I do believe the main count is in play. From what I know about how the bankster cartel operates, we are not going to see a sustained bullish run higher until they flush out a few of the early birds…you can count on it! I will be adding to my short position with a move back below the breached trend-line. 🙂
I agree. There’s too much weakness in this upwards wave for it to look like solid start to a new trend.
And from an EW perspective, that second wave count has a big problem.