
Upwards movement continues as expected towards the target. A short term target is now provided.
Summary: The short term target is now at 1,264. About here another small consolidation to last about two days may unfold, to be followed by a final small upwards wave that still has its target to be calculated.
Classic technical analysis still offers more support for the main wave count than the alternate.
Always use a stop. Invest only 1-5% of equity on any one trade.
New updates to this analysis are in bold.
Last monthly charts and alternate weekly charts are here, video is here.
Grand SuperCycle analysis is here.
MAIN ELLIOTT WAVE COUNT
WEEKLY CHART
Click chart to enlarge.
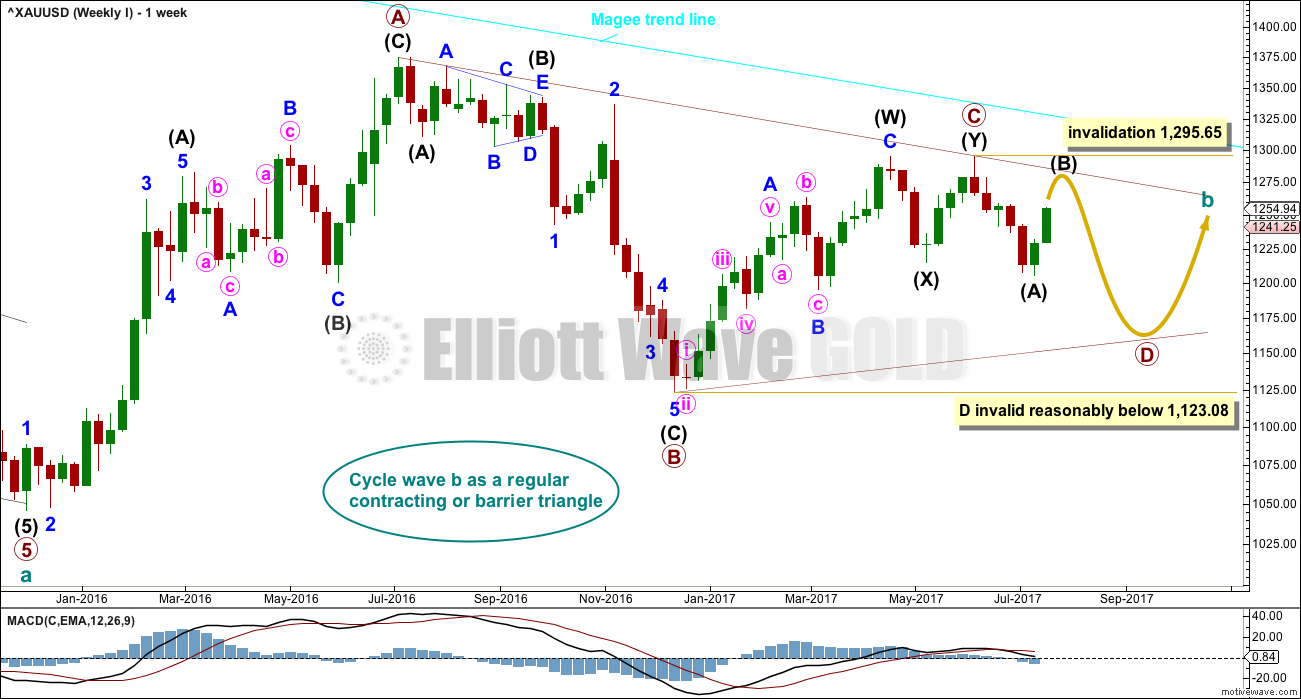
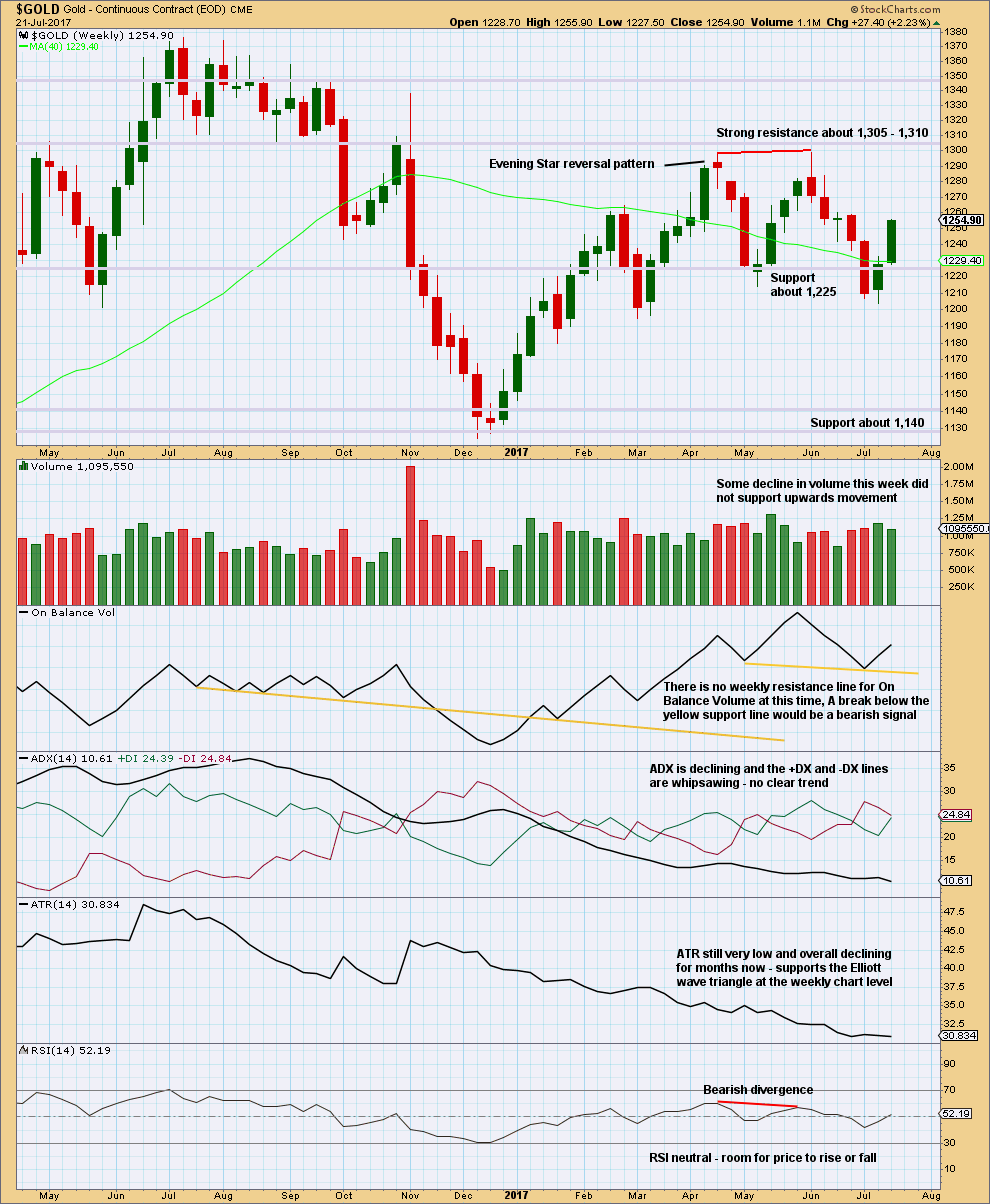
The Magee bear market trend line is added to the weekly charts. This cyan line is drawn from the all time high for Gold on the 6th of September, 2011, to the first major swing high within the following bear market on the 5th of October, 2012. This line should provide strong resistance.
At this stage, a triangle still looks possible and has the best fit for cycle wave b. It has some support from declining ATR and MACD now beginning to hover about zero.
Within a triangle, one sub-wave should be a more complicated multiple, which may be primary wave C. This is the most common sub-wave of the triangle to subdivide into a multiple.
Primary wave D of a contracting triangle may not move beyond the end of primary wave B below 1,123.08. Contracting triangles are the most common variety.
Primary wave D of a barrier triangle should end about the same level as primary wave B at 1,123.08, so that the B-D trend line remains essentially flat. This involves some subjectivity; price may move slightly below 1,123.08 and the triangle wave count may remain valid. This is the only Elliott wave rule which is not black and white.
Triangles normally adhere very well to their trend lines. So far the A-C trend line has been tested 11 times; this line has very strong technical significance. If this wave count is correct, then intermediate wave (B) should find very strong resistance if it gets up to the A-C trend line. A small overshoot is acceptable. A breach is not.
Finally, primary wave E of a contracting or barrier triangle may not move beyond the end of primary wave C above 1,295.65. Primary wave E would most likely fall short of the A-C trend line. But if it does not end there, then it can slightly overshoot that trend line.
Primary wave A lasted 31 weeks, primary wave B lasted 23 weeks, and primary wave C may have been complete in 25 weeks.
Primary wave D should now be expected to last a Fibonacci 13 or 21 weeks in total.
The gold trend line drawn on prior weekly charts has been removed at the end of this week. The trend line did not offer resistance and was weakened when price closed well above it.
DAILY CHART
Click chart to enlarge.
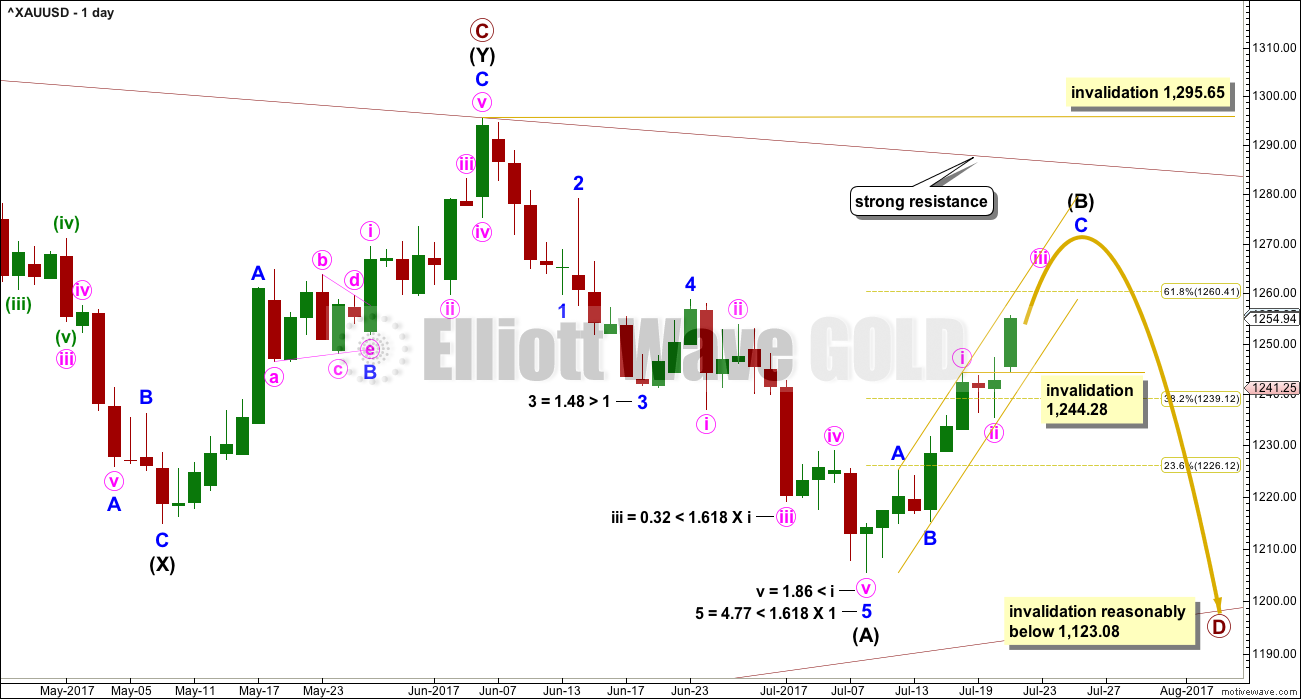
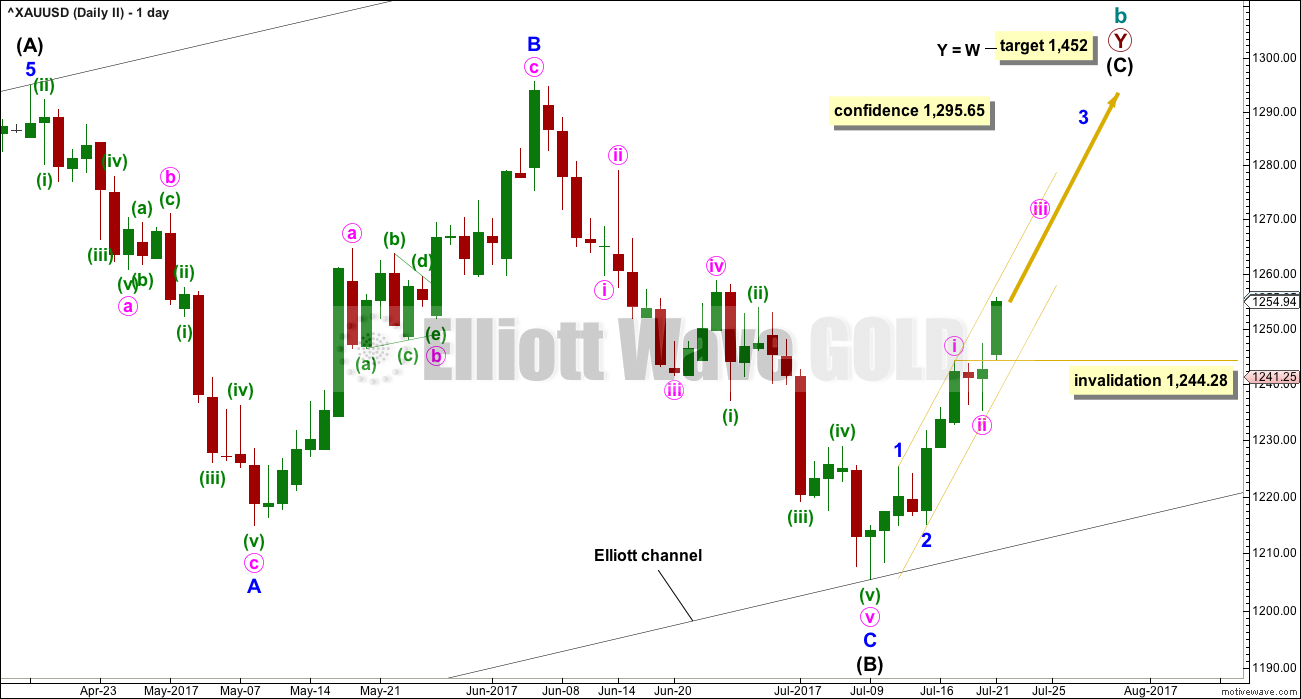
A common range for triangle sub-waves is from about 0.8 to 0.85 the prior sub-wave, this gives a range for primary wave D from 1,158 to 1,149. At this stage, to try and see the whole of primary wave D complete at this week’s low does not look right. The B-D trend line would be too steep for a normal looking contracting Elliott wave triangle, and primary wave D would have been far too brief at only 5 weeks duration. For the wave count to have the right look and good proportions (as Gold almost always does), primary wave D should not be labelled over yet.
If primary wave C is correctly labelled as a double zigzag, then primary wave D must be a simple A-B-C structure and would most likely be a zigzag.
It is possible that only intermediate wave (A) was over at the last low and the current bounce is intermediate wave (B).
Intermediate wave (B) looks to be unfolding as a zigzag, a three wave structure. Corrective waves have a count of 3, 7, 11, 15 etc. Each extension adds another 4. So far intermediate wave (B) has a count of 5 on the daily chart, and so a further 2 is required to total 7. The structure cannot be complete at this stage. This means that another small consolidation lasting about two days should unfold along the way upwards to end intermediate wave (B).
So far intermediate wave (B) has lasted 9 days and the structure is incomplete. The next Fibonacci number in the sequence is 13, which would see intermediate wave (B) end in a further four days.
Within the zigzag of primary wave D, intermediate wave (B) may not move beyond the start of intermediate wave (A) above 1,295.65.
While it is still possible that intermediate wave (B) may end close to the 0.618 Fibonacci ratio of intermediate wave (A) at 1,260, it now looks less likely. The target for minute wave iii calculated at the hourly chart level would see intermediate wave (B) end higher. When minute waves iii and iv are complete, then a new target will be calculated at minor and minute degree for the final high of intermediate wave (B).
HOURLY CHART
Click chart to enlarge.
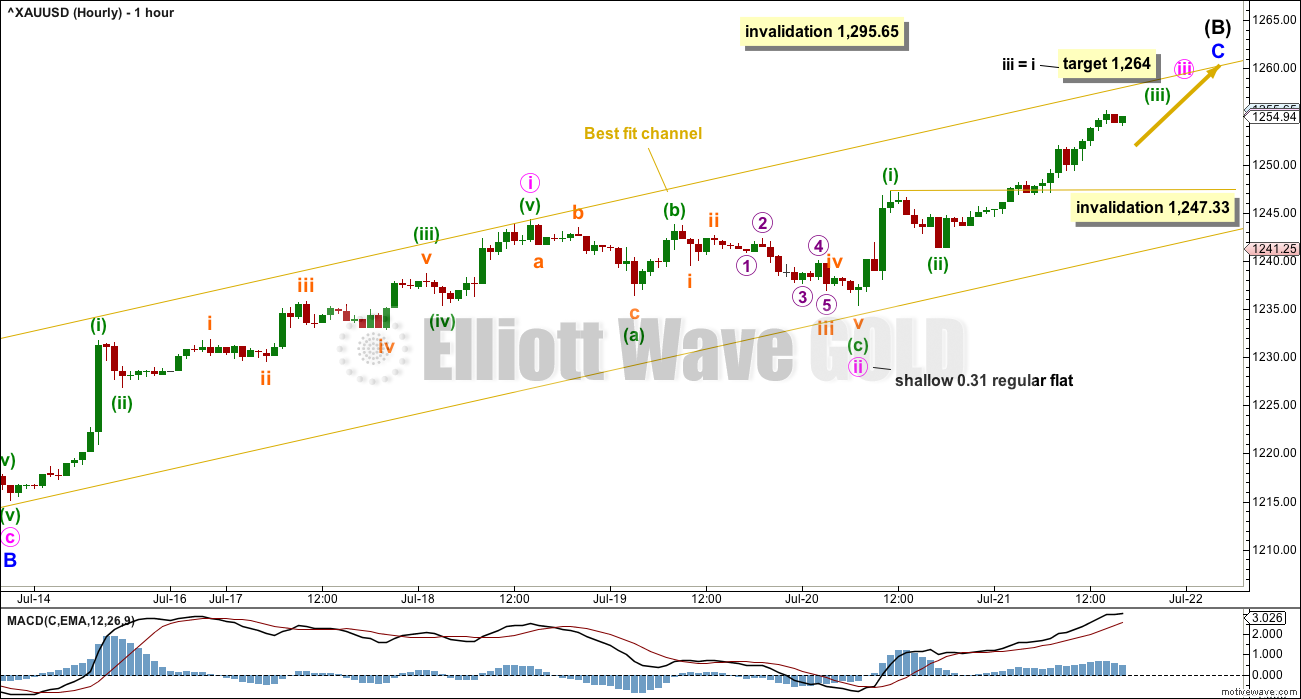
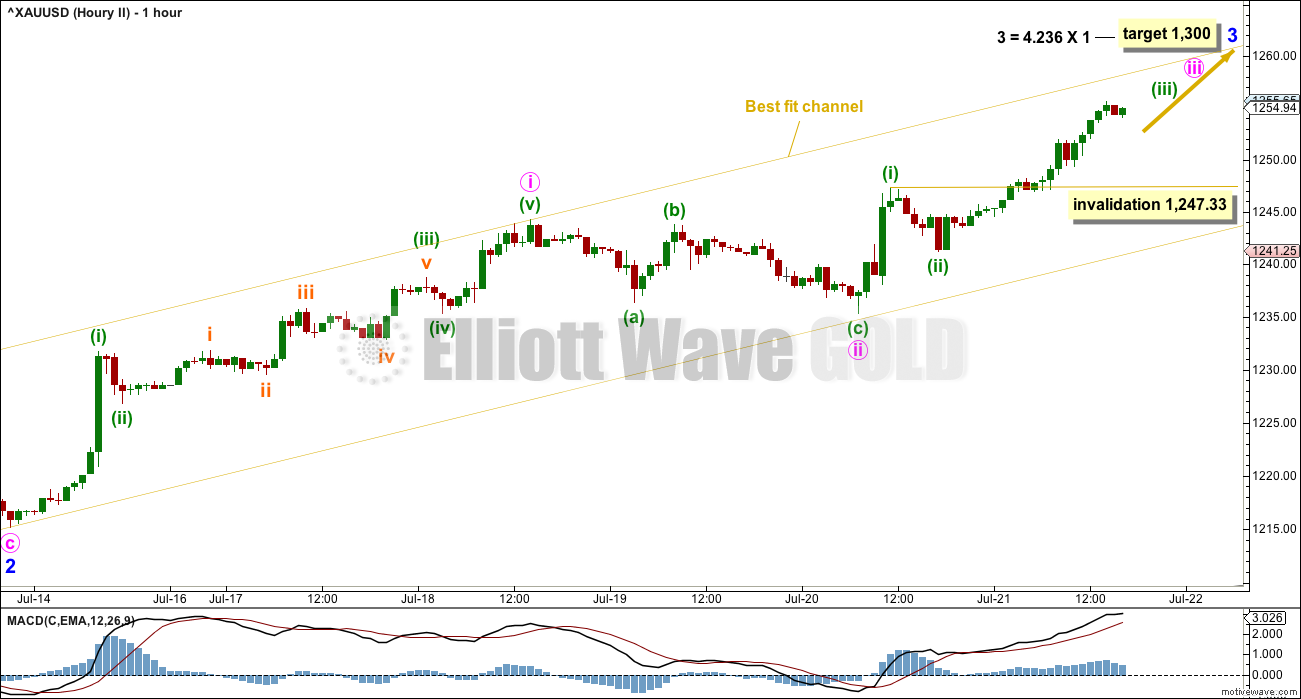
Upwards movement may be a zigzag for intermediate wave (B). Zigzags subdivide 5-3-5, exactly the same as the start of an impulse.
Minor waves A and B look correct. Minor wave C must be a five wave structure.
Upwards movement for Friday’s session shows an increase in momentum. The Elliott wave count fits with MACD: minute wave iii now has stronger momentum than minute wave i.
Minute wave iii may only subdivide as a simple impulse. Within minute wave iii, minuette wave (iv) may not move into minuette wave (i) price territory below 1,247.33.
Use the best fit channel as a guide to upwards movement and for trading. With price now expected to be nearing the end of a third wave, it may stay within the upper half of the channel. When price moves into the lower half of the channel, then minute wave iii may be over and minute wave iv may be underway. Minute wave iv may find support at the lower edge of the channel. That may provide another entry point to join the upwards trend.
If minute wave iii shows a further increase in upwards momentum, it may break above the upper edge of the channel. If that happens, then the channel may be redrawn.
If this wave count is invalidated by downwards movement below 1,247.33, then it may be possible that intermediate wave (B) could be over.
ALTERNATE ELLIOTT WAVE COUNT
WEEKLY CHART
Click chart to enlarge.
This wave count has been published only in historical analysis. At this stage, it will be published on a daily basis.
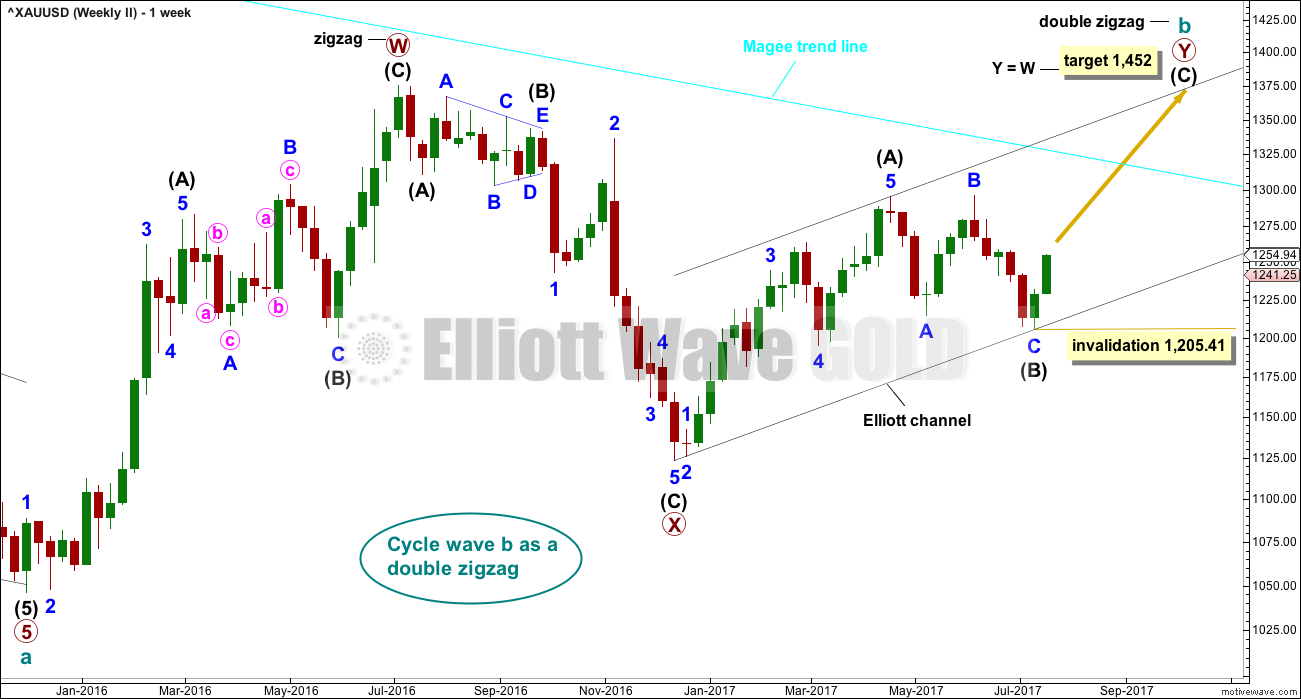
There are more than 23 possible corrective structures that B waves may take, and although cycle wave b fits best at this stage as a triangle (main wave count), it may still be another structure. This wave count looks at the possibility that it may be a double zigzag.
If cycle wave b is a double zigzag, then current upwards movement may be part of the second zigzag in the double, labelled primary wave Y.
The biggest problem with this wave count is the structure of intermediate wave (A). This upwards wave looks very much like a three and not a five. This upwards wave must be seen as a five for this wave count to work.
Within the second zigzag of primary wave Y, intermediate wave (B) is a completed regular flat correction. Minor wave C ends just slightly below the end of minor wave A avoiding a truncation. There is no Fibonacci ratio between minor waves A and C.
The target remains the same as previously published for this wave count.
Along the way up, some resistance should be expected at the cyan Magee trend line.
Within intermediate wave (C), no second wave correction may move beyond the start of its first wave below 1,205.41.
DAILY CHART
Click chart to enlarge.
Intermediate wave (C) may be unfolding as an impulse. So far minor waves 1 and 2 may be complete. It is common for Gold to exhibit short first waves and very long extended third waves.
When minor wave 3 is complete, then minor wave 4 may not move down into minor wave 1 price territory below 1,225.33.
HOURLY CHART
Click chart to enlarge.
A-B-C of a zigzag subdivides 5-3-5. This is exactly the same as 1-2-3 of an impulse. Both wave counts at the hourly chart level may have the same subdivisions.
The target for minor wave 3 is reasonable given that minor wave 1 was very short. This is not an uncommon Fibonacci ratio for Gold, and it fits with the higher target for minor wave 5 to end primary wave Y.
Minor wave 3 may only subdivide as an impulse. So far only minor waves 1 and 2 may be complete. This wave count now expects to see a further increase in upwards momentum as a third wave at two degrees moves higher. This should also have strong support from volume.
If this wave count is correct, then either or both of minute wave iii and minor wave 3 may end with blow off tops.
Minuette wave (iv) may not move into minuette wave (i) price territory below 1,247.33.
TECHNICAL ANALYSIS
WEEKLY CHART
Click chart to enlarge. Chart courtesy of StockCharts.com.
A lack of support for upwards movement from volume favours the main Elliott wave count.
ADX and ATR favour the main Elliott wave count.
DAILY CHART
Click chart to enlarge. Chart courtesy of StockCharts.com.
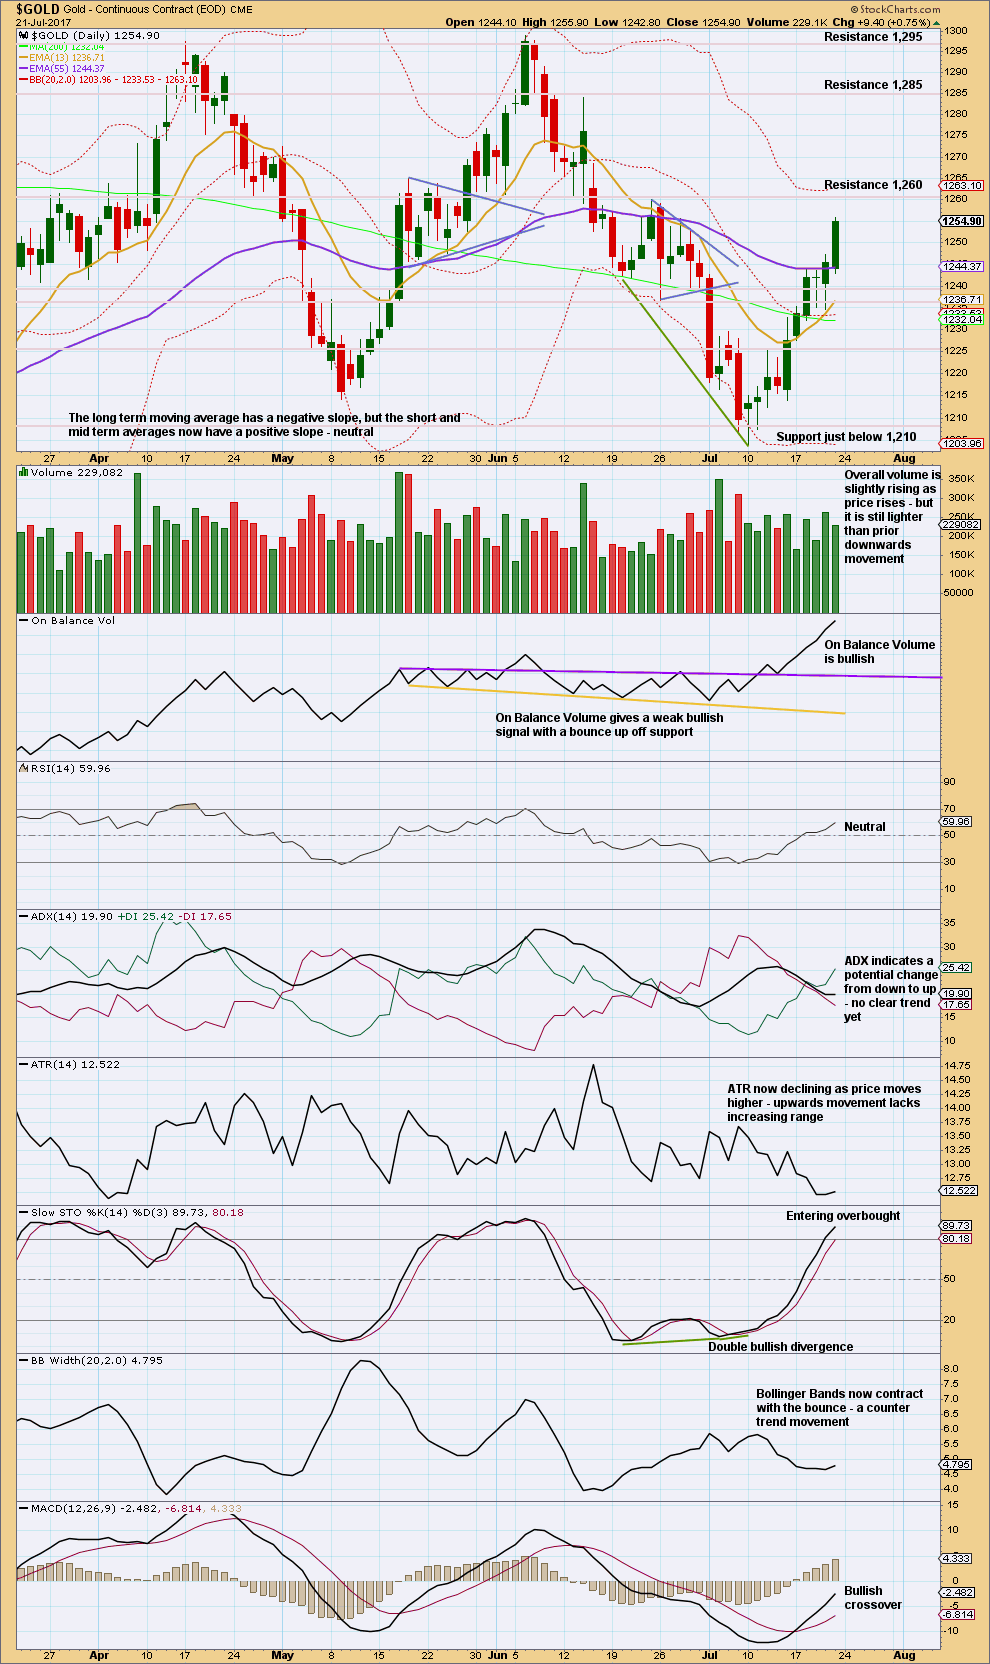
In last published analysis volume data provided by StockCharts for the 20th of July was clearly lower than volume four sessions prior for the 14th of July, but today this volume data has been changed: the 20th of July is slightly stronger than the 14th of July.
Volume is slightly bullish. On Balance Volume is looking very bullish. Divergence is still present, but will no longer be given weight at this time as it is not being followed by any downwards movement. On Balance Volume does work better with trend lines than it does with divergence.
If price reaches resistance about 1,260, and Stochastics is overbought at the same time, look out for a downwards reaction there.
Upwards movement may be over when Stochastics is overbought then exhibits divergence with price, or RSI is overbought and price is at resistance at the same time. For now that is not the case, so expect upwards movement to continue.
GDX
DAILY CHART
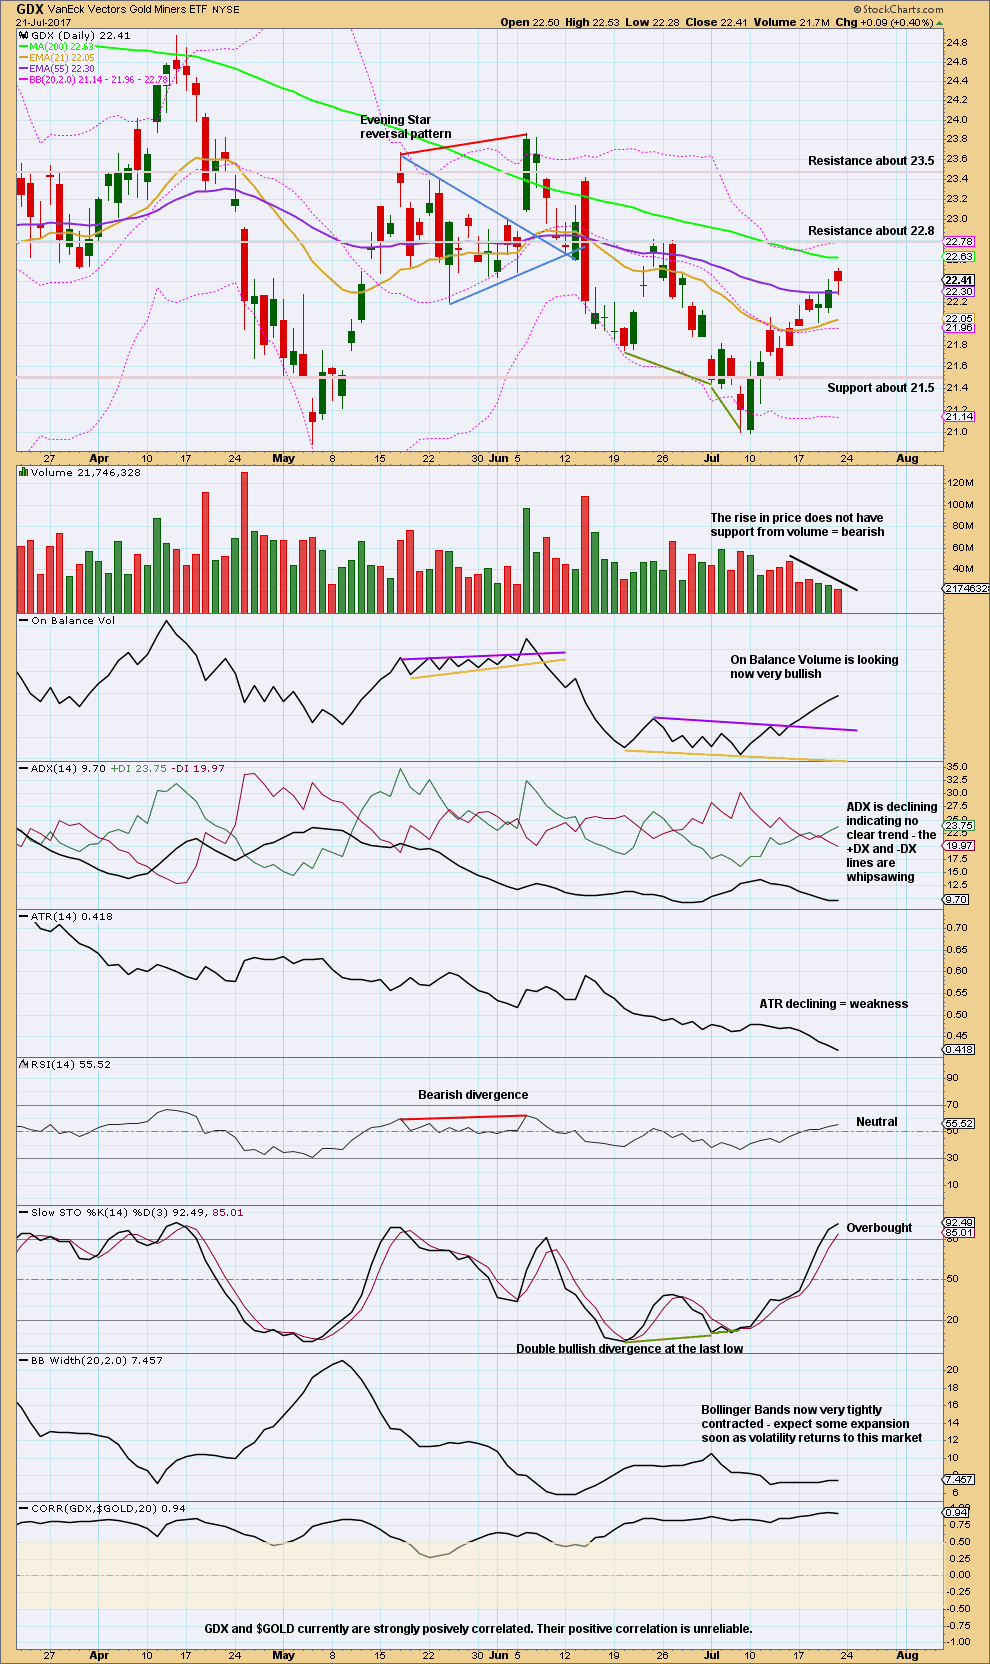
Click chart to enlarge. Chart courtesy of StockCharts.com.
The rise for GDX is still looking more clearly weak than the rise for Gold. If Stochastics fully enters overbought and price reaches resistance at the same time, it would be reasonable to expect an end to upwards movement then. That is not the case yet, so expect upwards movement to continue.
Published @ 02:08 a.m. EST on 22nd July, 2017.
Jimmy Rogers is never at a loss for words and is very opinionated. I happen to enjoy his opinion. He has traveled the world a few times and written some books that I liked. Investment biker is the name of one. Here is a short interview with him…..bullish on the dollar. Perhaps we have a wipeout of the markets and everyone goes to cash? Bullish on gold long term, short term not so much.
http://www.kitco.com/news/video/show/Kitco-News/1652/2017-07-24/Jim-Rogers-Has-a-Forecast-And-Its-Ugly
Before I read comments below and answer questions, here’s an updated hourly chart.
If minute iii is over it is shorter than minute i. This will limit minute v to no longer than = minute iii so that minute iii isn’t the shortest.
If price breaks down into the lower half of the best fit channel I’d have more confidence that minute iv is underway. It may be relatively quick as a zigzag.
If there were ever a time during this rally to sell and initiate shorts, it would have been during the last hour or so. short term charts looking like topping action, USD trying to bottom. Gold stocks taking the kind of beating we haven’t seen for a bit, and stock market holding steady, with seemingly no interesting news coming out of Washington with senate hearings and all. If this holds and traps the shorts initiated here, it might be a tell that it’s going lots lots higher
True, Gold price is encountering resistance 1254-56; imo with a stop at 1259, time to go short for a break below 1245-44 for a pullback to play out……
Dollar oversold…….time to bounce
Yep! Action in the dollar is one reason I have kept my short Gold position. It is at the bottom of a pretty long falling wedge and we saw a classic over-shoot of the lower boundary of the wedge. I think we are going to see a lively rally soon. Of course they both rally at times so it’s not a sure bet but I think we seeing a counter-trend move in Gold. The short leg of my spread has hardly blinked on this move up.
Gold stocks not really going up much compared to previous rallies and as I’m sure you noted today they got hit pretty hard, perhaps gold will follow down and the dollar will rally. Maybe the health care bill goes thru and or yellen talks up the dollar a bit. The commercials left there positions early on the dollar….a few weeks back they covered their shorts. Don’t know the significance of this since I don’t follow them much but they are posted on goldseek.com every Friday at 3:30 pm for those interested. Also as I’ve noted before the gold stocks have no volume on this up move. Usually you would see heavy volume out of the gate of a big move up, not 50 to 75 percent of the avg 90 day volume.
I love this site. With Alan and Dreamer providing analysis, it’s a win, win, win. I look to Alan and Dreamer’s analysis as a second opinion providing support or caution to Lara’s work. And, as it is Lara’s site, her willingness to allow diverse opinions makes this possible.
Thanks all.
Yeah, I think it’s pretty awesome too 🙂
Thanks Davey
👍
I am keeping a sharp eye on what GLD does with respect to its 200 day SMA. We should head back down to either test, or slice right through it on the way to completing the correction. I am still holding slightly under water bearish call credit spreads going into August. A bounce lasting more than a day or two means it is time to get long and strong the yellow metal! 🙂
Ichimoku Gold Intraday Update
Data as at 5:20 am ET, July 24
===========================
At the Friday close last week, gold prices had stopped just below the daily bottom cloud boundary. Today, prices made a mild pullback to 1252.13 before heading north again. As at the time of writing, prices had broken into the cloud at the daily level.
The 4-Hour Ichimoku Chart shows that gold prices are constrained within a bullish channel (orangish-golden lines). Since the tenkan-sen lies above the kijun-sen, and both lines lie above the kumo, and also that prices are trading above both lines, gold looks determined to move higher. However, bulls would need to be cautious as the 1260 area is very strong short-term resistance, and a pullback is justified and highly probable. As long as prices remain within the channel the short-term trend is still bullish. It is only when the channel is breached to the downside that a trend change may be deemed to occur.
As mentioned in the Weekly Analysis, a downward movement would first test the May 9 low of 1241.81, and if successful, move on to the brown resistance-turned-support trendline near 1235. I would think one of these two price points is the target of the pullback. If so, this price movement will be a backtest of support, and if the test fails, gold price would start to rally. Of course, if the test of support is successful, then the 1205.41 low would be next. Should prices drop below 1205.41 on a daily closing basis, then the round-number psychological support of 1200 would be targeted, as well as the 1183-1193 region. Let’s see how this plays out.
Just an aside. The non-American way of writing dates is day first followed by month. So today’s date is written as 24/7. It means that, only today, we can safely say to our spouse, boyfriend, girlfriend, or significant other, “I love you 24/7”.
Alan, thanks for your frequent updates. It’s very much appreciated. Not only that, but your analysis is of top quality.
Thanks John. Your comments are greatly appreciated.
Awesome Alan. Interesting how your cloud analysis so often aligns with my EW and TA. 1,260 is indeed strong resistance.
And darn it, I’m living in the future down here in NZ (it’s Tuesday morning, 25th). So I can’t tell Cesar today I love him 24/7 🙂 🙂 🙂 Will probably do it anyway
Let’s not forget we have a FED meeting this week. A statement will be released Wednesday @ 2pm EST.
No press conference is scheduled, so doubtful there will be a change in interest rates. That said, a dovish or hawkish stance in the statement can be a market mover…
Maybe that’ll be wave 1 down of wave C. First waves can be really strong.
Oh Yes! Look for Yammerin’ Yelling to initiate her dovish dance.
I am starting to think that when they finally announce a retraction of further rate hikes, and possibly even additional Q.E. if we get a big enough scare on the next market correction, it could have the exact opposite effect ultimately. I suppose there will be an initial knee-jerk reaction but what about when folk start to actually think about what it all really means??!! 😀
(I really shouldn’t be laughing as it is not all funny)
For the hourly GDX count it looks like a 4th wave triangle may be forming. If so, the final 5th wave up may be short and may not hit my green target zone. Looking for the move up to complete in 2-3 days.
https://www.tradingview.com/x/6sZB71SQ/
No change at the weekly level for the GDX count I shared a week ago. It still looks on track.
Notice how low the volume was last week.
https://www.tradingview.com/x/WUoM7kPV/
And volume overall is declining. That’s so typical of a triangle when it comes to an end. That and MACD hovering about zero.
FROM Stockchart Decision Point blog:
=====================
GOLD sated July 21 2017
IT Trend Model: Neutral as of 6/29/2017
LT Trend Model: BUY as of 4/12/2017
Gold managed to breakout above the rising bottoms trendline drawn from the January bottom. Since breaking above it, price has managed to stay above it. I’m happy to see a new PMO BUY signal and the positive angle on the OBV. I’d feel more confident in my bullish stance on Gold if the SCTR would improve. At this point I’d like to see $1300 hit again for a decisive breakout above long-term declining tops line resistance (green).
https://stockcharts.com/articles/decisionpoint/2017/07/dp-alert-spy-closes-on-all-time-high—utilities-etfs-ittm-buy-signals—pmo-buy-signal-on-gold.html
SILVER Weekly Ichimoku Analysis
Data as at market close of July 21
============================
Mirroring gold, the silver market rallied during the week, reaching the 16.50 level. That is an area that should continue to offer resistance, and if silver prices could break above there, the market should continue to the 17 level and above. Given enough time, the 18 and 20 levels would not be out of the question.
It is possible that we get a short-term pullback from the 16.50 level, but I think it would only be a matter of time before buyers jump back into the market. Silver markets seem to be quite well supported at the 16 region, so traders will look at pullbacks as opportunities to buy at value.
If prices do drop below the 16 region for whatever reason, then I would consider selling only below the 15 level, and quite frankly that does not look likely to happen anytime soon. The massive selloff that we had a couple of weeks ago has almost been completely reclaimed as of Friday. You might notice that I have used round numbers in this analysis. It’s not intentional; it is a peculiar characteristic of the silver market. I notice that silver seems to be technically divided by $0.50 levels, and so there could be buying or selling opportunities in those increments.
From an Ichimoku perspective, silver remains bearish. Prices are trading below the kumo, which is red. The positive crossover of the tenkan-sen above the kijun-sen on Thursday, together with increasing momentum from a rising MACD, had boosted prices. Moving on, prices have yet to break above the 50-day SMA at 16.66, and the 200-day SMA at 17.18, so there’s plenty of work to be done before a bullish scenario can emerge. An overbought 5-day RSI does not help. It does appear that we would soon be entering a consolidation zone until the bulls and the bears could slug it out.
Alan
Question for you??
Which line is:
Kumo
tenkan-sen
kijun-sen
Is it possible to type in the price level for a while I adjust to grasp these imp lines?
Then there are MA 50 and 200 lines also.
Thanks.
Papudi,
Kumo means cloud (now a red cloud at top of chart).
Tenkan-Sen – lower blue line (15.87)
Kijun-Sen – lower red line (15.70)
(prices on right side of chart)
50 & 200 MA lines are also blue & red, but are higher up @ 16.66 & 17.18
Thanks John. It is clear now as cloud.
Thanks John.
Papudi. Look at the Stockcharts legend. THe Ichimoku line reads, from left to right: tenkan-sen, kijun-sen, chikou span (which is hardly used), senkou span A (which is the top cloud boundary if the cloud is green, bottom if the cloud is red), and senkou span B (which has the opposite definition as span A).
50-day and 200-day SMA are defined in the legend.
US Oil Weekly Ichimoku Analysis
Data as at market close of July 21
============================
The WTI crude oil market initially rallied during the week, but ran into resistance at 47.74 on Thursday, right at the bottom cloud boundary. It then turned around and formed a shooting star. The shooting star is a negative sign, and it looks like the oil price is likely to continue to find bearish pressure, with the market almost on the verge of rolling over. In particular, a follow through of Friday’s price drop would target 44.90, kijun-sen support. It then ought to bounce from there and make another retest of the cloud as the tenkan-sen remains above the kijun-sen. The rebound is underpinned by the positive albeit declining MACD. I believe that the market is going to continue to find bearish pressure longer-term, and then it will be all but impossible to buy this market from a longer-term perspective. Every time it tries to rally, sellers would step in to drive prices lower. After all, the oversupply of crude oil is a well-known fact, and OPEC has lost the ability to control the market. Although the US dollar is falling, crude oil markets will continue to do so as well.
From a fundamental perspective, the downside momentum created by Friday’s sell-off could continue early this week due to further squaring of positions ahead of a key meeting between OPEC and non-OPEC members in St Petersburg, Russia, on Monday. Bullish traders are hoping that the oil-producing countries could reach some conclusion regarding compliance of agreed production cuts and to bring down inventory levels. Already, OPEC faces increasing uncertainty after cartel member Ecuador said it will start to increase production again due to revenue reasons. Saudi Arabia had floated the idea of reducing their exports, but not production. Oil ministers may try to bring Libya and Nigeria into the framework of the oil production deal. It is yet to be seen if the other oil-producing countries are agreeable to this. Even if a short-term accord happens, I believe any form of arrangement would be short-lived as OPEC consists of a rag-tag group with their own national agenda. If the meeting ends without a major announcement about further production cuts, prices would begin to tumble. Buyers are already getting tired of the status quo and would like to see a further commitment from the OPEC and Non-OPEC producers in their efforts to trim the supply glut.
Thanks for the analysis Alan, much appreciated. One question, when you say it will bounce and make a retest of the cloud – what price level are you expecting this bounce to target?
At the moment, the lower cloud boundary is around 47.00 so I’ll use that as the target for now. But first it has to negotiate the 50-day SMA at 46.61. So, I will be monitoring these two levels once the OPEC / non-OPEC meeting gets underway.
Thanks Alan
Thanks Alan. All of your analysis makes a great compliments to Lara’s analysis… I always look forward to your updates
Wonderful. Thank you very much Alan for sharing your work here.
I’ll be doing my weekly update of Oil today, I will copy your chart and comment to below that after publication too, so that it’s super easy for everyone to keep track of.
Big move in gold coming. Swiss Franc has broken out from a down trendline on weekly chart and has bullish candlestick chart pattern above the TL. Again BO from a recent upward channel with white (green) candle. An impulse move from here may target the gap above.
Last time XSF moved higher was in 2015 January and gold moved swiftly high to place a top 1305.
There are many indicators have effect on price of gold. One of them is currency/s.
Some major currencies: Yen, AUD and Euro are moving against USD.
GOLD to USD chart is targeting 15 which relates to gold price 1400.
Looking at the ratio chart GOLD/USD I make a few observations.
1. It has been in a long term downtrend for 6 years
2. There was a significant divergence in price between December 2015 and December 2016. A higher high for the USD and a higher low for gold. I have been expecting this down trend would be broken
3. It seems to have broken out from the downtrend this week. If it is a genuine breakout it could have a way to run yet
4.Short term, It appears to still be in a solid uptrend
All major currencies are strengthening against US dollar. That is good for gold.
Noticing the same thing. Of the same opinion.
Hello Lara,
I have a general question.
Can a triangle be B wave in a flat correction?
Yes. So long as the end of wave E of the triangle effects a 0.9 re-tracement.
End of Week Analysis
Data as at the market close of July 21
===============================
Gold markets rallied during the week, slicing through the 1250 level, showing signs of real strength. Prices reached as high as 1255.64 before dipping slightly into the close on Friday. The movement is exactly as it should. My intraday update on Friday predicted that gold prices would reach up to the daily bottom cloud boundary at 1255.23 and get rejected by the kumo initially. The next wave of price rise following the pullback would prove to be an eye-opener. No doubt, prices would break into the cloud and most probably trade above it. How high prices would then reach is going to be telling. A break above 1260 would open up the 1270-1280 region followed by the double top of 1294.96 and 1295.65. A break above this would be difficult, but if it does do so, then 1350 will not be out of the question. Conversely, the brown trendline resistance-turned-support around 1235, followed by the May 9 low of 1241.81, will be tested before targeting 1205.41. Should prices drop below 1205.41 on a daily closing basis, then the round-number psychological support of 1200, as well as the 1183-1193 region, would appear as quotes.
Price action in the coming week will focus on the price rise after a pullback. Prices have already traded above the 200-day SMA at 1232.04, breached the brown trendline resistance lying close to the tenkan-sen at 1231.65 and the kijun-sen at 1236.25, and broken above the 50-day SMA at 1249.48. The kumo is next in the gunsight. The MACD is on a roll ever since the bullish crossover on Monday July 17. The 5-day RSI is overbought, and is still rising. Folks, there is money to be made in the gold market before a larger pullover is in the works.
Thanks for the update, Alan. I see the daily tenkan is about to cross above the kijun. This means the bounce has more to go, correct?
Vince. That is absolutely correct.
Thanks Alan. Your updates and analysis has proven again to be very spot on…
An oil update would be much appreciated. It looks like oil has turned around big time. I missed the turnaround and I’m hoping for a small bounce to get in short in that market
Ari. Thank you very much for your confidence in my analysis. It is very much appreciated, and gives me inspiration to continue doing so.
I’ll furnish a full report on oil later on in the day. We have a meeting of our small housing community in a moment to settle some pressing issues, and I’ll work on the oil report once that is over. So, here’s a brief outlook before I get to work on the full details. I think there will be a bit of sell-off as traders square positions ahead of the St Petersburg’s meeting on Monday. The outcome of that meeting will point the way forward for future oil prices. Saudi Arabia had floated the idea of reducing their exports, not production. Let’s see if the other member countries can buy that. It is possible that some form of agreement may happen as group pressure would come to bear on recalcitrant members. This would be short-lived as OPEC consists of a rag-tag group with their own national agenda. What this means is a short rise in price preceding a larger fall when the world could see that there is no follow through. Like you, I had hesitated in going short last Friday due to the OPEC meeting. I will do so just after the price rises.