
A short term target at 1,264 has not been met; price has fallen $5.41 short. However, price did make a new high at the start of Monday’s session and overall upwards movement continues as expected.
Summary: A small consolidation may continue sideways and complete within the next 24 hours, to be followed by a final small upwards wave that may be about $18 in length but no longer than $23.25.
Classic technical analysis still offers more support for the main wave count than the alternate.
Always use a stop. Invest only 1-5% of equity on any one trade.
New updates to this analysis are in bold.
Last monthly charts and alternate weekly charts are here, video is here.
Grand SuperCycle analysis is here.
MAIN ELLIOTT WAVE COUNT
WEEKLY CHART
Click chart to enlarge.
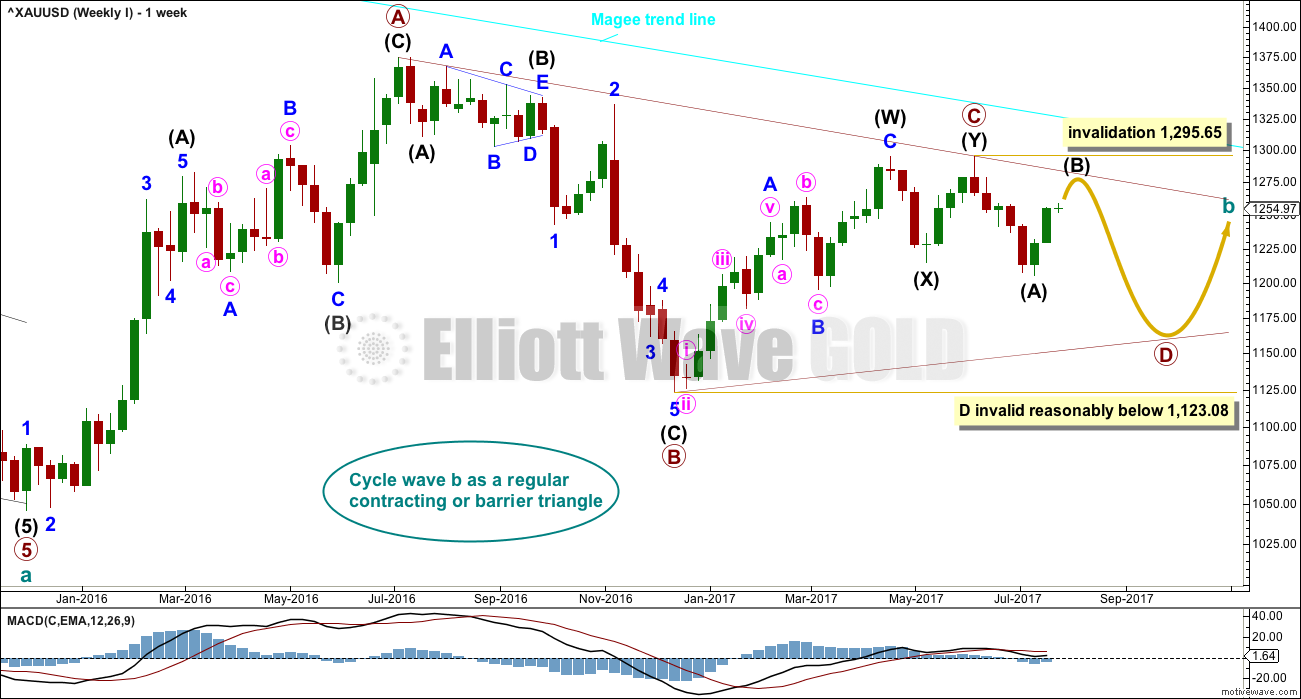
The Magee bear market trend line is added to the weekly charts. This cyan line is drawn from the all time high for Gold on the 6th of September, 2011, to the first major swing high within the following bear market on the 5th of October, 2012. This line should provide strong resistance.
At this stage, a triangle still looks possible and has the best fit for cycle wave b. It has some support from declining ATR and MACD now beginning to hover about zero.
Within a triangle, one sub-wave should be a more complicated multiple, which may be primary wave C. This is the most common sub-wave of the triangle to subdivide into a multiple.
Primary wave D of a contracting triangle may not move beyond the end of primary wave B below 1,123.08. Contracting triangles are the most common variety.
Primary wave D of a barrier triangle should end about the same level as primary wave B at 1,123.08, so that the B-D trend line remains essentially flat. This involves some subjectivity; price may move slightly below 1,123.08 and the triangle wave count may remain valid. This is the only Elliott wave rule which is not black and white.
Triangles normally adhere very well to their trend lines. So far the A-C trend line has been tested 11 times; this line has very strong technical significance. If this wave count is correct, then intermediate wave (B) should find very strong resistance if it gets up to the A-C trend line. A small overshoot is acceptable. A breach is not.
Finally, primary wave E of a contracting or barrier triangle may not move beyond the end of primary wave C above 1,295.65. Primary wave E would most likely fall short of the A-C trend line. But if it does not end there, then it can slightly overshoot that trend line.
Primary wave A lasted 31 weeks, primary wave B lasted 23 weeks, and primary wave C may have been complete in 25 weeks.
Primary wave D should now be expected to last a Fibonacci 13 or 21 weeks in total.
DAILY CHART
Click chart to enlarge.
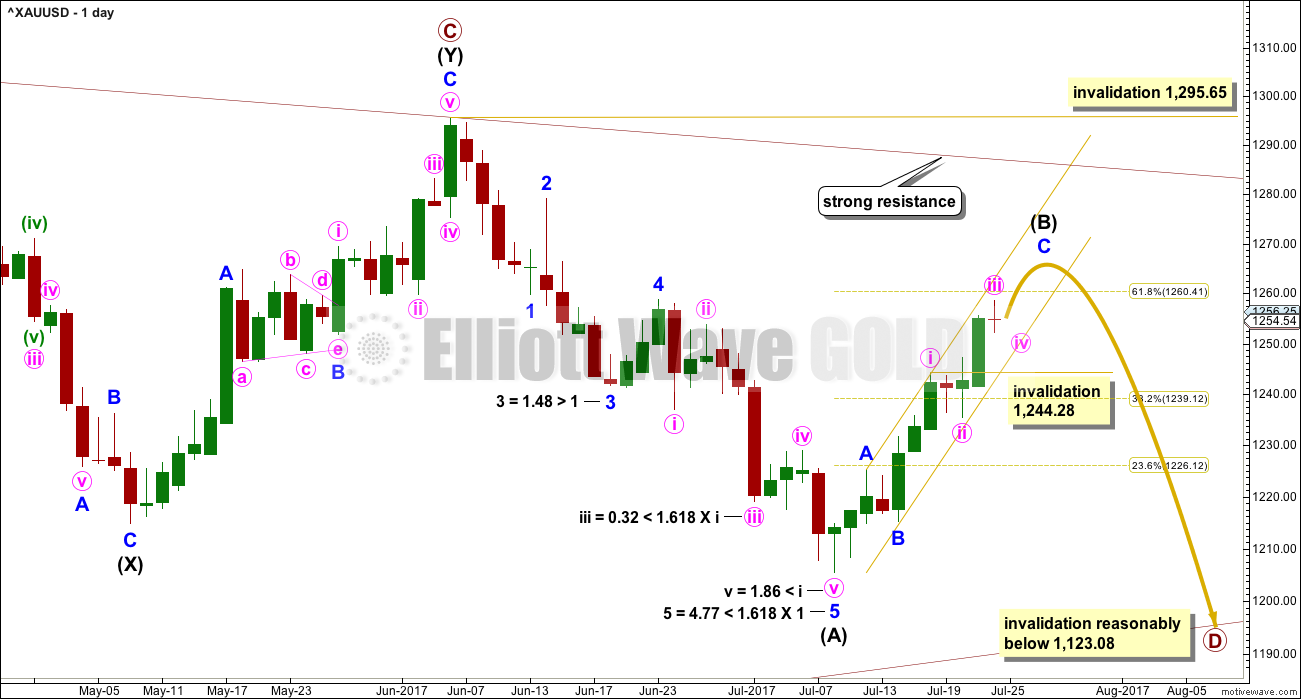
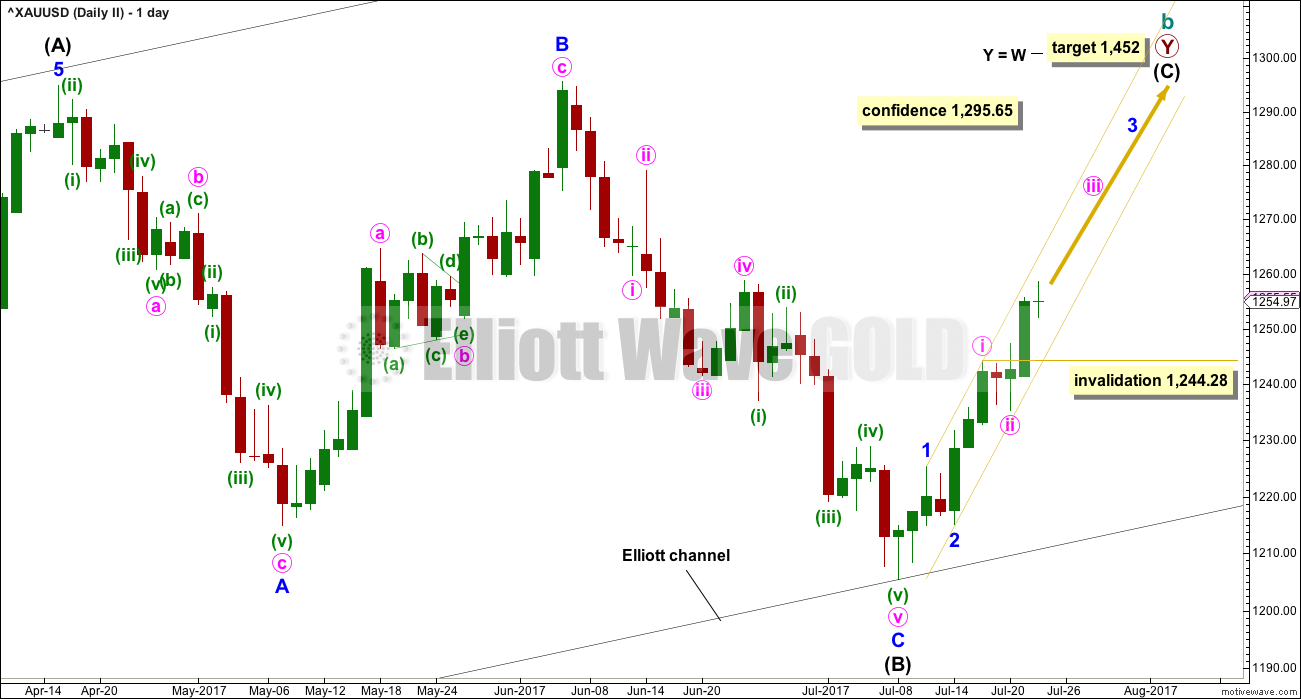
A common range for triangle sub-waves is from about 0.8 to 0.85 the prior sub-wave, this gives a range for primary wave D from 1,158 to 1,149. At this stage, to try and see the whole of primary wave D complete at last week’s low does not look right. The B-D trend line would be too steep for a normal looking contracting Elliott wave triangle, and primary wave D would have been far too brief at only 5 weeks duration. For the wave count to have the right look and good proportions (as Gold almost always does), primary wave D should not be labelled over yet.
If primary wave C is correctly labelled as a double zigzag, then primary wave D must be a simple A-B-C structure and would most likely be a zigzag.
It is possible that only intermediate wave (A) was over at the last low and the current bounce is intermediate wave (B).
Intermediate wave (B) looks to be unfolding as a zigzag, a three wave structure. Corrective waves have a count of 3, 7, 11, 15 etc. Each extension adds another 4. So far intermediate wave (B) has a count of 5 on the daily chart, and so a further 2 is required to total 7. The structure cannot be complete at this stage. This means that another small consolidation lasting about two days should unfold along the way upwards to end intermediate wave (B).
So far intermediate wave (B) has lasted 10 days and the structure is incomplete. The next Fibonacci number in the sequence is 13, which would see intermediate wave (B) end in a further three days.
Within the zigzag of primary wave D, intermediate wave (B) may not move beyond the start of intermediate wave (A) above 1,295.65.
While it is still possible that intermediate wave (B) may end close to the 0.618 Fibonacci ratio of intermediate wave (A) at 1,260, it now looks less likely. When minute waves iii and iv are complete, then a new target will be calculated at minor and minute degree for the final high of intermediate wave (B).
HOURLY CHART
Click chart to enlarge.
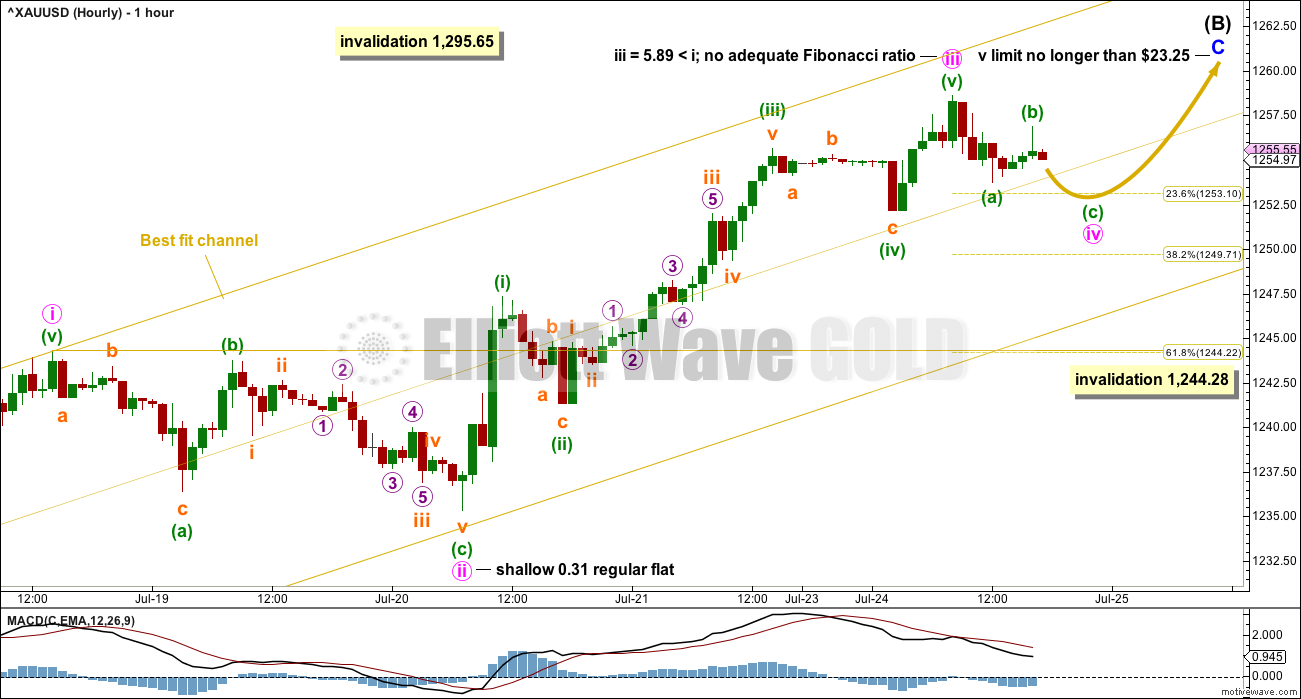
Upwards movement may be a zigzag for intermediate wave (B). Zigzags subdivide 5-3-5, exactly the same as the start of an impulse.
Minor waves A and B look correct. Minor wave C must be a five wave structure.
Use the best fit channel as a guide to upwards movement and for trading. When price moves into the lower half of the channel, then minute wave iii may be over and minute wave iv may be underway. Minute wave iv may find support at the lower edge of the channel. That may provide another entry point to join the upwards trend.
Minute wave ii was a shallow flat correction lasting two days on the daily chart. Minute wave iv may exhibit alternation as a more shallow zigzag. It may complete within the next 24 hours and last overall about two days on the daily chart, which would give the wave count good proportion at both hourly and daily time frames.
When minute wave iv is over, then a target and limit may be calculated for minute wave v. There is no Fibonacci ratio between minute waves iii and i, which makes it more likely that minute wave v would exhibit a Fibonacci ratio to either. The most likely would be 0.618 the length of minute wave i, about $18.
If this wave count is invalidated by downwards movement below 1,244.28, then it may be possible that intermediate wave (B) could be over.
ALTERNATE ELLIOTT WAVE COUNT
WEEKLY CHART
Click chart to enlarge.
This wave count has been published only in historical analysis. At this stage, it will be published on a daily basis.
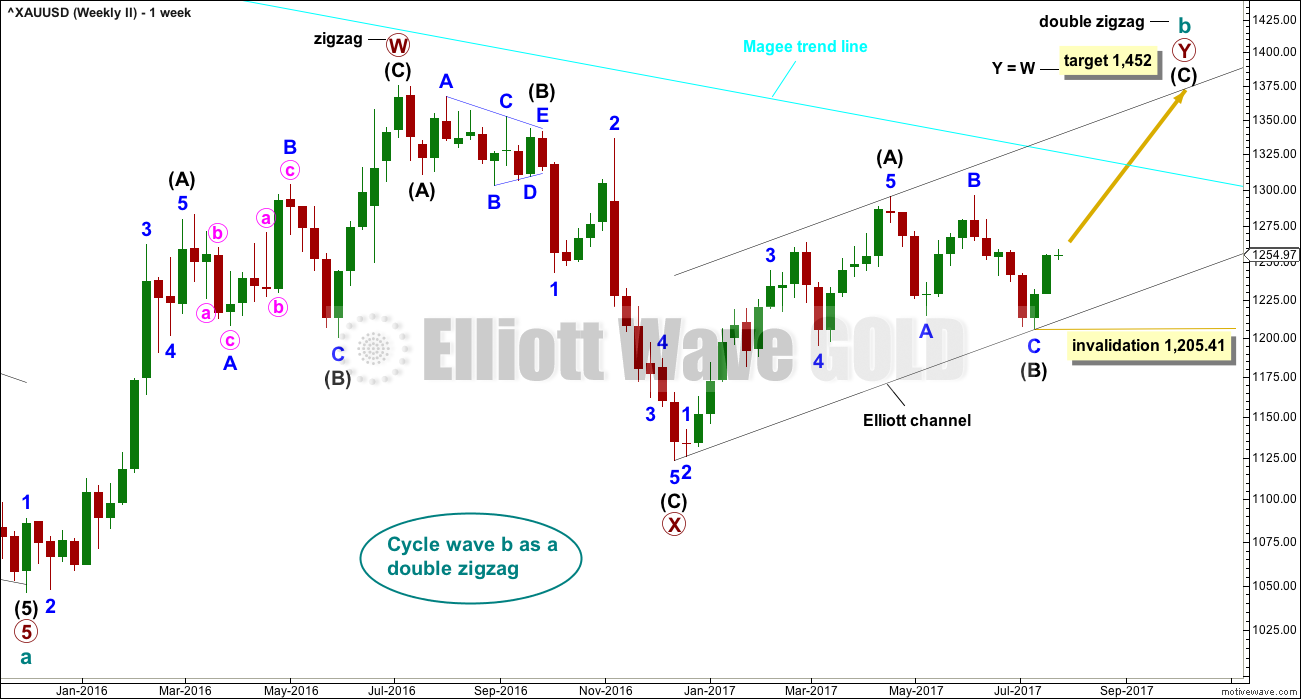
There are more than 23 possible corrective structures that B waves may take, and although cycle wave b fits best at this stage as a triangle (main wave count), it may still be another structure. This wave count looks at the possibility that it may be a double zigzag.
If cycle wave b is a double zigzag, then current upwards movement may be part of the second zigzag in the double, labelled primary wave Y.
The biggest problem with this wave count is the structure of intermediate wave (A). This upwards wave looks very much like a three and not a five. This upwards wave must be seen as a five for this wave count to work.
Within the second zigzag of primary wave Y, intermediate wave (B) is a completed regular flat correction. Minor wave C ends just slightly below the end of minor wave A avoiding a truncation. There is no Fibonacci ratio between minor waves A and C.
The target remains the same as previously published for this wave count.
Along the way up, some resistance should be expected at the cyan Magee trend line.
Within intermediate wave (C), no second wave correction may move beyond the start of its first wave below 1,205.41.
DAILY CHART
Click chart to enlarge.
Intermediate wave (C) may be unfolding as an impulse. So far minor waves 1 and 2 may be complete. It is common for Gold to exhibit short first waves and very long extended third waves.
When minor wave 3 is complete, then minor wave 4 may not move down into minor wave 1 price territory below 1,225.33.
HOURLY CHART
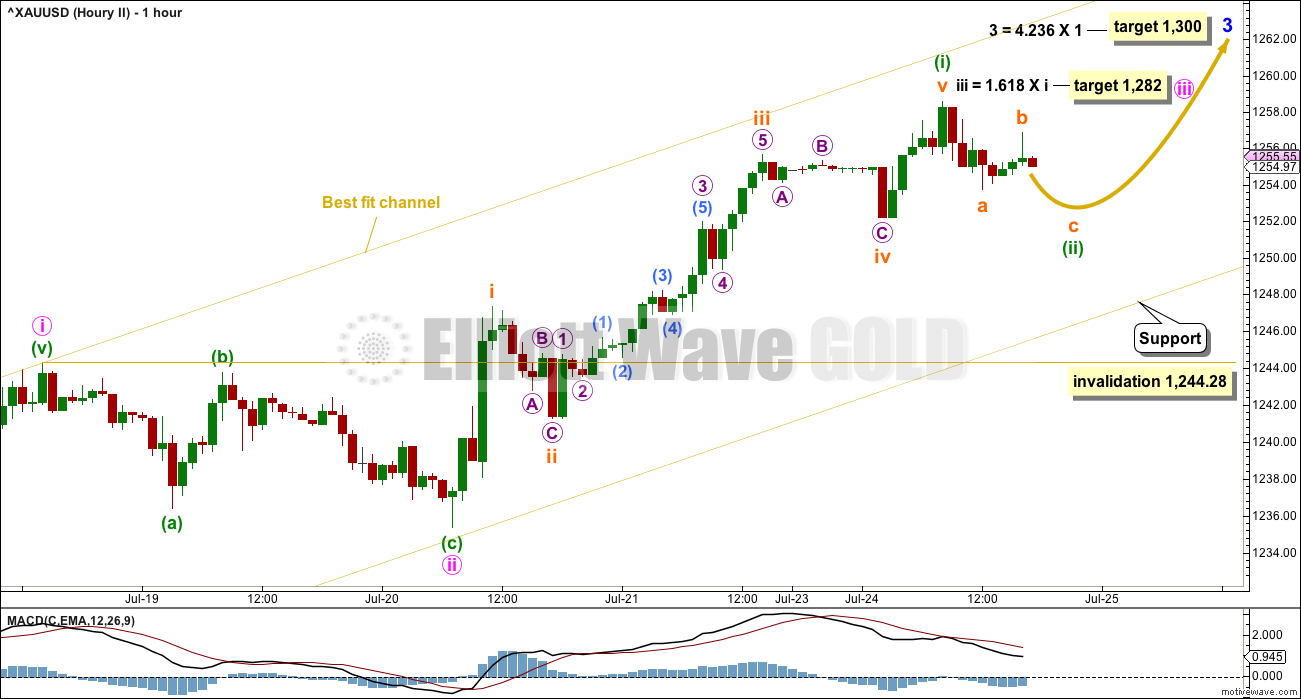
Click chart to enlarge.
A-B-C of a zigzag subdivides 5-3-5. This is exactly the same as 1-2-3 of an impulse. Both wave counts at the hourly chart level may have the same subdivisions.
The target for minor wave 3 is reasonable given that minor wave 1 was very short. This is not an uncommon Fibonacci ratio for Gold, and it fits with the higher target for minor wave 5 to end primary wave Y.
Minor wave 3 may only subdivide as an impulse. So far only minor waves 1 and 2 may be complete. This wave count now expects to see a further increase in upwards momentum as a third wave at two degrees moves higher. This should also have strong support from volume.
If this wave count is correct, then either or both of minute wave iii and minor wave 3 may end with blow off tops.
At this stage, the middle of the third wave for this alternate is unlikely to have passed; the degree of labelling for the last five up is one degree lower than the main wave count. The subdivisions are still the same. Minuette wave (ii) should remain contained within the channel, so the invalidation point is left as is.
Minute wave (iv) may not move into minute wave (i) price territory below 1,244.28.
TECHNICAL ANALYSIS
WEEKLY CHART
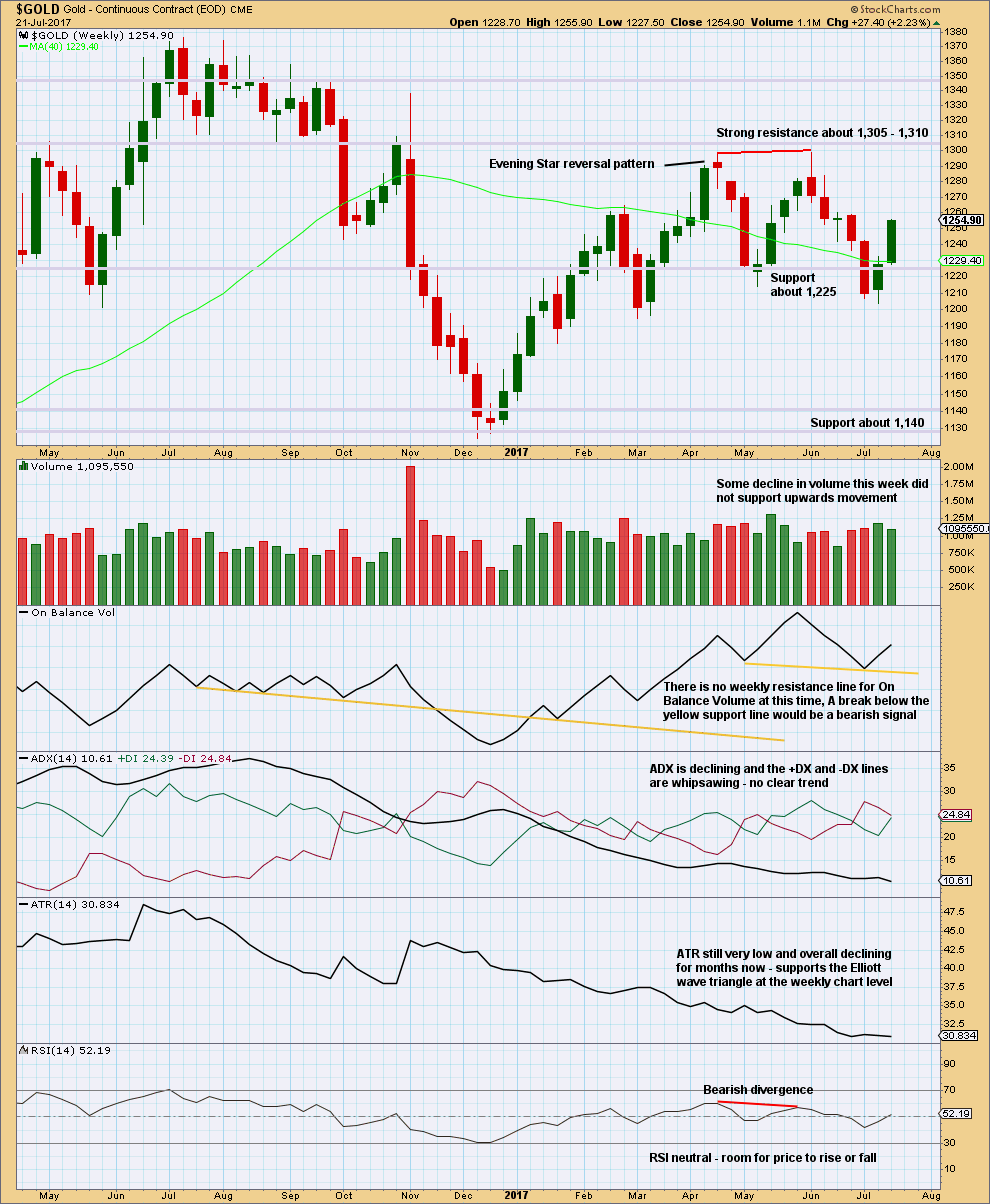
Click chart to enlarge. Chart courtesy of StockCharts.com.
A lack of support for upwards movement from volume favours the main Elliott wave count.
ADX and ATR favour the main Elliott wave count.
DAILY CHART
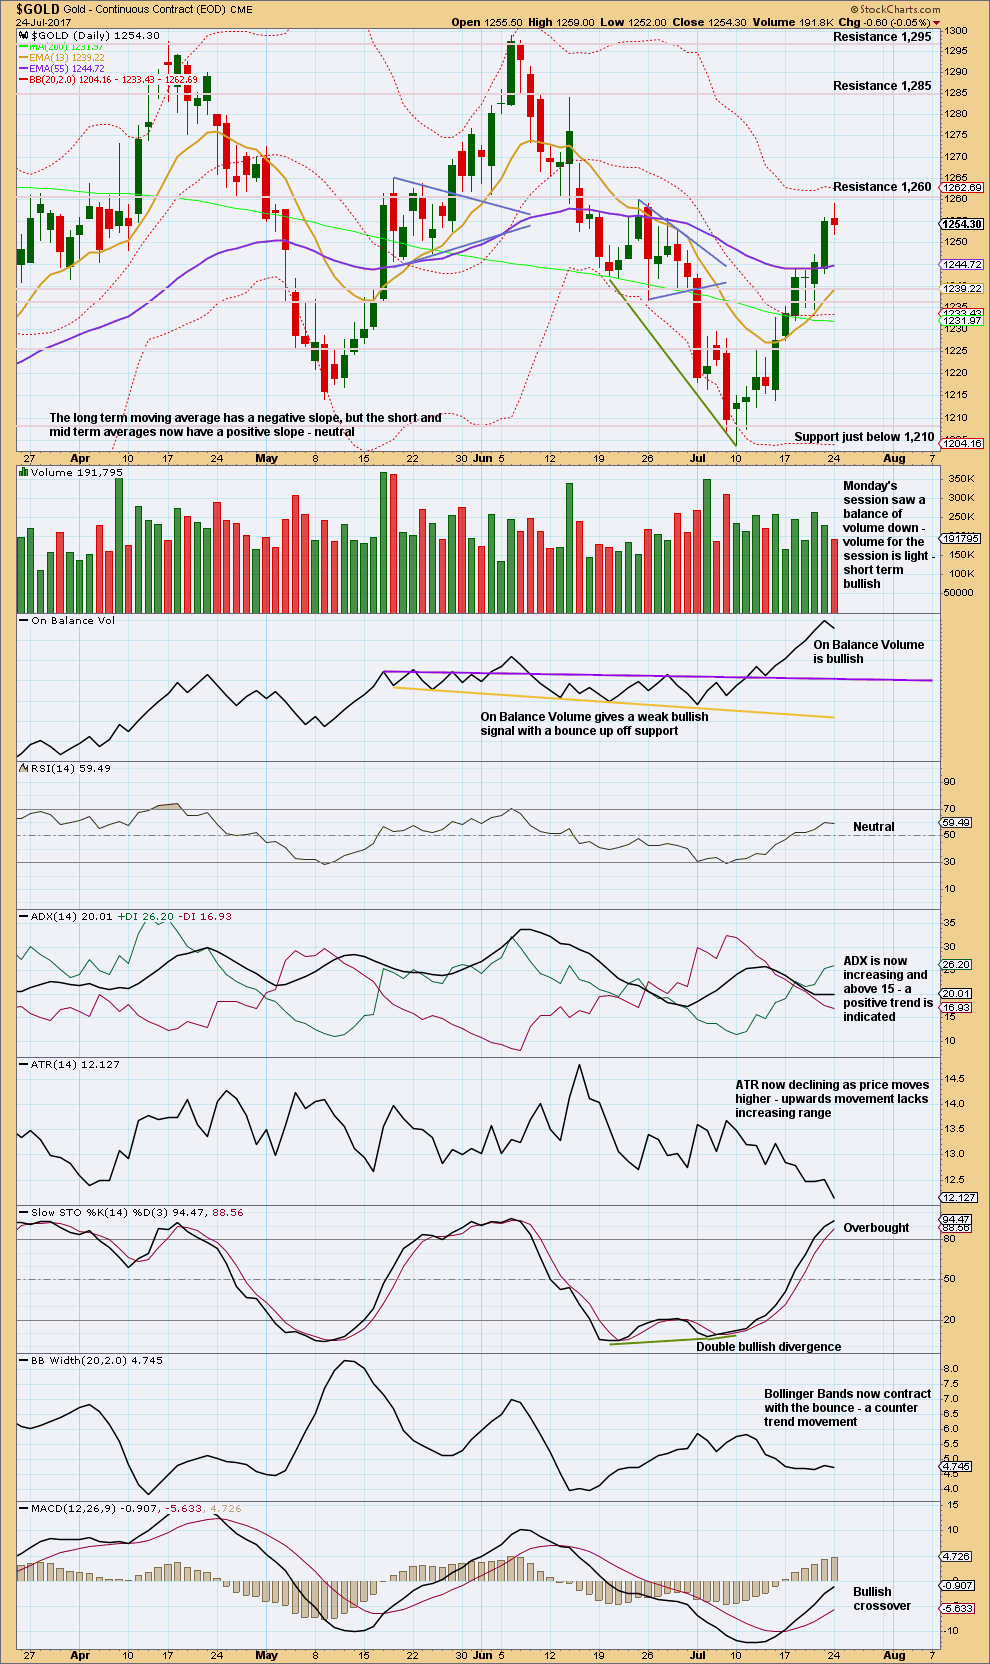
Click chart to enlarge. Chart courtesy of StockCharts.com.
A small spinning top candlestick indicates indecision for Monday, a balance of bulls and bears. The balance of volume for the session was down and the candlestick closed red. During the session, volume did not support downwards movement and this is read as bullish. This session looks like a small pause within an ongoing upwards trend.
Strongly declining ATR along with contracting Bollinger Bands indicate something may be wrong with this upwards movement. It lacks range and normal widening of volatility. This does not so far look like a normal healthy trend. This is typical of B waves. This favours the main Elliott wave count.
GDX
DAILY CHART
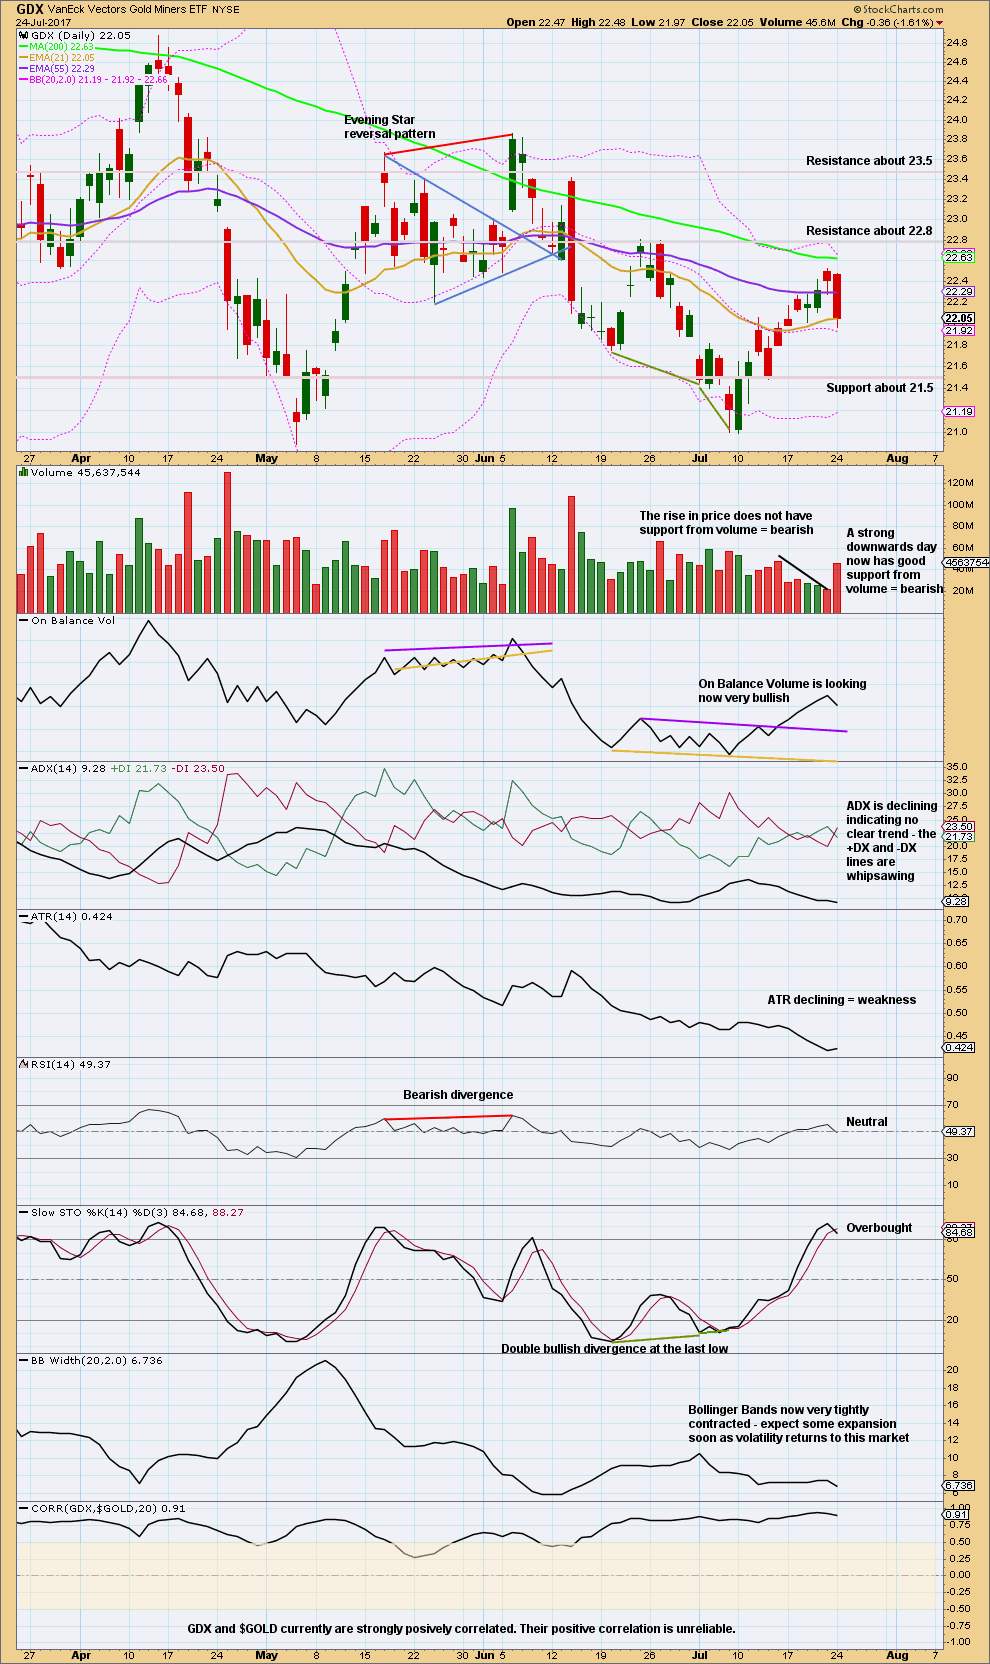
Click chart to enlarge. Chart courtesy of StockCharts.com.
GDX has reacted downwards just below the 200 day moving average. The volume profile is bearish.
Be aware that the correlation between GDX and Gold is unreliable. Although they are currently strongly positively correlated, their past behaviour absolutely shows that this correlation does not necessarily have to persist. In fact, we should assume that it may not and the correlation may be broken any day.
Published @ 08:20 p.m. EST.
Come on, sub $1,244.28
Almost there, you can do it!
Gold may have topped already. Looks like it’s going down from here. 3rd wave down possibly?
currently a bit challenging… gold down and Oil up like a racket… any alternative wave counts for Oil. I know Lara you only do updates once / week, which was yesterday , however the picture today looks quite different.
Or any thought from the other experts on this page about the move on Oil?
Thanks
Ursula
Lara posted an update today in the oil comments
So far so good for Gold (and the S&P today, but copper and oil…. not so good)
Minute iv may now be a complete structure. The count now at the daily chart level is 6. It needs a final wave up to make 7, a corrective count. Then it could be complete for intermediate (B).
Oil quite frisky today. USO pecking top of upper BB so I think we will see a reversal the next day or two. I will be rolling short trades if no reversal by close tomorrow. Copper may be a different story; it does look like a break-out underway.
Imo all this needs at this stage is a break below 1248 to set the cat among the pigeons and open up 1243-1235 range….. Lets go bears!!
Stopped out of copper for full 5% loss real bummer thought it had turned down on friday
Me too 🙁
It’s broken a trend line that goes back to 2011 today. I’ll post an update in the comments of next Gold analysis, I’ll be looking for a pullback to test support at that line to enter long.
Gold Ichimoku Daily Analysis
Data as at 6:55 am ET, July 25
=========================
The gold market is consolidating near its highs. Prices initially fell on Monday, but found enough support at 1253.76 to bounce as high as 1256.85 before dropping at the end of the trading day. These movements form the minuette A subwave of Minute 4 of Minor C. As at the time of writing, Minute 4 is almost over in its entirety.
The US market should open today with a move higher in Minute 5, targeting 1261.68 (where Intermediate B = 0.618 * Intermediate A), or around 1264 (where Minute 5 = 0.618 * Minute 3). The exact value circa 1264 can only be calculated when Minute 4 is deemed completed. This is the final high before a sizeable pullback in Intermediate C, and bulls must be very cautious at this juncture.
In the short-term, the trend is clearly bullish as prices are making higher highs and higher lows ever since July 10. Prices remain in the golden trend channel drawn yesterday. They have also entered into the cloud, which negates the bearish stance. The tenkan-sen lies above the kijun-sen and both lines lie quite a distance from the kumo. There is no trend reversal signal, only warnings that this short-term trend might end soon. However, if there is very strong momentum on the way up, especially if the upper channel line is breached to the upside, the bullish count becomes more likely, as in the Alternate Count. For the Main Count to be correct, prices must breach the lower channel line after Primary 5 is completed. We shall wait to see how this plays out. Momentum remains positive as the MACD histogram prints in the black with an upward sloping trajectory which points to higher prices for the yellow metal. The 5-day RSI is very overbought and has started to decline slightly yesterday. I would not expect a strong price rise today or even the early part of tomorrow. Traders are usually apprehensive in the face of Fed meetings, but indications are that the Fed is very unlikely to change rates tomorrow. But, this nervous ambience tends to produce lackadaisical price movements as traders square positions ahead of the Fed release.
As always, thank you.
GDX threw another curve ball yesterday. Price broke downwards from the channel. I think the upwards move is over. It appears yesterday I missed that a contracting ending diagonal had formed, ending the upward movement.
I think GDX is now headed toward a target of approx. 20.50 with upward corrections along the way. If you are short, stops should be placed above 22.53. Good luck
https://www.tradingview.com/x/EACatyLH/
Thank you for the timely update.
Lara, thanks for the feedback on EWI counts.
A question on triangle sub waves:
You stated “Four of the five sub-waves of a triangle must be zigzags or zigzag multiples. One sub-wave may therefore be a different type of A-B-C correction, such as a flat correction.”
Does that mean that a zigzag multiple, i.e. “double zigzag” may count as the one complex wave, but it doesn’t have to.
And can you have more than one sub wave be a double zigzag?
Would the following scenario meet the rules?
Triangle sub waves:
______________________________________
A: Zigzag
B: Double zigzag
C: Triangle or Flat
D: Double zigzag
E: Zigzag
Thanks,
Dreamer – thank you for posting the EWI charts. Although I know they’re my biggest competition, it certainly helps to take a look at what wave counts they have when they make it publicly available.
Although I find it of limited use because there is no detail in it. And no discussion of or justification for why they label the waves as they do.
Still, always interesting to see another take on a wave count.
Lara’charts and counts are better.
Agreed, and no one provides EW counts with more detail!
While I appreciate the team at EWI for certain contributions, I’ve always found their counts without detail to be of any use. This was very true with their investor “daily” charts. For over a month they’ve said all US indexes have been due for major pullbacks, gold bullish. Meanwhile I’ve held long on US and shorted gold was very profitable. There were 2 other major turns too while I had both EWI and Lara’s service; but as a trader found Lara’s charts, advice, options and detail to WHY to be of more value and critical to trade. At the very least one could stay nimble with Lara’s input. But in my personal experience, I’ve stayed profitable.
Their short term count shows gold going higher, yet they also leave open an option for a b wave before continuing higher.
Thanks again Lara for allowing these postings so that we can all debate and learn from other similar / dissimilar counts.
Their daily seems to show the B wave at the June high might be lower than the April high on their data. That said, why would the B wave overshoot the trendline so far? Looks wrong, no?
Agreed. That doesn’t look right.
I’ve just double checked my data feeds: both BarChart and StockCharts have the June high slightly higher than April. But I agree Dreamer, EWI’s data looks like the June high is slightly lower than April.
Sometimes triangles overshoot their trend lines by a little, and with my definition of an overshoot vs a breach that isn’t actually a breach. There is not a full daily candlestick above and not touching the line.
But yeah, it’s a pretty sizeable overshoot.
The weekly shows the triangle details closer.
Lara, Isn’t that a sloppy/ incorrect count showing Wave C completing at the lower high in April?
Their alternate is shown also.
Yes, it looks wrong. Technically…. it could be correct. Four of the five sub-waves of a triangle must be zigzags or zigzag multiples. One sub-wave may therefore be a different type of A-B-C correction, such as a flat correction. Maybe they’re trying to see (D) as a flat.
We really can’t tell, because there is no detail within the structure offered in the chart.
IMO that A-C trend line they have doesn’t look right.
Lara / All,
EWI has free 2 day access to their metals pro service, so I thought you might like to offer your thoughts on their similar, yet different counts including some questionable ones….
Monthly gold count – seems that EWI thinks the triangle might be almost complete, showing a triangle completing faster than what is “normally” the case
EWI???!! Run for your trading lives!!!
Just kidding. But do be careful using their counts if you are trading with real capital. 🙂
😱