A small correction was expected to move sideways and end within 24 hours. Downwards movement still fits the Elliott wave count (although deeper than expected) and price remains above the invalidation point on the hourly chart.
Summary: While price remains above 1,244.28, it is possible that this bounce may be close to completion. The target is now at 1,265.
If price makes a new low below 1,244.28 within the next 24 hours, then expect this small pullback within the mid term upwards trend is not over. Targets are at 1,238 or 1,226. Volume favours the view that this pullback is not quite over yet.
Always use a stop. Invest only 1-5% of equity on any one trade.
New updates to this analysis are in bold.
Last monthly charts and alternate weekly charts are here, video is here.
Grand SuperCycle analysis is here.
MAIN ELLIOTT WAVE COUNT
WEEKLY CHART
The Magee bear market trend line is added to the weekly charts. This cyan line is drawn from the all time high for Gold on the 6th of September, 2011, to the first major swing high within the following bear market on the 5th of October, 2012. This line should provide strong resistance.
At this stage, a triangle still looks possible and has the best fit for cycle wave b. It has some support from declining ATR and MACD now beginning to hover about zero.
Within a triangle, one sub-wave should be a more complicated multiple, which may be primary wave C. This is the most common sub-wave of the triangle to subdivide into a multiple.
Primary wave D of a contracting triangle may not move beyond the end of primary wave B below 1,123.08. Contracting triangles are the most common variety.
Primary wave D of a barrier triangle should end about the same level as primary wave B at 1,123.08, so that the B-D trend line remains essentially flat. This involves some subjectivity; price may move slightly below 1,123.08 and the triangle wave count may remain valid. This is the only Elliott wave rule which is not black and white.
Triangles normally adhere very well to their trend lines. So far the A-C trend line has been tested 11 times; this line has very strong technical significance. If this wave count is correct, then intermediate wave (B) should find very strong resistance if it gets up to the A-C trend line. A small overshoot is acceptable. A breach is not.
Finally, primary wave E of a contracting or barrier triangle may not move beyond the end of primary wave C above 1,295.65. Primary wave E would most likely fall short of the A-C trend line. But if it does not end there, then it can slightly overshoot that trend line.
Primary wave A lasted 31 weeks, primary wave B lasted 23 weeks, and primary wave C may have been complete in 25 weeks.
Primary wave D should now be expected to last a Fibonacci 13 or 21 weeks in total.
DAILY CHART
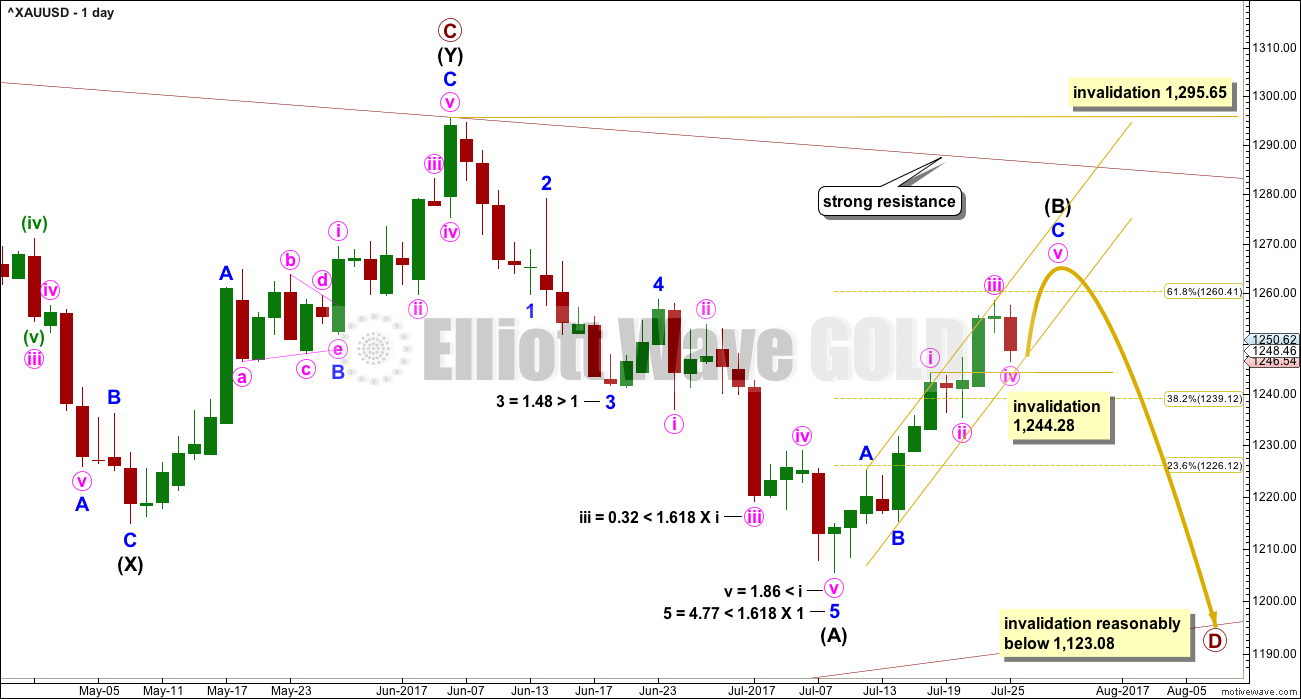
A common range for triangle sub-waves is from about 0.8 to 0.85 the prior sub-wave, this gives a range for primary wave D from 1,158 to 1,149. At this stage, to try and see the whole of primary wave D complete at last week’s low does not look right. The B-D trend line would be too steep for a normal looking contracting Elliott wave triangle, and primary wave D would have been far too brief at only 5 weeks duration. For the wave count to have the right look and good proportions (as Gold almost always does), primary wave D should not be labelled over yet.
If primary wave C is correctly labelled as a double zigzag, then primary wave D must be a simple A-B-C structure and would most likely be a zigzag.
It is possible that only intermediate wave (A) was over at the last low and the current bounce is intermediate wave (B).
Intermediate wave (B) looks to be unfolding as a zigzag, a three wave structure. Corrective waves have a count of 3, 7, 11, 15 etc. Each extension adds another 4. So far intermediate wave (B) has a count of 6 on the daily chart, and so a further 1 is required to total 7. To see it over at the last high would have a count of 5, which is impulsive and not corrective. A final wave upwards is required for the count to look right at the daily chart level now.
So far intermediate wave (B) has lasted 11 days and the structure is incomplete. The next Fibonacci number in the sequence is 13, which would see intermediate wave (B) end in a further two days.
Within the zigzag of primary wave D, intermediate wave (B) may not move beyond the start of intermediate wave (A) above 1,295.65.
While it is still possible that intermediate wave (B) may end close to the 0.618 Fibonacci ratio of intermediate wave (A) at 1,260, it now looks less likely. When minute waves iii and iv are complete, then a new target will be calculated at minor and minute degree for the final high of intermediate wave (B).
HOURLY CHART
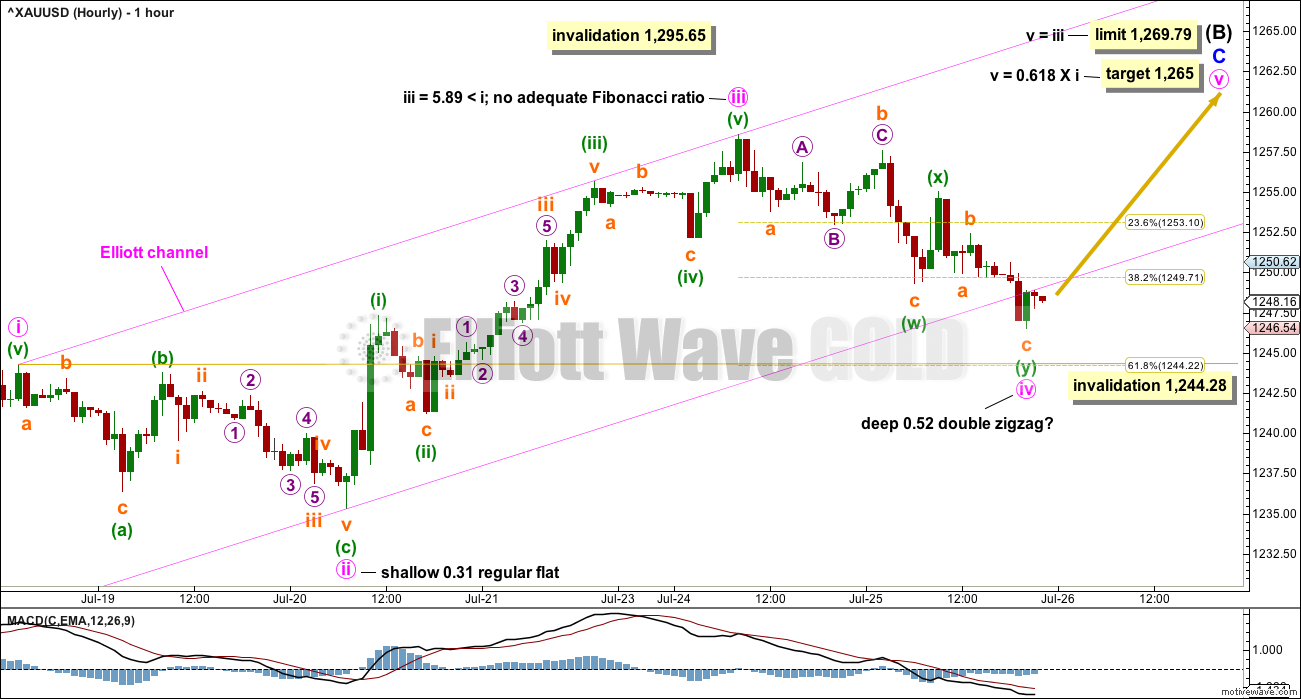
Upwards movement may be a zigzag for intermediate wave (B). Zigzags subdivide 5-3-5, exactly the same as the start of an impulse.
Minor waves A and B look correct. Minor wave C must be a five wave structure.
With price now moving below the lower edge of the best fit channel in last analysis, the channel is now redrawn. Sometimes fourth waves are not neatly contained within channels, which is why Elliott developed a second technique to redraw the channel when the fourth wave breaches it. At this stage, the breach of this Elliott channel is small and it will be left as is for now. If the breach gets bigger, then the channel may need to be redrawn again using the second technique.
There is now perfect alternation between the shallow flat of minute wave ii and the deep zigzag of minute wave iv.
Because minute wave iii is shorter than minute wave i, minute wave v is limited to no longer than equality in length with minute wave iii, so that minute wave iii is not the shortest and this core Elliott wave rule is met.
Fifth waves most commonly exhibit Fibonacci ratios to their first waves. The target assumes minute wave v will exhibit a Fibonacci ratio to minute wave i.
Minute wave v may end mid way within the channel.
Minute wave iv may not move into minute wave i price territory below 1,244.28.
If this first hourly wave count is invalidated, use the second count below.
HOURLY CHART II
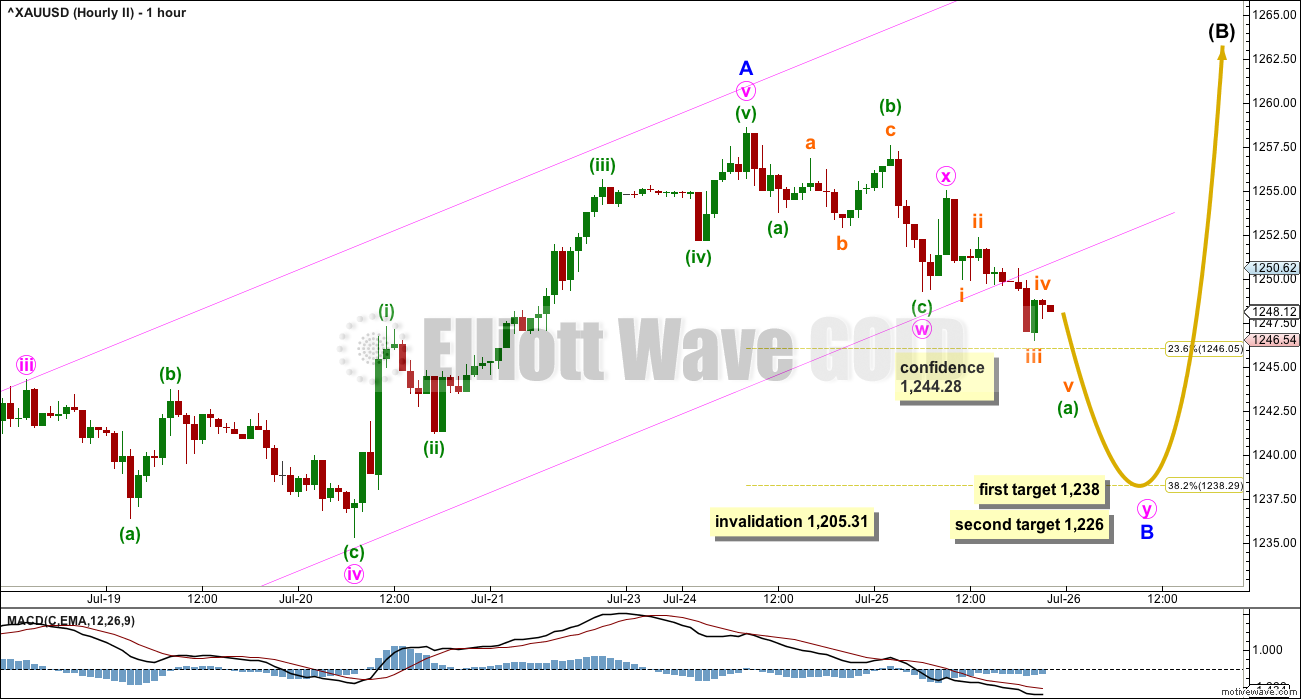
There is a five up complete now at the daily chart level. This may be only minor wave A within intermediate wave (B).
If minor wave A has subdivided as a five wave impulse, then minor wave B may not move beyond its start below 1,205.31. If minor wave A is a five wave structure, then the larger correction for intermediate wave (B) is indicated as a zigzag and the structure should be incomplete.
Minor wave B may be any one of more than 23 possible corrective structures. At this stage, it looks like it may be unfolding as a double zigzag. But if this wave count is correct, then the labelling within minor wave B may change. If it continues as a flat or running triangle, then it may include a new high above its start at 1,258.59.
B waves exhibit the greatest variety in structure and price behaviour. B waves within B waves are the absolute worst trading opportunities. They are best avoided. If this wave count proves to be correct, then the focus over the next day to few will be on identifying when minor wave B may be complete and not on trying to predict the whipsaws within it.
Both the 0.382 and 0.618 Fibonacci ratios of minor wave A are equally likely targets for minor wave B.
If the first hourly wave count is invalidated with a new low below 1,244.28, then this second wave count would be the new main wave count.
Minor wave B may last anywhere from one to a few days. It may be a swift sharp zigzag or multiple zigzag down, or it may be a time consuming complicated combination or triangle lasting a few days.
ALTERNATE ELLIOTT WAVE COUNT
WEEKLY CHART
This wave count has been published only in historical analysis. At this stage, it will be published on a daily basis.
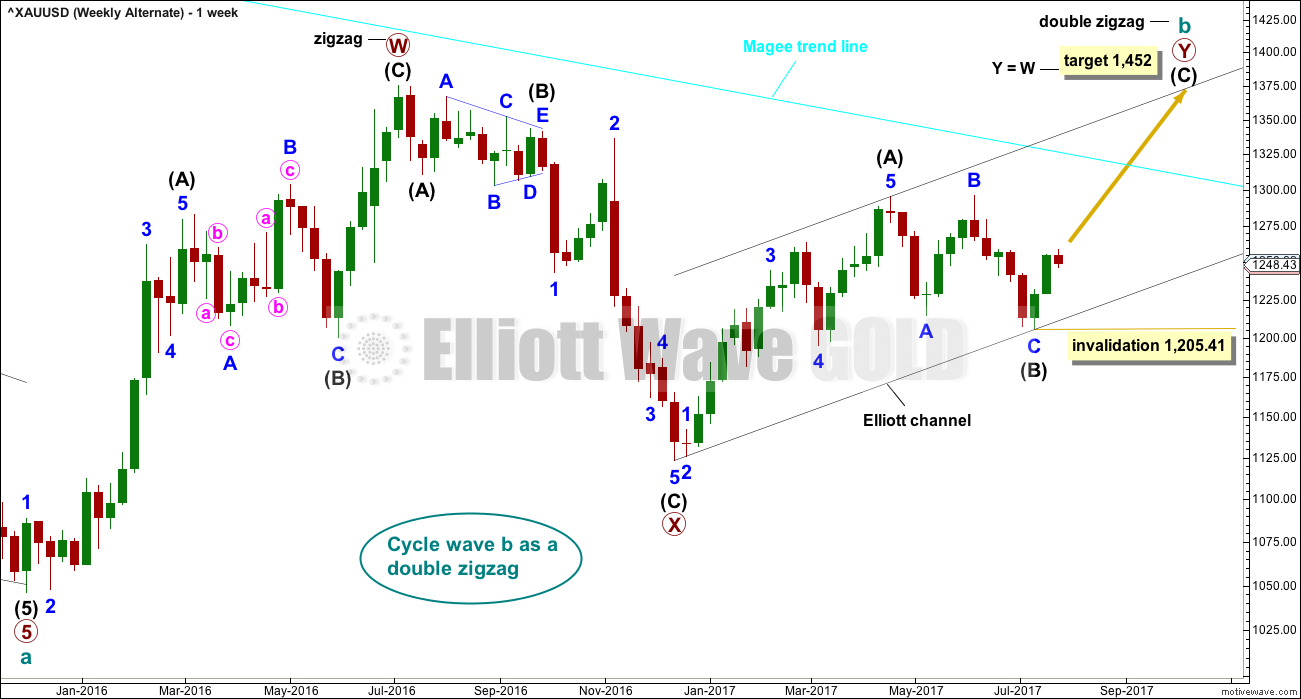
There are more than 23 possible corrective structures that B waves may take, and although cycle wave b fits best at this stage as a triangle (main wave count), it may still be another structure. This wave count looks at the possibility that it may be a double zigzag.
If cycle wave b is a double zigzag, then current upwards movement may be part of the second zigzag in the double, labelled primary wave Y.
The biggest problem with this wave count is the structure of intermediate wave (A). This upwards wave looks very much like a three and not a five. This upwards wave must be seen as a five for this wave count to work.
Within the second zigzag of primary wave Y, intermediate wave (B) is a completed regular flat correction. Minor wave C ends just slightly below the end of minor wave A avoiding a truncation. There is no Fibonacci ratio between minor waves A and C.
The target remains the same as previously published for this wave count.
Along the way up, some resistance should be expected at the cyan Magee trend line.
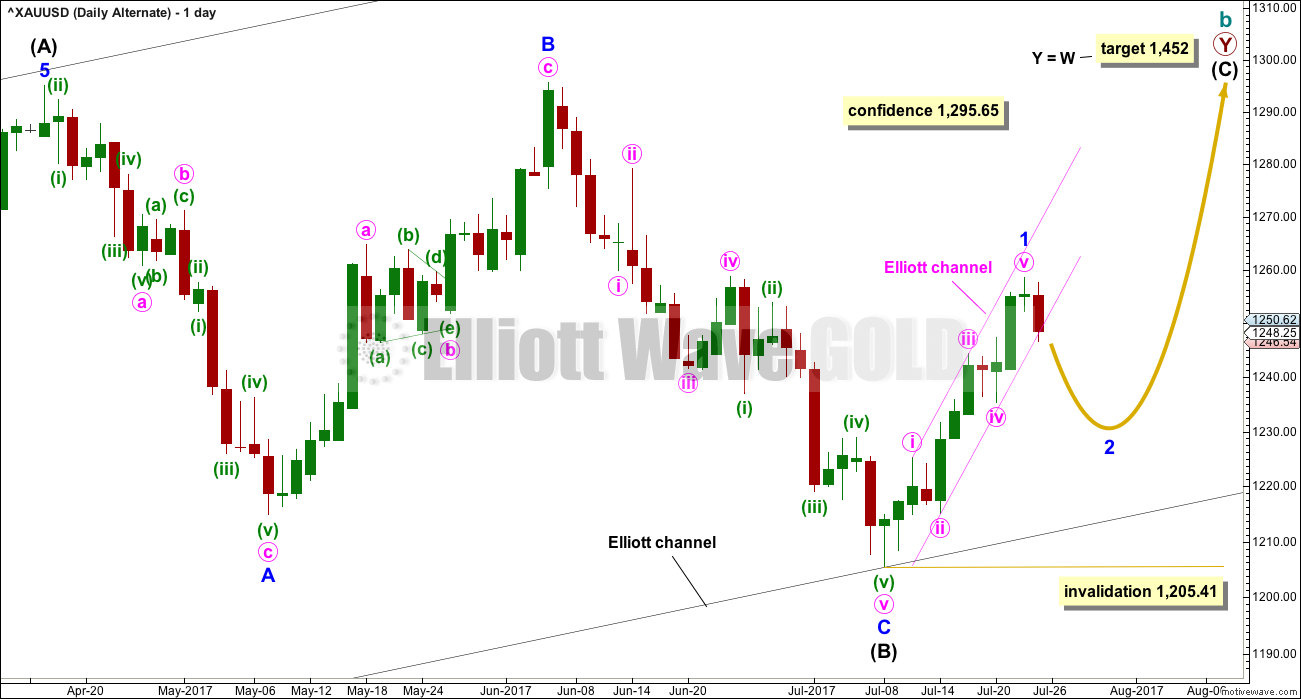
Within intermediate wave (C), no second wave correction may move beyond the start of its first wave below 1,205.41.
DAILY CHART
Intermediate wave (C) may be unfolding as an impulse.
With a five up now complete and downwards movement breaking below the lower edge of the pink Elliott channel, it looks like at the daily chart level minor wave 1 may have ended at the last high and downwards movement may be a correction to follow it for minor wave 2.
Minor wave 2 may not move beyond the start of minor wave 1 below 1,205.41.
HOURLY CHART
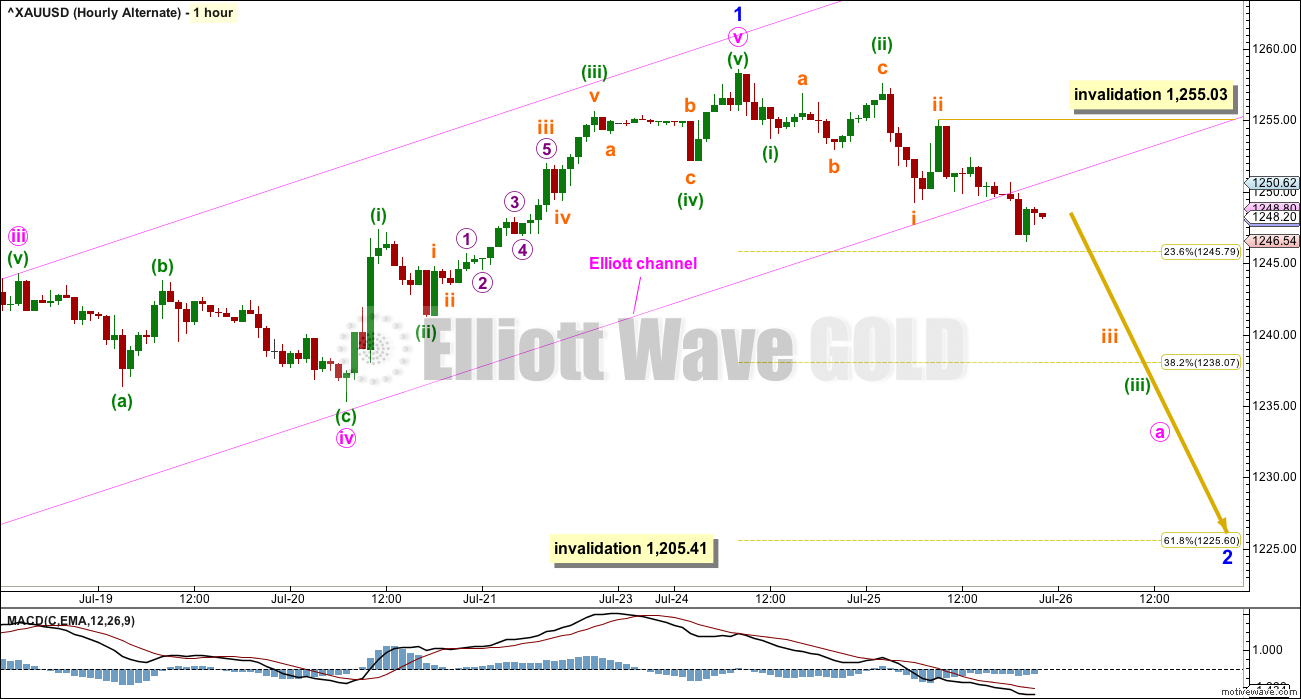
Subdivisions for this alternate hourly chart are the same as the second hourly chart for the main wave count. A-B-C of a zigzag subdivides exactly the same as 1-2-3 of an impulse.
If minor wave 1 was over as a five wave impulse at the last high, then downwards movement may be minor wave 2. The most likely point for it to end would be the 0.618 Fibonacci ratio of minor wave 1 about 1,226.
Minor wave 2 would most likely subdivide as a single or multiple zigzag. A movement at minor degree should begin with a five down at the hourly chart level, which at this stage is incomplete.
TECHNICAL ANALYSIS
WEEKLY CHART
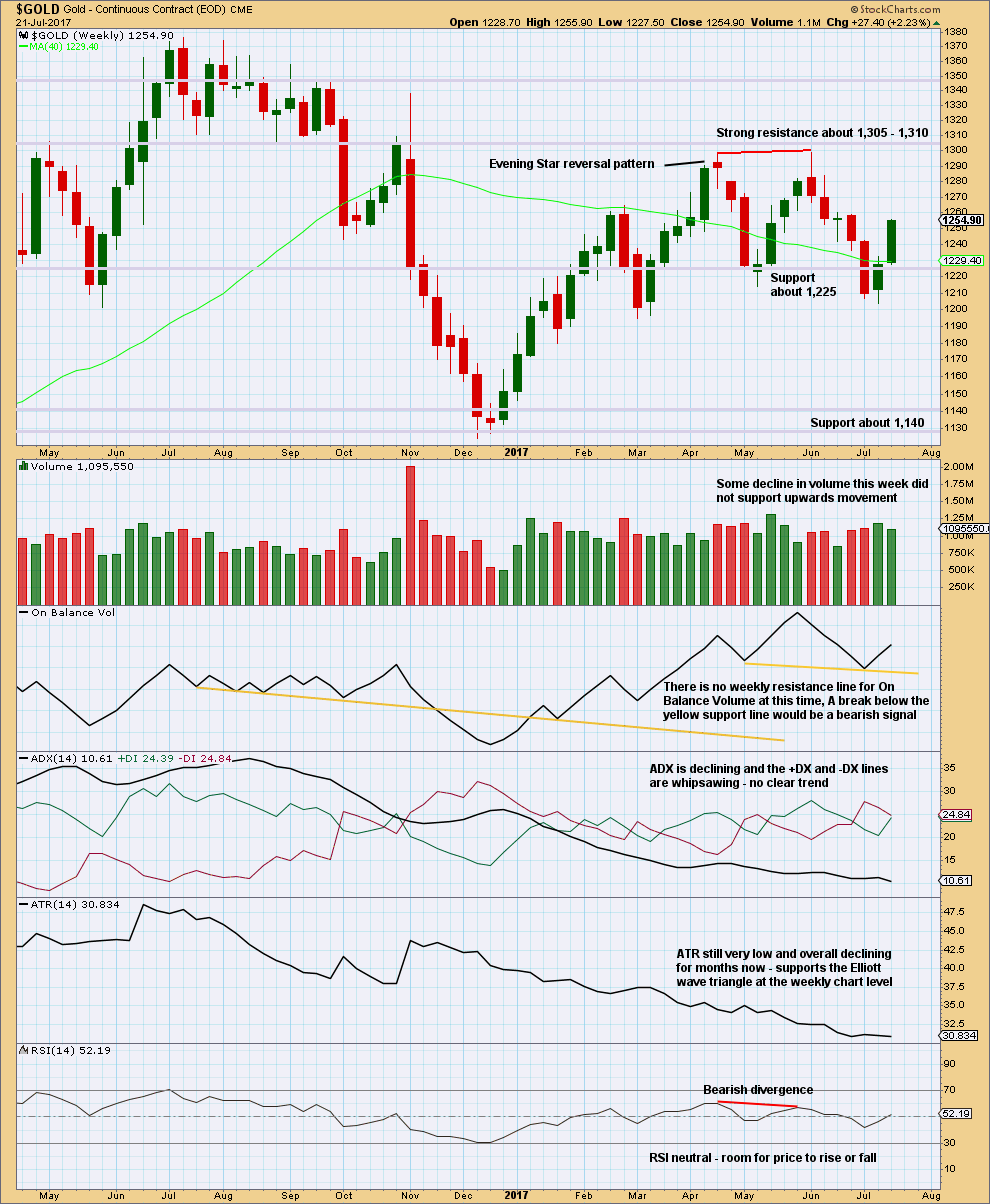
Click chart to enlarge. Chart courtesy of StockCharts.com.
A lack of support for upwards movement from volume favours the main Elliott wave count.
ADX and ATR favour the main Elliott wave count.
DAILY CHART
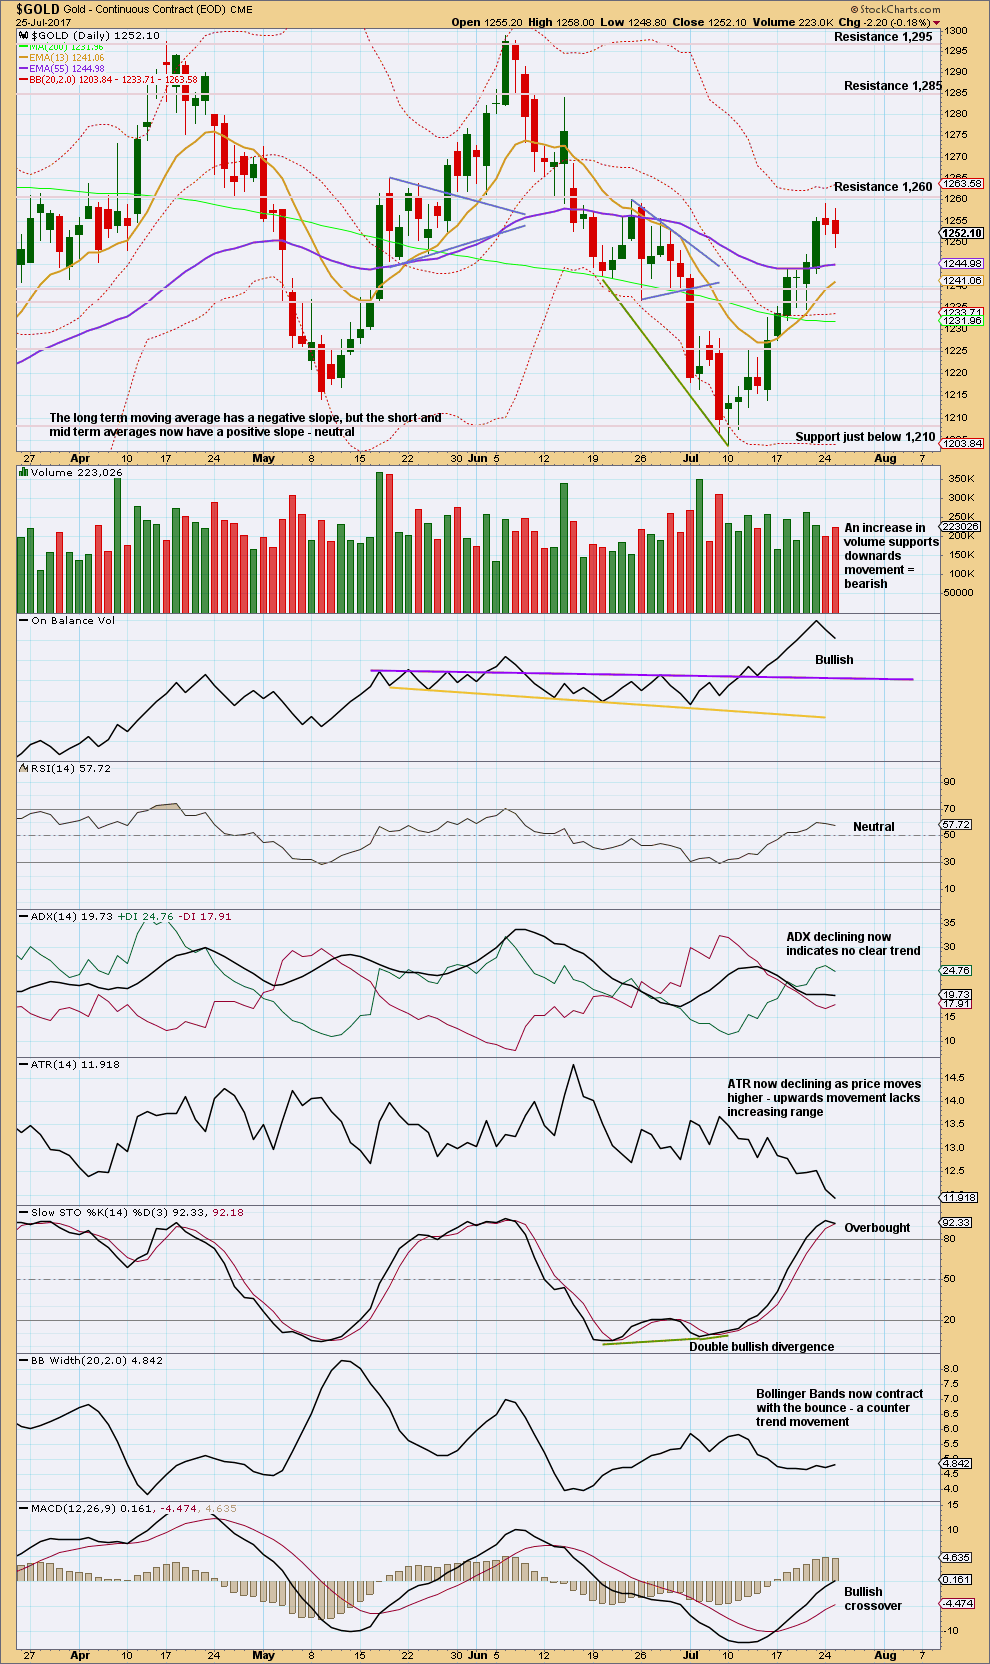
Click chart to enlarge. Chart courtesy of StockCharts.com.
Two small range days look so far like a correction within this upwards bounce and not yet the start of a new downwards trend. There is no candlestick reversal pattern at the last high.
An increase in volume today indicates this pullback is less likely to be over; another red daily candlestick looks most likely here. This fits the second hourly chart for the main wave count, and also fits the alternate wave count.
ATR and Bollinger Bands still support the main Elliott wave count.
GDX
DAILY CHART
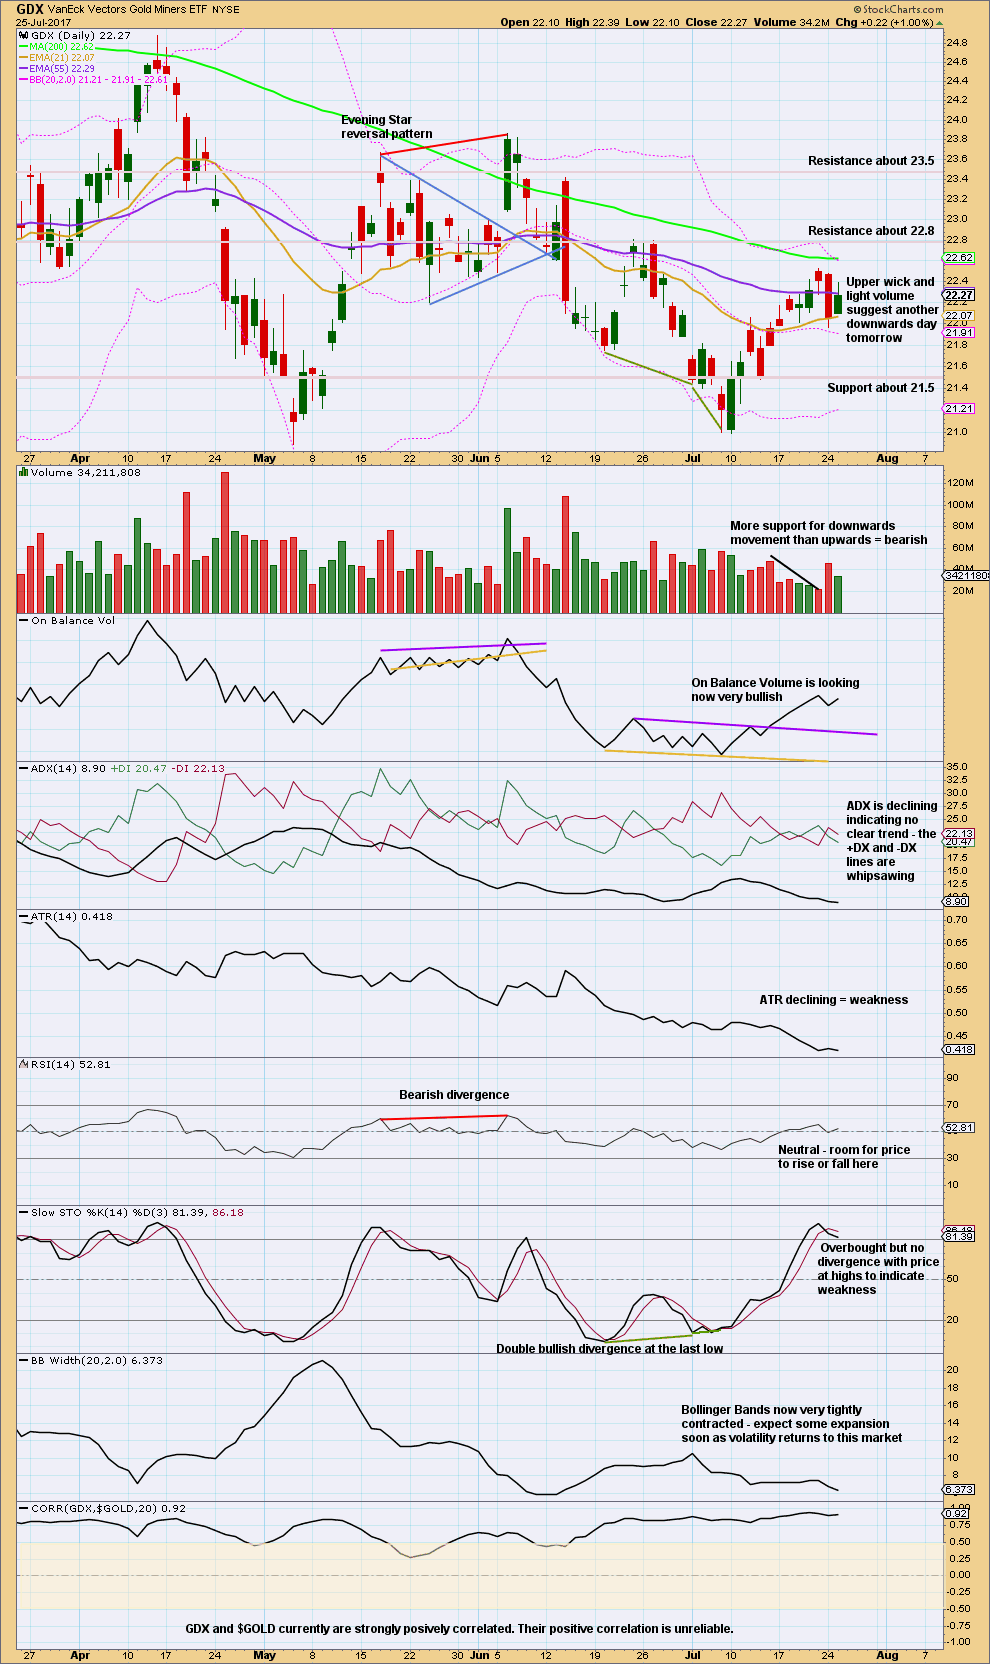
Click chart to enlarge. Chart courtesy of StockCharts.com.
GDX also looks bearish for the short term.
Be aware that the correlation between GDX and Gold is unreliable. Although they are currently strongly positively correlated, their past behaviour absolutely shows that this correlation does not necessarily have to persist. In fact, we should assume that it may not and the correlation may be broken any day.
Published @ 11:33 p.m. EST.

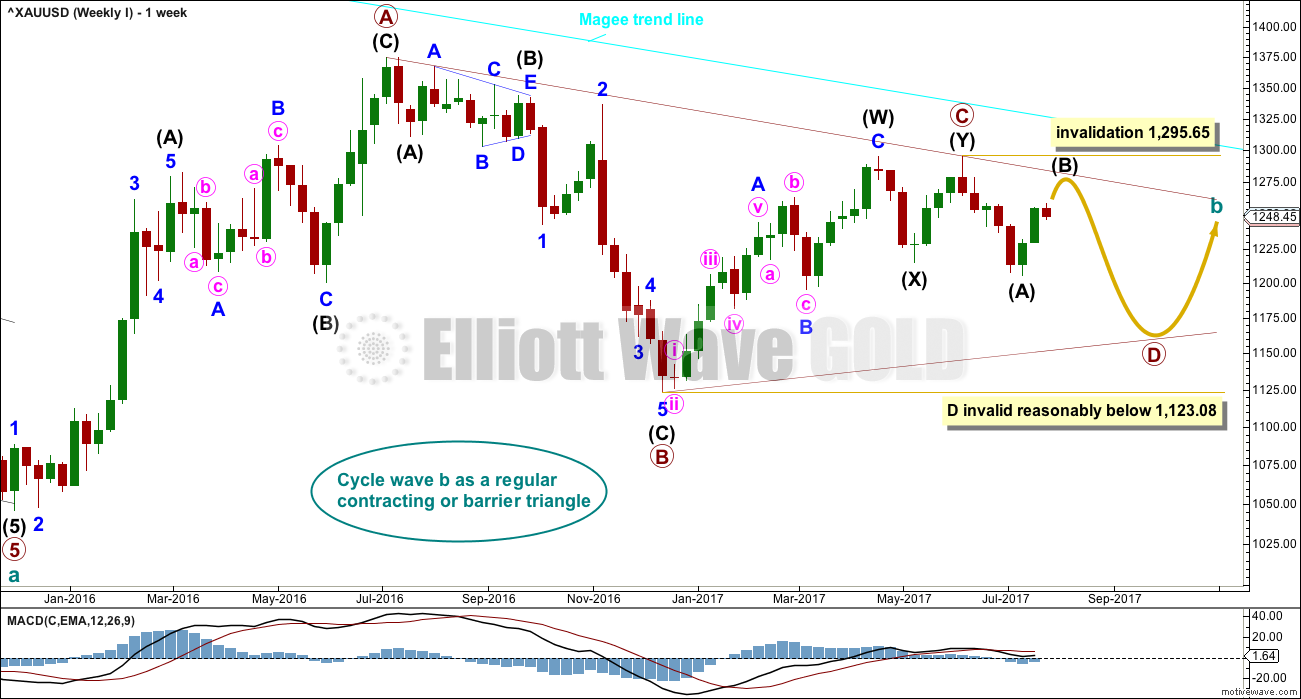
Minor B was quicker and more shallow than expected.
That’s B waves within B waves, and why I dislike them so much. Too much variety in structure and behaviour.
Updated hourly chart:
Minor B is over. Obviously. Minor C is now underway.
Minor C must subdivide as a five wave structure, most likely an impulse. There will be a pullback for minute ii coming up shortly.
1277 would be sweet. Took some profits today but I’ve kept half my remaining longs and will likely hold those overnight. I’ve been eyeing the 1275 area for a while but cannot hold all hoping we get there. We shall see. Some nice short covering action and removal of headwinds for the moment!
Isn’t that $14 upward thrust too big of a move for minutte i? Shouldnt that count as minutte iii and then we will be pulling back for iv?
Possibly. I need to look at the five minute chart first before I can answer that question. Will be addressed in todays analysis.
Another historic low for VIX; eclipsing the previous all time previous low of 8.89, with a new all time low today of 8.84.
Never in the recorded history of market sentiment, have we ever seen more intractable complacency than we have seen today, July, 26, 2017.
For the first time I find myself tempted to use margin… 🙂
Boo ya!
After the Fed announcement, GDX broke above the 22.53 key level that Dreamer had mapped out so it looks as if gold is going higher but how much higher??? The 1260 level has lots of resistance.
I guess the GDP figure to be released on Friday will be the catalyst to trigger gold’s move lower. The GDP figure is expected to be stronger… relative term.
I’ll place a similar post in the Oil page. Like Syed surmised, gold is a capricious market to trade. Oil might be a better bet.
==========================
US Oil Ichimoku Update
Data as at market close, July 25
==========================
Contrary to expectations, WTI crude oil price surged on Monday and Tuesday as the market celebrated the Saudi Arabia announcement of a production cut at the meeting of the OPEC and non-OPEC oil producers on Monday.
At Tuesday’s market close, oil prices had been trading above the 50-day SMA as well as the tenkan-sen and the kijun-sen. It had entered the cloud, almost touching the top cloud boundary at 47.03. Early this morning, oil prices did break above the top of the cloud boundary, changing the price trend from bearish to mildly bullish. At the same time, prices had broken above the higher line of the ascending broadening wedge pattern, invalidating the pattern. Now, the path is clear for a test of the purple downward sloping resistance line as well as the 200-day SMA at 49.52.
The price surge had been too far too fast, and a pullback would certainly be coming. Moreover, the red kumo provides a warning that it is not agreeable to the current price surge. Surely, prices would fall once they get rejected by either the purple downtrend resistance line or the 200-day SMA. And, if that were to occur, yours truly would be there to enter short, using the lower orange line as the initial support for the drop.
API Inventory: -10.2 million barrels.
Today’s EIA report, will likely miss
this number by a lot. (crude lower)
I have the same purple trendline as you, Alan.
If we push past this, then something else is happening besides the bearish scenario.
Vince, if oil price can break above the purple downtrend line and doesn’t look back, then it is possible that Primary 4 is not over yet. The low of 42.05 would be Intermediate B and there is a huge rise in Intermediate C targeting the 63-67 range. In that scenario, oil markets could still consolidate for a month or so before making the move higher. This is because the 50-day SMA is still lower than the 200-day SMA by about $3. At the moment I think this wave count is still lower in probability.
Yes, I’m with you. I’m not in the 42 meaningful low camp, yet. Because of exactly what you outlined – the 50 day is below the 200.
I do think this bounce had to happen. Just too many people coming out calling a bear market in oil at 42.
It does make one smile that traders pay any attention to jawboning from Saudi propagandists. I guess those of us bearish on oil should thank them! 🙂
Gold Ichimoku Daily Analysis
Data as at 5:40 am ET, July 26
=========================
Gold prices fell during the trading day on Tuesday. The fall seemed too deep to be a fourth wave, which means that the top is already in place much earlier than expected, at 1258.59. Moreover, at the daily level, gold prices were rejected by the cloud, sending them southwards. The daily trend remains bearish as long as prices are below the kumo. Having pulled back towards 1245, the 1235-1237 region suddenly becomes critical. If this level is broken we should expect a move at least towards 1226. But, if this level holds, then buyers may flock into the market for another leg higher towards 1275-1280.
The 4-Hour Ichimoku Chart shows that gold prices had dropped below both the tenkan-sen and the kijun-sen, and more importantly the bottom gold channel. Momentum remains positive as the MACD histogram prints in the black with an upward trajectory which points to higher prices. Ichimoku still presents a bullish picture: the kumo is still green, and the tenkan-sen still lies above the kijun-sen and both are trading above the cloud. A backtest of the gold channel can still happen. Whether the gold price can assert itself and return inside the channel, or whether the backtest fails leading to a further drop in prices, remains to be seen. With today being FOMC Statement day, it is very likely that we will see a significant amount of volatility in this market. As a result, I am very careful about getting involved until after the reaction is known. Although the market has recently been favouring the upside, the Federal Reserve could be very hawkish, and this could turn the gold market bearish at the drop of the hat. Conversely, a dovish stance could send gold soaring.
I believe that the safest way to trade this market today is to wait for the daily close, to see where we are. If we break down below the 1240 level, and more notably, the cloud top boundary at 1235, I think the market will probably continue to drift lower. But, if we break out above the 1260 level, I believe the market will continue to rise towards the 1300 level. However, the FOMC can change all that in the blink of an eye, so I’m not prepared to put money to work in the short term as it is simply gambling and taking a guess as to where the market could end up next.
Not very flattering trading Gold. The powers that be seem to be tossing gold price around like a cotton ball between the moving averages with the bands limiting the rise & fall. Directionless range bound; test of patience (and skill) to keep switching from long to short and vice versa lol… well if there is money to be made playing musical chairs, so be it!
You always have very interesting comments. I like your comments and more often they are correct.
Thanks.
Enjoy sir, as long as you can avoid getting trapped by the bulls or bears lol….. upside move to watch out for today, if it can get to & past 1250-52! GL…. 🙂
Updated daily chart:
Intermediate (B) is still an incomplete zigzag. Minor A was over as a five wave impulse at the last high, now minor B moves lower.
It’s pretty common for B waves to correct back down to the 0.382 or 0.236 Fibonacci ratio, then wave C moves higher to the 0.618 Fibonacci ratio.
1,239 is 0.618 of intermediate (A), and 1,238 is 0.382 of minor A. So 1,238 – 1,239 would be a reasonable target for minor B.
Or…
1,226 is both 0.236 of intermediate (A) and 0.618 of minor A. The second target for minor B.
1,244.28 has fallen, goodbye bullish count!
Agreed. Hourly 2 in play. Barchart low so far = 1,244.01
Well, I was just popping in tonight to make that comment, but you guys have beaten me to it 🙂
So I’ll be focussed on the strength or weakness of this wave down over the next one to few days.
If we see real weakness it could be wave B within wave B… the second hourly chart.
It’s really hard to tell how long it may last. It could be over relatively quickly, or it could meander sideways for a week. There is such a huge variation within B waves, and B waves within B waves are the worst.
Any contrarians out there watching the VIX? Spiked to a low of 9.04 today before recovering.
A 2 year descending wedge appears to be in play with likely resolution within the next month.
Lara may be able to confirm this based on her SPX count.
https://www.tradingview.com/x/v5JCMjBR/
Remarkable and historic price action in VIX. Today was its eight consecutive close below 10 for the first time ever! This morning’s low of 9.04 took out a multi decade low of 9.31 set back in December 22, 1993. A hammer with price divergence with equities is one of my favorite triggers and you don’t see it very often. I am holding my biggest long vol positiion since I started trading.
I figured you would be watching the VIX. GL
I’m expecting a primary degree correction to begin in the S&P shortly.
For now, the trend is up. But a big correction is waiting in the wings… maybe quite close now. The structure is very close to completion.
Lara’s analysis is an option trader’s Nirvana. We like to get positioned slightly ahead of the actual trend change to take advantage of low premiums. They don’t get any lower than they did just recrecently. Lol!
Lara, you may have missed this from yesterday. Thanks,
Dreamer
July 24, 2017 at 10:51 pm
Lara, thanks for the feedback on EWI counts.
A question on triangle sub waves:
You stated “Four of the five sub-waves of a triangle must be zigzags or zigzag multiples. One sub-wave may therefore be a different type of A-B-C correction, such as a flat correction.”
Does that mean that a zigzag multiple, i.e. “double zigzag” may count as the one complex wave, but it doesn’t have to.
And can you have more than one sub wave be a double zigzag?
Would the following scenario meet the rules?
Triangle sub waves:
______________________________________
A: Zigzag
B: Double zigzag
C: Triangle or Flat
D: Double zigzag
E: Zigzag
Thanks,
I’m so sorry Dreamer. I did see it… then got immersed in getting the analysis published first.
Thank you for your patience.
No, that scenario would not meet the rules.
The rules are:
“Contracting Triangles.
Rules:
1. Appear in a position of a fourth wave, B wave or within a combination.
2. Wave C may not move beyond the end of wave A, wave D may not move beyond the end of wave B, and wave E may not move beyond the end of wave C.
3. All the sub waves must subdivide into corrective structures.
4. Four of the five sub waves must subdivide into zigzags.
5. One of the sub waves should subdivide into a multiple zigzag or a triangle.
6. The triangle trend lines converge.”
Thanks,