
The target for more upwards movement was 1,277, but it has not been met yet. Price did make a slight new high.
Summary: It looks likely that a high may be in place. Have some confidence in this view if the blue channel is breached, and then more confidence if price makes a new low below 1,244.01.
The target for the next wave down is at 1,174.
Always use a stop. Invest only 1-5% of equity on any one trade.
New updates to this analysis are in bold.
Last monthly charts and alternate weekly charts are here, video is here.
Grand SuperCycle analysis is here.
MAIN ELLIOTT WAVE COUNT
WEEKLY CHART
Click chart to enlarge.
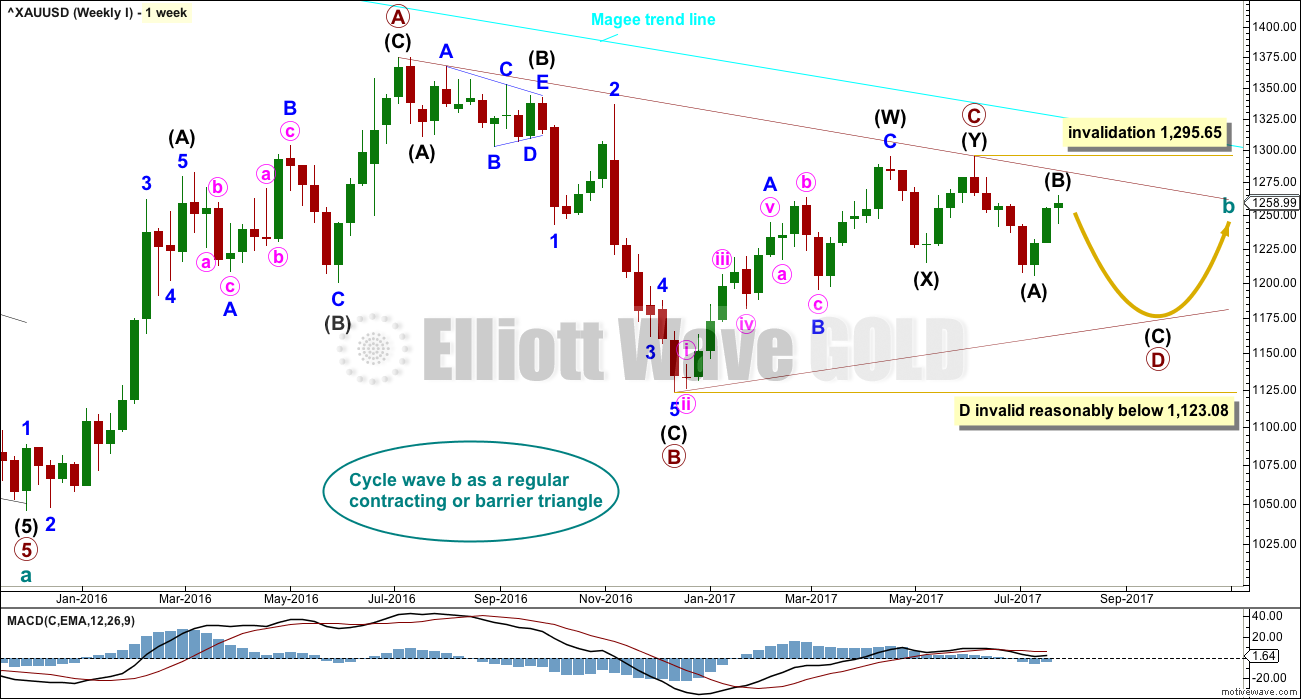
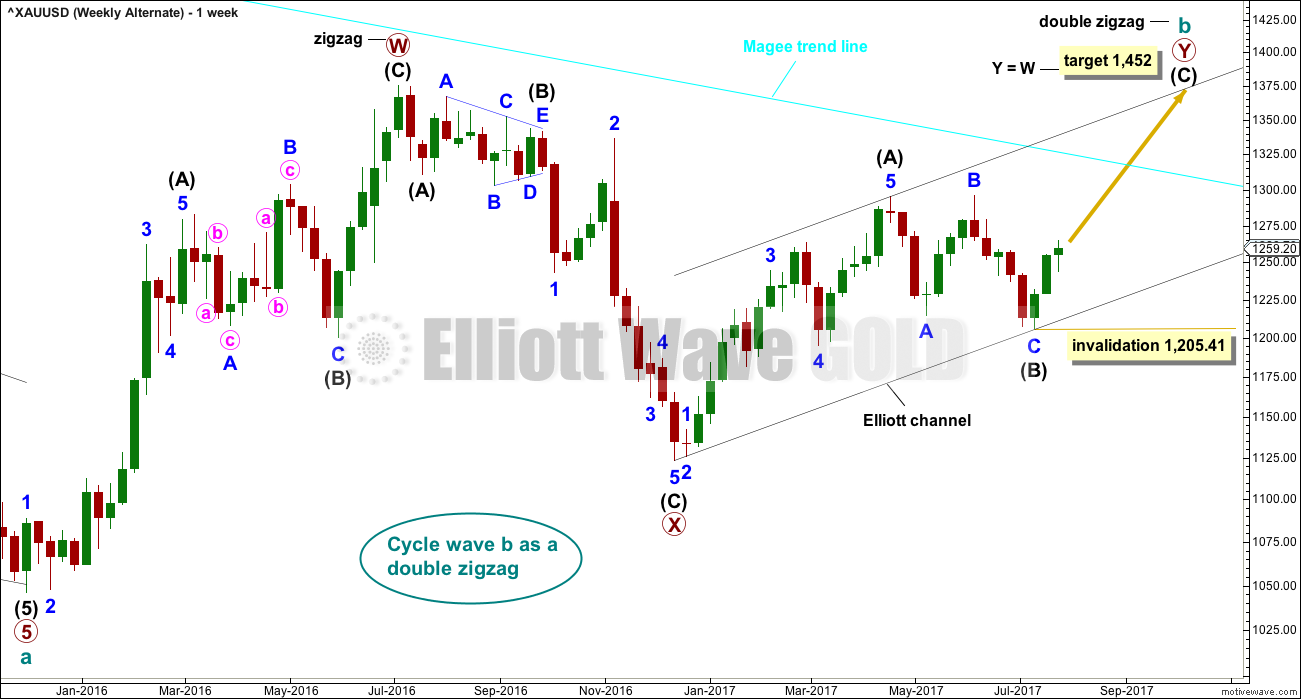
The Magee bear market trend line is added to the weekly charts. This cyan line is drawn from the all time high for Gold on the 6th of September, 2011, to the first major swing high within the following bear market on the 5th of October, 2012. This line should provide strong resistance.
At this stage, a triangle still looks possible and has the best fit for cycle wave b. It has some support from declining ATR and MACD now beginning to hover about zero.
Within a triangle, one sub-wave should be a more complicated multiple, which may be primary wave C. This is the most common sub-wave of the triangle to subdivide into a multiple.
Primary wave D of a contracting triangle may not move beyond the end of primary wave B below 1,123.08. Contracting triangles are the most common variety.
Primary wave D of a barrier triangle should end about the same level as primary wave B at 1,123.08, so that the B-D trend line remains essentially flat. This involves some subjectivity; price may move slightly below 1,123.08 and the triangle wave count may remain valid. This is the only Elliott wave rule which is not black and white.
Triangles normally adhere very well to their trend lines. So far the A-C trend line has been tested 11 times; this line has very strong technical significance. If this wave count is correct, then intermediate wave (B) should find very strong resistance if it gets up to the A-C trend line. A small overshoot is acceptable. A breach is not. If price reaches up to that trend line in the next one to few days, it would offer a good entry point for a short position. Stops then may be set a little above the line, or just above the invalidation point.
Finally, primary wave E of a contracting or barrier triangle may not move beyond the end of primary wave C above 1,295.65. Primary wave E would most likely fall short of the A-C trend line. But if it does not end there, then it can slightly overshoot that trend line.
Primary wave A lasted 31 weeks, primary wave B lasted 23 weeks, and primary wave C may have been complete in 25 weeks.
Primary wave D should now be expected to last a Fibonacci 13 or 21 weeks in total.
DAILY CHART
Click chart to enlarge.
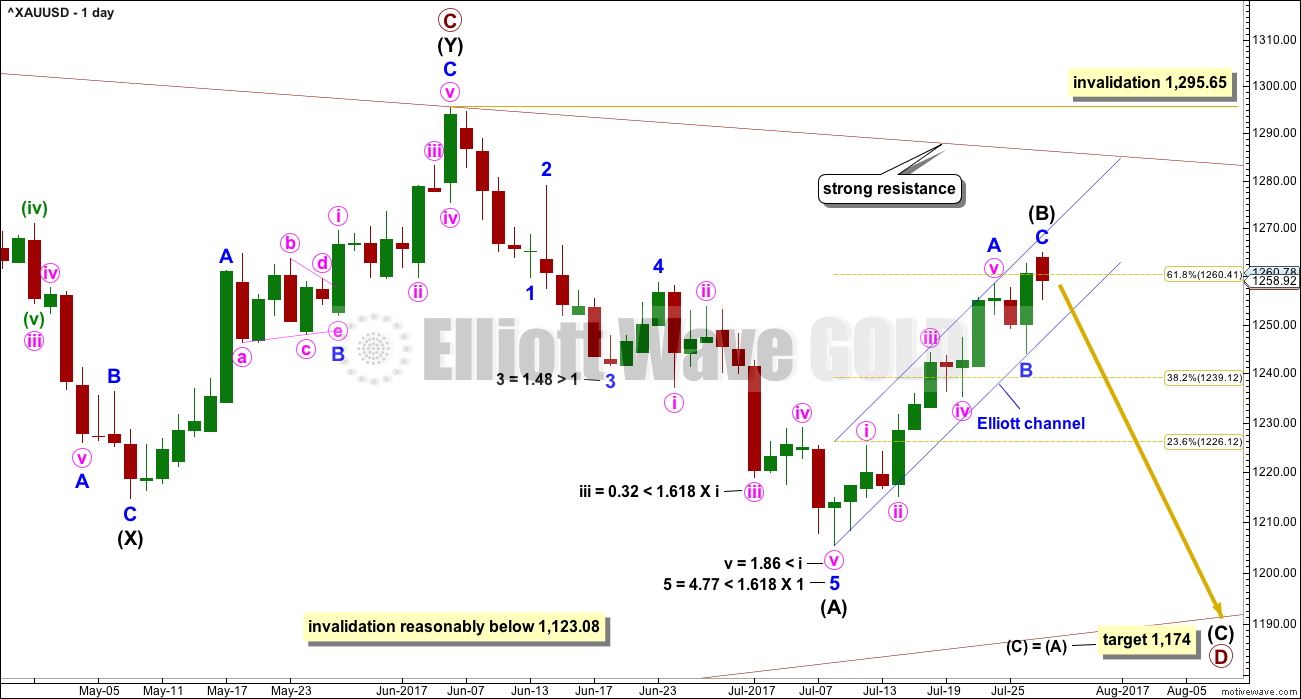
A common range for triangle sub-waves is from about 0.8 to 0.85 the prior sub-wave, this gives a range for primary wave D from 1,158 to 1,149. The target calculated today is reasonably above this range, but would still see the B-D trend line of the triangle have a reasonable slope. If the target at 1,174 is wrong, it may not be quite low enough.
At this stage, to try and see the whole of primary wave D complete at last week’s low does not look right. The B-D trend line would be too steep for a normal looking contracting Elliott wave triangle, and primary wave D would have been far too brief at only 5 weeks duration. For the wave count to have the right look and good proportions (as Gold almost always does), primary wave D should not be labelled over yet.
If primary wave C is correctly labelled as a double zigzag, then primary wave D must be a simple A-B-C structure and would most likely be a zigzag.
With intermediate wave (A) complete and now intermediate wave (B) a large and deep correction, primary wave D is beginning to look very typically like a large exaggerated zigzag.
Intermediate wave (B) looks to be unfolding as a zigzag, a three wave structure. Corrective waves have a count of 3, 7, 11, 15 etc. Each extension adds another 4. So far intermediate wave (B) has a count of 7 on the daily chart, so it may now possibly be complete.
Draw an Elliott channel about the zigzag of intermediate wave (B). Use this as a guide to when it may be over. When price breaks below the lower edge, that may be taken as an indication of a trend change.
So far intermediate wave (B) has lasted 13 days. If it exhibits a Fibonacci duration, then it may be over at today’s high. It is reasonably common for Gold’s waves to exhibit Fibonacci durations, but this does not always happen.
Within the zigzag of primary wave D, intermediate wave (B) may not move beyond the start of intermediate wave (A) above 1,295.65.
HOURLY CHART
Click chart to enlarge.
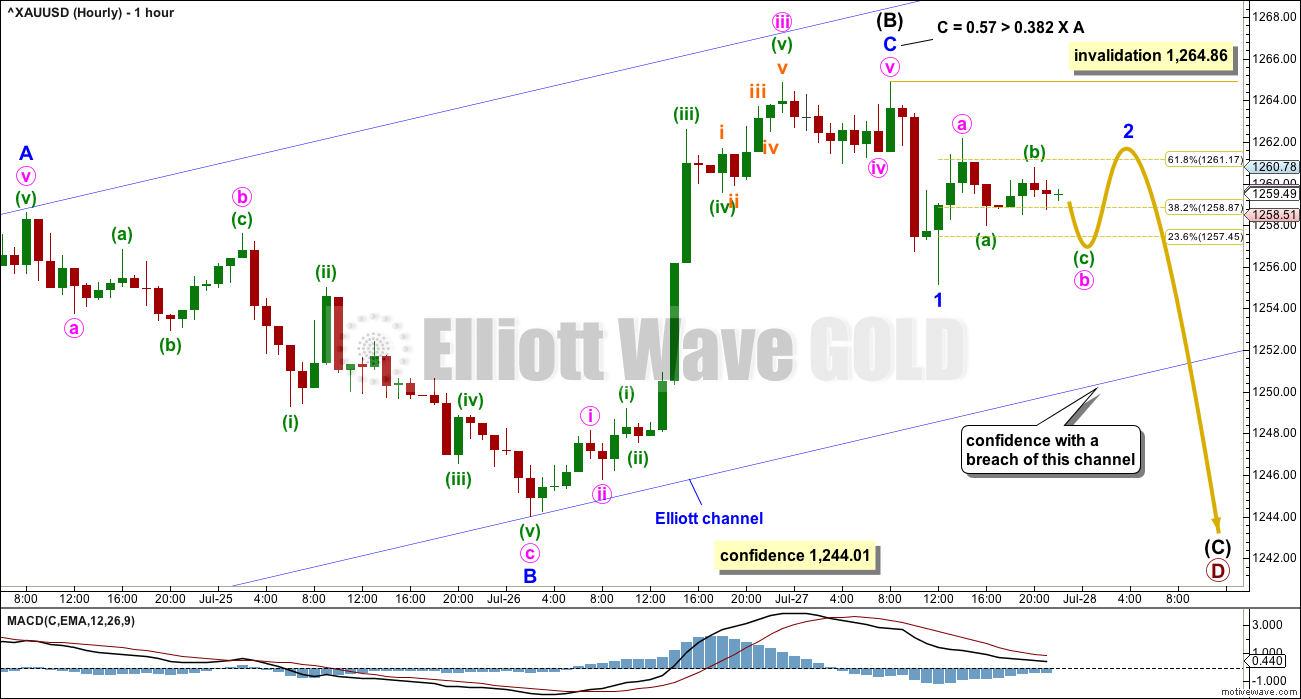
If intermediate wave (B) is over at today’s high, it would exhibit a very close Fibonacci ratio within it between minor waves A and C. The duration would be a Fibonacci number, 13. Minor wave C would end very close to the upper edge of the blue Elliott channel. The structure would look complete at both the hourly and daily chart levels.
Intermediate wave (C) should begin with a very clear five down at the hourly chart level. That is not yet complete. At the five minute chart level, the small wave down here labelled minor wave 1 subdivides perfectly as a five wave impulse.
The following correction for minor wave 2 may not move beyond the start of minor wave 1 above 1,264.86. Minor wave 2 may be very deep; the very first second wave correction within Gold’s new trends is often very deep.
If price breaks below the lower edge of the blue Elliott channel, that would offer reasonable confidence to this wave count. If that happens, then look for price to rebound and back test resistance at the channel, before moving down and away. That may offer a good entry point to join the downwards trend.
A new low below 1,244.01 would invalidate the second hourly chart below and provide reasonable confidence in this wave count.
SECOND HOURLY CHART
Click chart to enlarge.
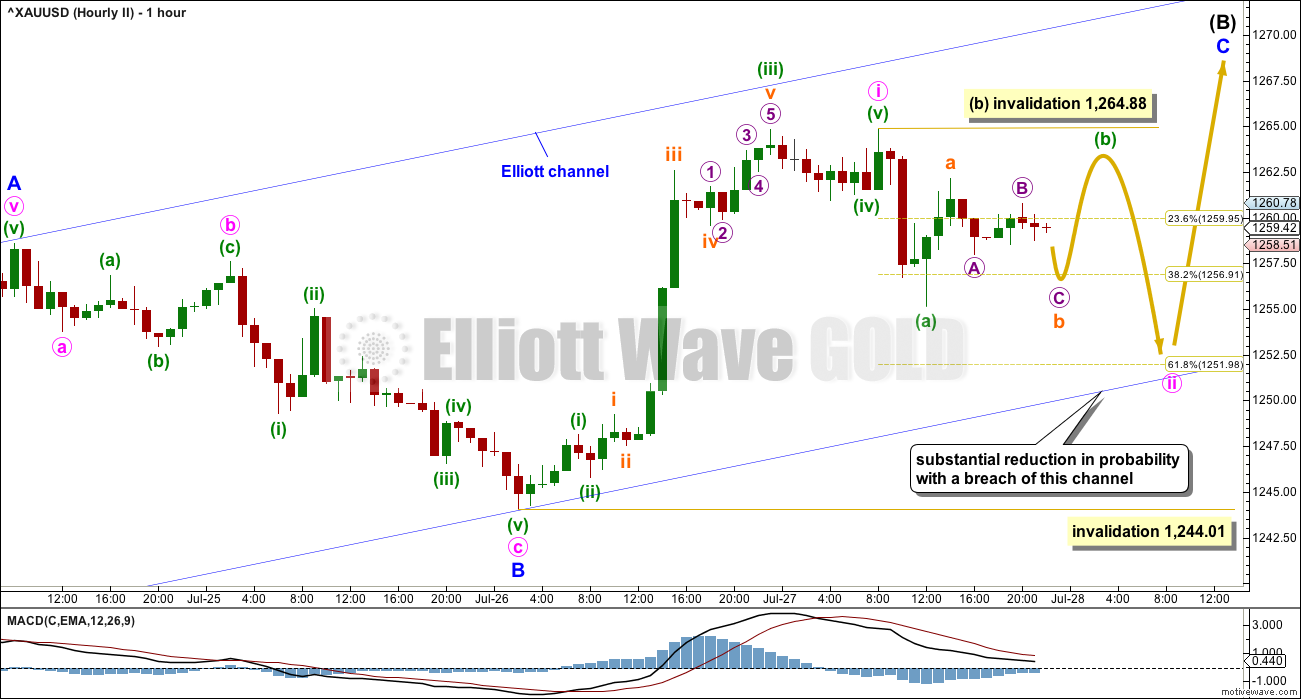
The easiest alternate idea is always a change in the degree of labelling for the last wave. If the upwards wave to today’s high is moved down one degree, this may be only minute wave i within a five wave impulse for minor wave C.
If only minute wave i is complete, then minor wave C may move higher over the next few days.
Within minor wave C, minute wave ii may not move beyond the start of minute wave i below 1,244.01. However, before this price point is passed this wave count would very substantially reduce in probability if price breaks below the lower edge of the blue Elliott channel. Zigzags normally adhere reasonably well to their steep channels. A breach of this channel would indicate the zigzag is most likely over.
ALTERNATE ELLIOTT WAVE COUNT
WEEKLY CHART
Click chart to enlarge.
This wave count has been published only in historical analysis. At this stage, it will be published on a daily basis.
There are more than 23 possible corrective structures that B waves may take, and although cycle wave b fits best at this stage as a triangle (main wave count), it may still be another structure. This wave count looks at the possibility that it may be a double zigzag.
If cycle wave b is a double zigzag, then current upwards movement may be part of the second zigzag in the double, labelled primary wave Y.
The biggest problem with this wave count is the structure of intermediate wave (A) within primary wave Y. This upwards wave looks very much like a three and not a five. This upwards wave must be seen as a five for this wave count to work.
Within the second zigzag of primary wave Y, intermediate wave (B) is a completed regular flat correction. Minor wave C ends just slightly below the end of minor wave A avoiding a truncation. There is no Fibonacci ratio between minor waves A and C.
The target remains the same as previously published for this wave count.
Along the way up, some resistance should be expected at the cyan Magee trend line.
Within intermediate wave (C), no second wave correction may move beyond the start of its first wave below 1,205.41.
DAILY CHART
Click chart to enlarge.
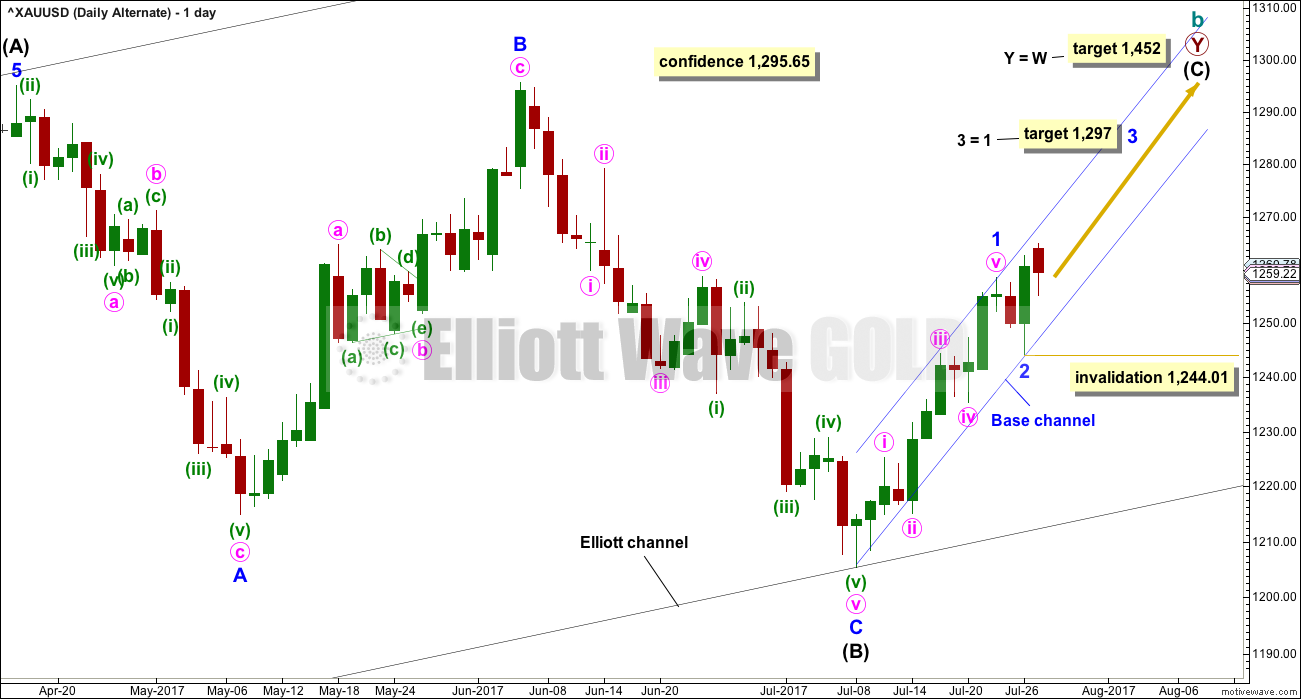
Intermediate wave (C) may be unfolding as an impulse.
Minor wave 2 may be over as a very quick and shallow zigzag.
Because minor wave 1 was a long extension, the target for minor wave 3 is for equality with minor wave 1.
Within minor wave 3, no second wave correction may move beyond the start of its first wave below 1,244.01.
HOURLY CHART
Click chart to enlarge.
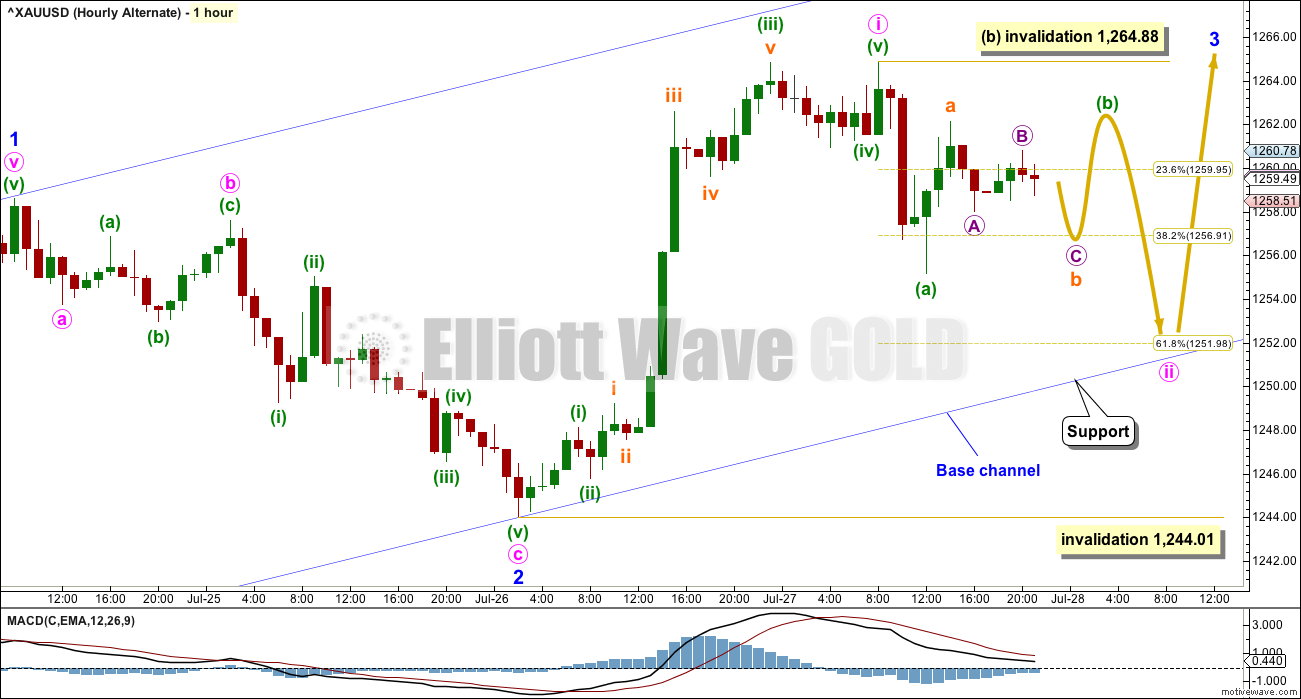
If minor wave 3 for this alternate is to be an extension reaching equality with minor wave 1, then its subdivisions may show up on the daily chart like those for minor wave 1 do.
Minute wave i may now be complete and minute wave ii so far is showing up on the daily chart as a red daily candlestick.
Minute wave ii should find strong support at the lower edge of the blue base channel. A breach of that channel would put significant doubt on this alternate wave count. Lower degree second wave corrections very rarely breach base channels drawn about first and second waves one or more degrees higher.
Minute wave ii may not move beyond the start of minute wave i below 1,244.01.
TECHNICAL ANALYSIS
WEEKLY CHART
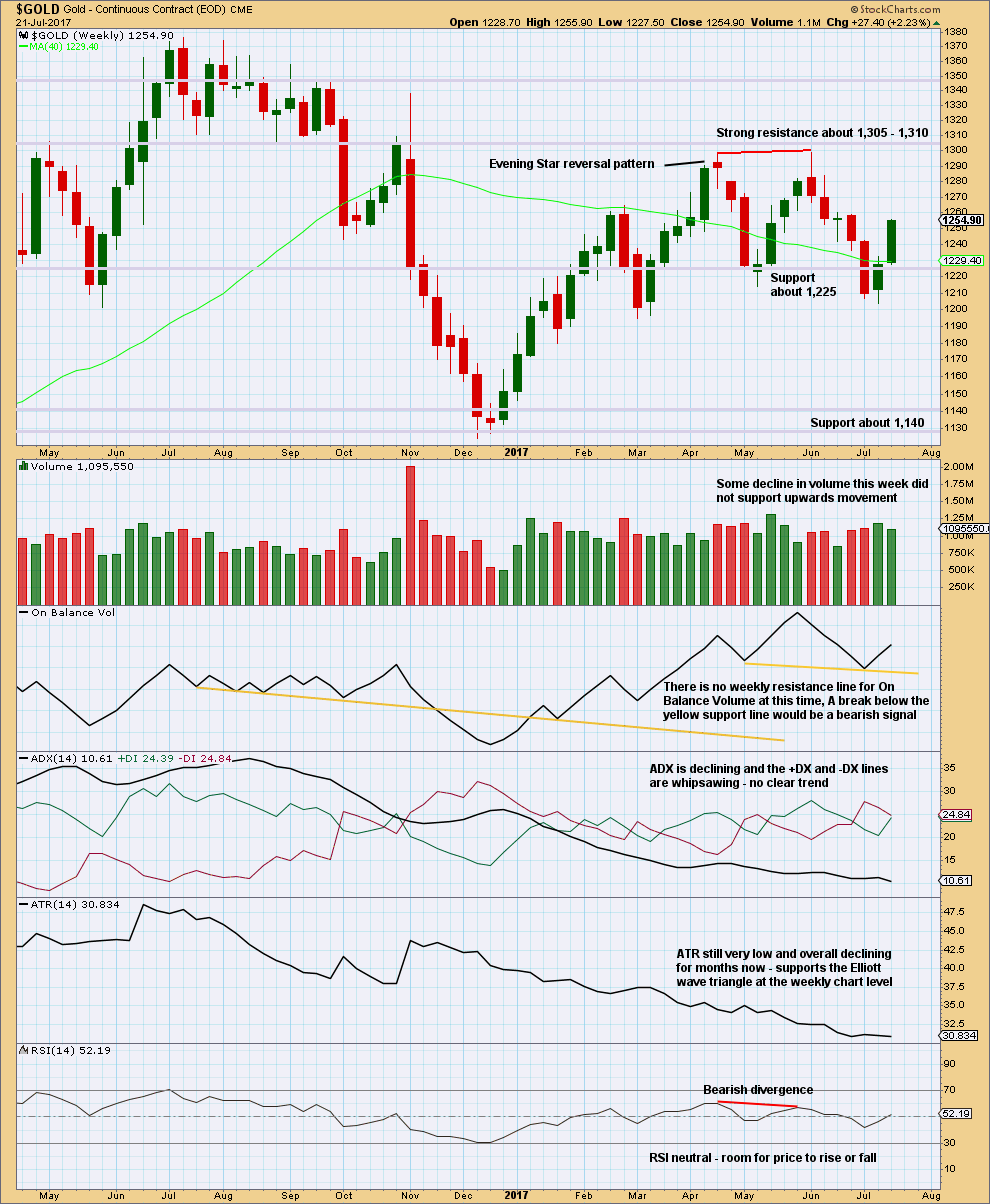
Click chart to enlarge. Chart courtesy of StockCharts.com.
A lack of support for upwards movement from volume favours the main Elliott wave count.
ADX and ATR favour the main Elliott wave count.
DAILY CHART
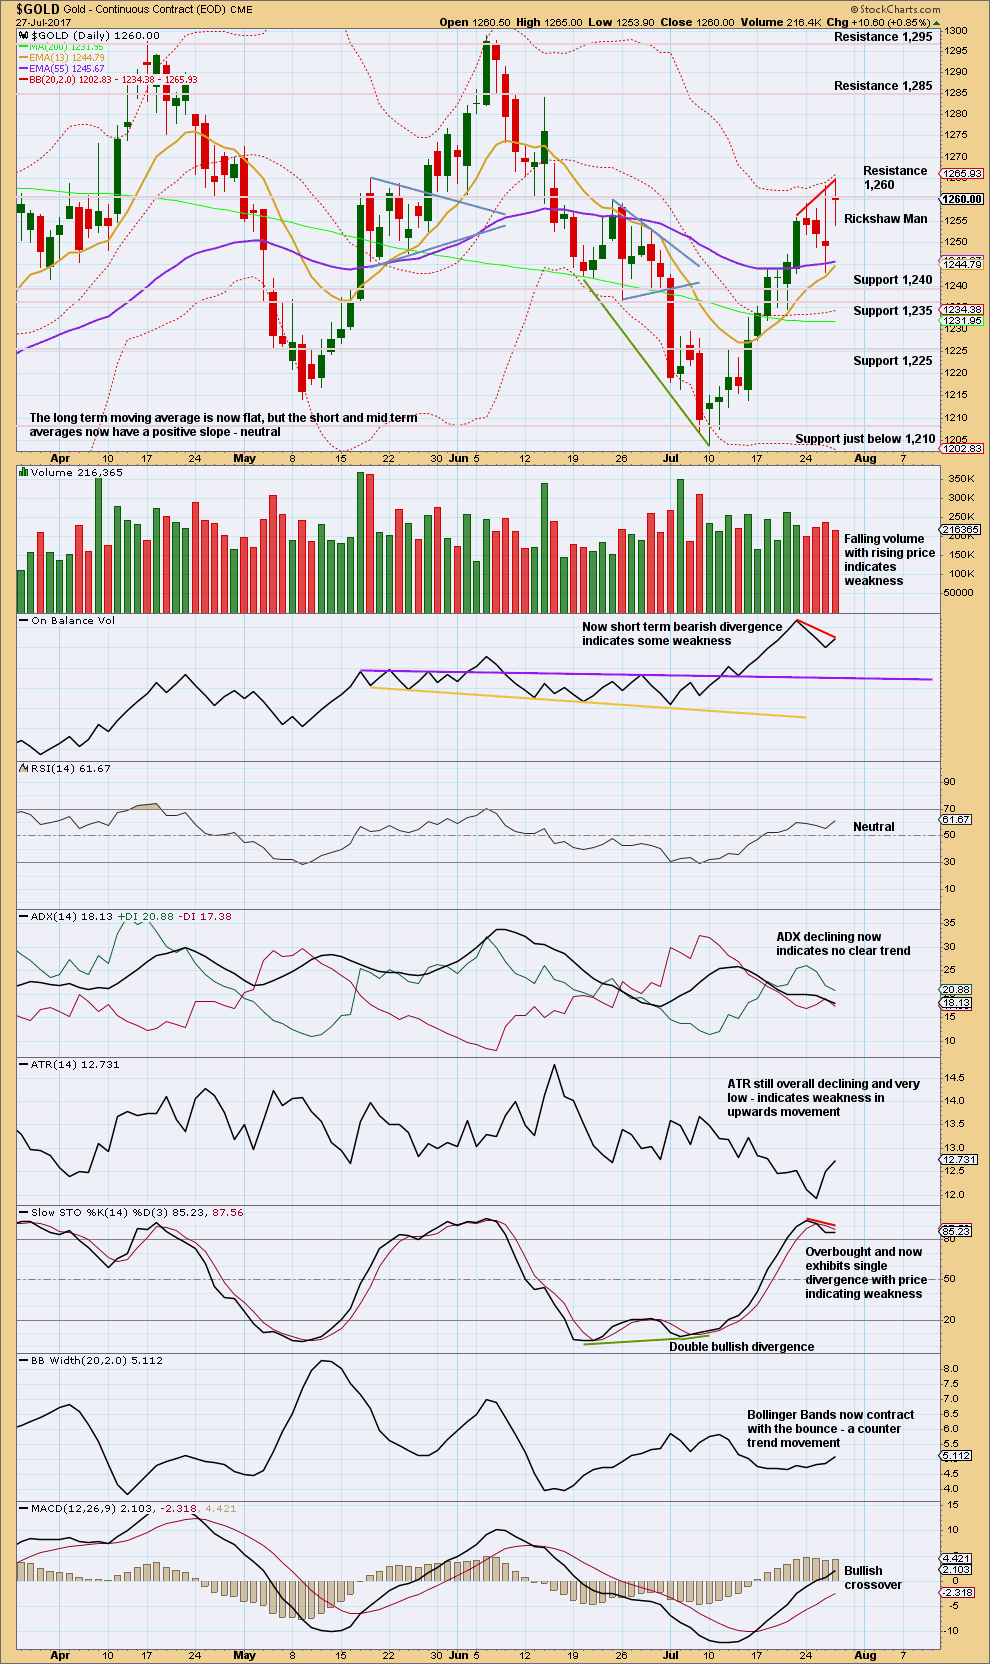
Click chart to enlarge. Chart courtesy of StockCharts.com.
The Rickshaw Man is a special variety of a doji candlestick. This puts the trend from up to neutral; it indicates a tired market. This along with some decline in volume today, and divergence with price and On Balance Volume and Stochastics, offers support to the main Elliott wave count and the first hourly chart.
It looks like a high may be in place today, but reasonable confidence may only come with a breach of the channel on the Elliott wave charts.
GDX
DAILY CHART
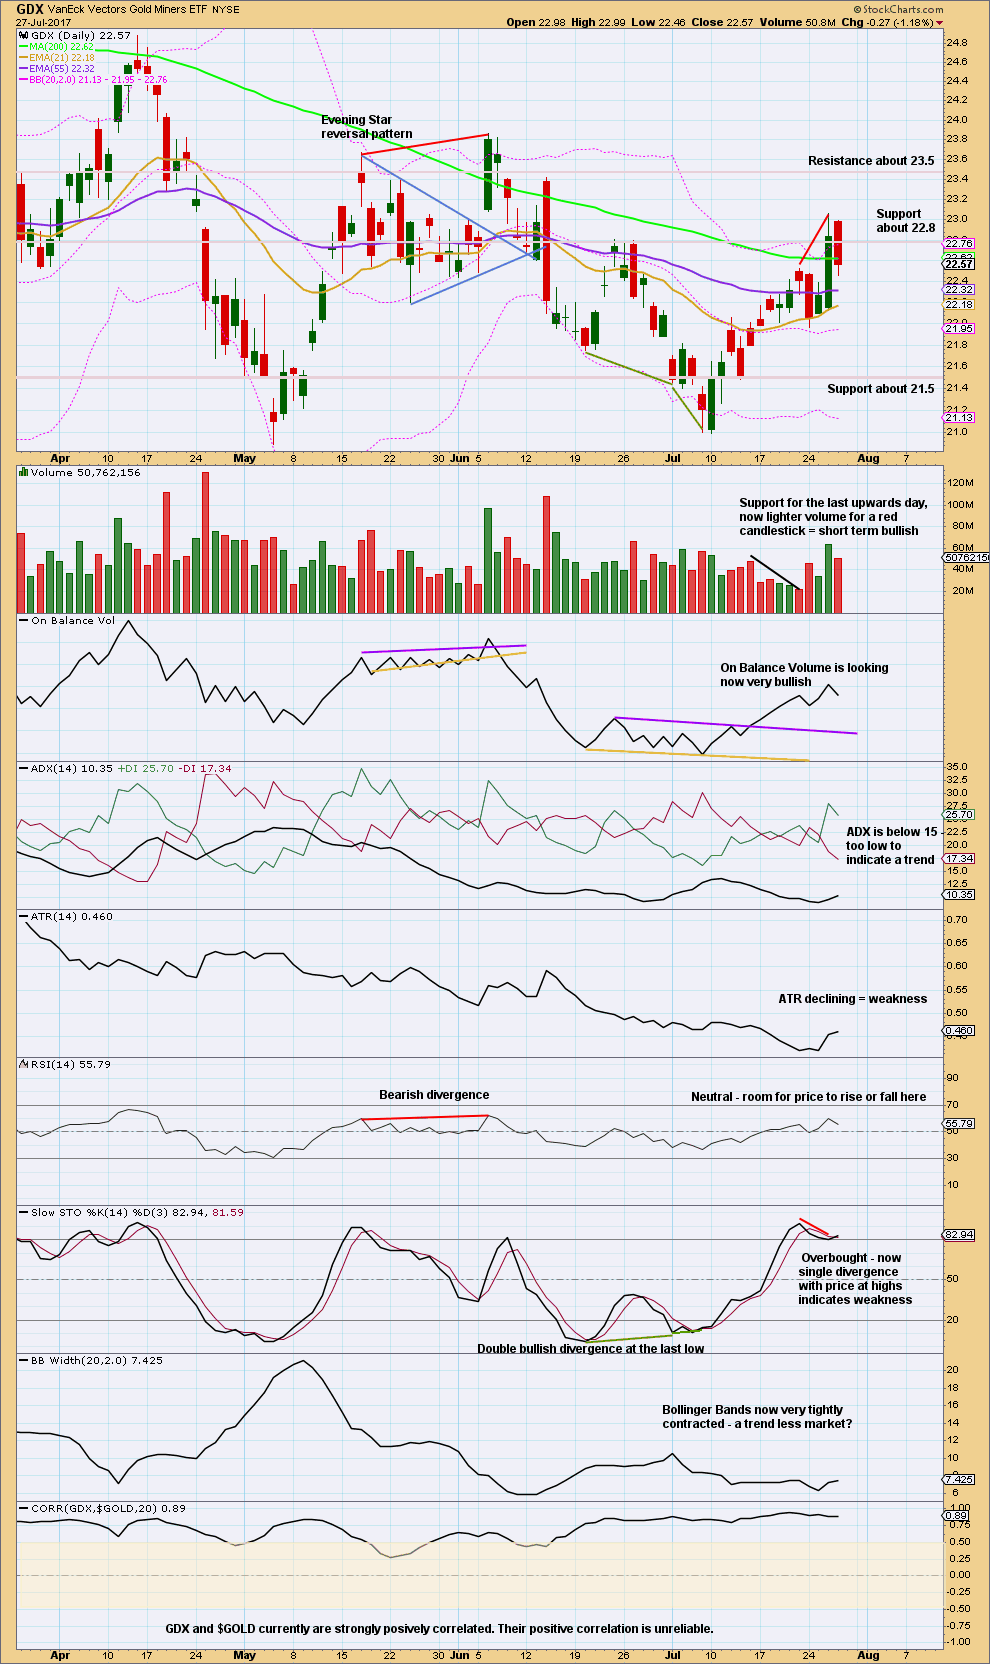
Click chart to enlarge. Chart courtesy of StockCharts.com.
While volume is bullish, Stochastics indicates some weakness within upwards movement. This may develop further before a high may be in place, or it may disappear.
There is room for more upwards movement; RSI is not yet overbought. Next resistance is about 23.50.
GDX is less bearish than Gold today. They may not turn together.
Published @ 11:47 p.m. EST.
Have put a couple of charts up and made comment on Oil.
It may be time to be flexible and switch from bear to bull, at least short term, there.
On tuesday the number of gold shorts was increased by 25k contracts by the commercials. Net longs reduced 5k. Since being reported on Tuesday gold went up 20 dollars from 1250 to 1270. On Tuesday July 18 gold was about 1240. So for a 10 dollar increase the bet that commercials made was pretty big. Now that gold went up 20 dollars more since Tuesday you can bet the commercials added more to their short position. We are close to a sizable correction, PENDING NO ESCALATION of North Korea or market collapses. Be careful adding longs at this juncture.
They certainly don’t make it easy! That was a sizable short covering by hedgies, and that was before the fed, as you noted. But there is still more room to run I think before a meaningful top. Holding some longs for next week, but it’s nerve racking and agreed it’s probably not the ideal place to add unless for a very short term trade and very tight stop
The original target at 1,277 is back.
My mistake yesterday was in expecting the correction down was not over, because when I looked at the downwards wave I have here labelled minute ii on the five minute chart it looked like a clear five wave impulse.
Minor C is continuing. The target would see intermediate wave (B) maybe come to end at the upper A-C trend line on the daily chart.
Gold Update
===========
The GDP figures did not disappoint. Gold prices rose through 1262 towards 1267-1270 as I had explained in my Daily post below. The scenario is exactly as defined by Dreamer, in the post right at the bottom of the page, a wave count which I had also considered.
I had also mentioned that a move through 1270 would propel gold to test the long-term downtrend resistance line near 1275-1280. This is the light purple line drawn in the long-term monthly chart. I’m sure there are thousands of traders watching that also; what we can see, others surely can do. Once that line is breached, I will go fully bull. Already there are talks of 1290-1300 as the first target for the bull which is expected to target the 1450s or 1550s, depending on whether you consider Primary Y wave to be 3 or 5 waves.
Another new high that does not fit any of the counts what now?
Time for a 2nd look at the ALT imo
Not yet.
Now with new high, low of yesterday may therfore have been an expanded flat minute 4, with c wave just under 2.618 lenth of wave a. Likely in final minute wave 5 up to test downtrend line around 1277 for big test. Will go short regardless at that point only to cover with convincing breach upwards of downtrend line above 1280.
Agree. That’s what my chart below shows. 🙂
Precisely so.
Gold Ichimoku Daily Analysis
Data as at 4:05 am ET, July 28
===========================
Gold prices fell rather significantly on Thursday, stopping at 1255.16, just below the daily Ichimoku bottom cloud boundary at 1255.23. This down move smacks of the usual habit of profit-taking on the day following the Fed release, a sort of knee-jerk reaction. There is plenty of support down to the 1240 level: the daily Ichimoku cloud bottom boundary still at 1255.23, the daily tenkan-sen support at 1249.14, the daily kijun-sen support at 1235.15, and of course the brown uptrend support line near the 1240 level. It is not until we break down below the 1240 level that I would be willing to start selling. Yes, there seems to be a lot of negativity in the market suddenly, but at the end of the week it could just be a blip on the radar of the overall uptrend.
Indications remain strong that the uptrend is unfazed. The cloud is green. Tenkan-sen is still trading above the kijun-sen. Both lines lie below the gold price, and serve as support. This is the classic bullish scenario, akin to the price > 50 SMA > 200 SMA situation which most traders are familiar with. Momentum remains positive as the MACD histogram prints in the black with an upward sloping trajectory which points to higher prices. The 5-day RSI has dipped below 70, alleviating overbought pressure so that it could reach higher once again. However, on the upside, gold is meeting with stiff resistance at the 1260 region. Yesterday’s rebound following the shock selloff reached only as high as 1262.15, and the 1260 level has not been challenged ever since.
Fundamental analysts had attributed the massive gold pullback yesterday to the recovery of the dollar. This came on the back of a turnaround in the economic data with consumer confidence and the advance trade balance coming in better than expected, raising expectations for a stronger GDP number from the US. Today, we are going to have the advance GDP data from the US and that is likely to have an impact on the strength of the dollar. If the data is weak, then there is a real chance that gold prices might move through 1262, with the 1267-1270 region triggering a challenge to the very long-term downtrend line drawn from the ATH (not shown), and this resistance is currently in the 1275-1280 region. But, if the GDP data emerges much stronger than expected, then investors would continue to flock into equities despite the warning signs of an impending crash, a stronger VIX notwithstanding; investors had been weaned on an infallible Fed, that “big brother” would take care of the stock market, come hell or high water. That would send gold southwards, treading the path of Lara’s current Main Count.
GDX hourly count looks like it still needs to go up some more. That said, watch the channel. If the lower channel is properly breached, then price has spoken and the trend will likely change to down.
https://www.tradingview.com/x/KbmCbXDh/
Lara,
My hourly GDX count doesn’t look like the move up is done. What about this for a Gold alternate?
https://www.tradingview.com/x/lInfAWtk/
I don’t like the disproportion between minute ii and iv. I think I have a better solution…
no.1 today!