
Upwards movement was unexpected for Friday.
Summary: In the short term, the situation after Friday looks more bullish. The target is again 1,277. Use the blue Elliott channel on the daily and hourly charts to indicate when price has turned. Expect more upwards movement while price remains within the channel.
Look out for strong resistance ahead at the upper maroon trend line on the main weekly and daily charts.
Always use a stop. Invest only 1-5% of equity on any one trade.
New updates to this analysis are in bold.
Last monthly charts and alternate weekly charts are here, video is here.
Grand SuperCycle analysis is here.
MAIN ELLIOTT WAVE COUNT
WEEKLY CHART
Click chart to enlarge.
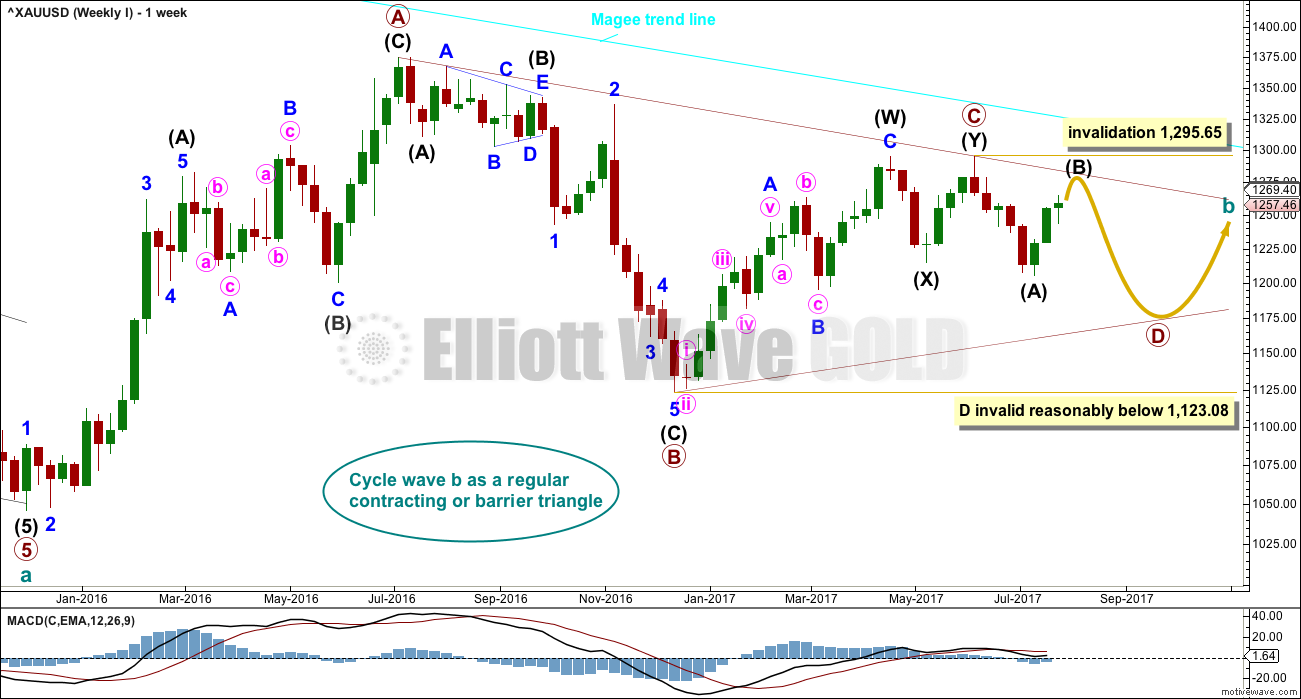
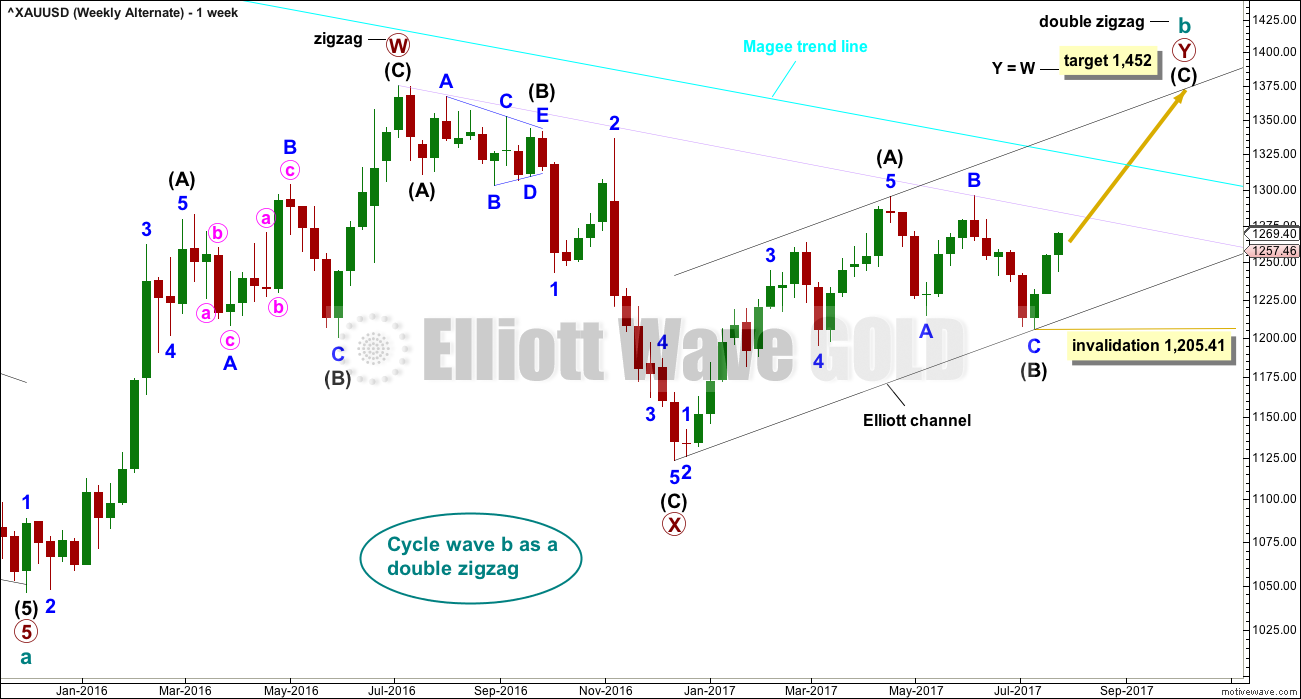
The Magee bear market trend line is added to the weekly charts. This cyan line is drawn from the all time high for Gold on the 6th of September, 2011, to the first major swing high within the following bear market on the 5th of October, 2012. This line should provide strong resistance.
At this stage, a triangle still looks possible and has the best fit for cycle wave b. It has some support from declining ATR and MACD now beginning to hover about zero.
Within a triangle, one sub-wave should be a more complicated multiple, which may be primary wave C. This is the most common sub-wave of the triangle to subdivide into a multiple.
Primary wave D of a contracting triangle may not move beyond the end of primary wave B below 1,123.08. Contracting triangles are the most common variety.
Primary wave D of a barrier triangle should end about the same level as primary wave B at 1,123.08, so that the B-D trend line remains essentially flat. This involves some subjectivity; price may move slightly below 1,123.08 and the triangle wave count may remain valid. This is the only Elliott wave rule which is not black and white.
Triangles normally adhere very well to their trend lines. So far the A-C trend line has been tested 11 times; this line has very strong technical significance. If this wave count is correct, then intermediate wave (B) should find very strong resistance if it gets up to the A-C trend line. A small overshoot is acceptable. A breach is not. If price reaches up to that trend line in the next one to few days, it would offer a good entry point for a short position. Stops then may be set a little above the line, or just above the invalidation point.
Finally, primary wave E of a contracting or barrier triangle may not move beyond the end of primary wave C above 1,295.65. Primary wave E would most likely fall short of the A-C trend line. But if it does not end there, then it can slightly overshoot that trend line.
Primary wave A lasted 31 weeks, primary wave B lasted 23 weeks, and primary wave C may have been complete in 25 weeks.
Primary wave D should now be expected to last a Fibonacci 13 or 21 weeks in total.
DAILY CHART
Click chart to enlarge.
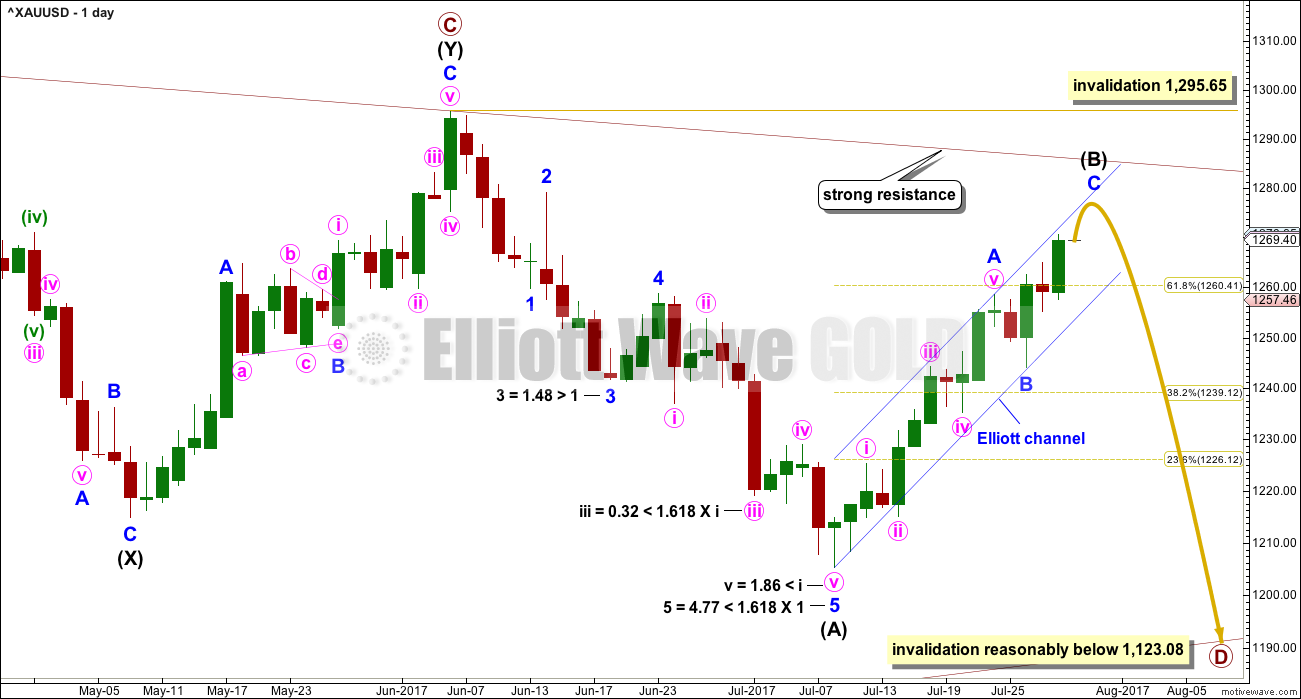
A common range for triangle sub-waves is from about 0.8 to 0.85 the prior sub-wave, this gives a range for primary wave D from 1,158 to 1,149.
At this stage, to try and see the whole of primary wave D complete at the last low does not look right. The B-D trend line would be too steep for a normal looking contracting Elliott wave triangle, and primary wave D would have been far too brief at only 5 weeks duration. For the wave count to have the right look and good proportions (as Gold almost always does), primary wave D should not be labelled over yet.
If primary wave C is correctly labelled as a double zigzag, then primary wave D must be a simple A-B-C structure and would most likely be a zigzag.
With intermediate wave (A) complete and now intermediate wave (B) a large and deep correction, primary wave D is beginning to look very typically like a large exaggerated zigzag.
Intermediate wave (B) looks to be unfolding as a zigzag, a three wave structure. Corrective waves have a count of 3, 7, 11, 15 etc. Each extension adds another 4. So far intermediate wave (B) has a count of 9 on the daily chart, so it now again looks incomplete.
Draw an Elliott channel about the zigzag of intermediate wave (B). Use this as a guide to when it may be over. When price breaks below the lower edge, that may be taken as an indication of a trend change.
So far intermediate wave (B) has lasted 14 days. It may not exhibit a Fibonacci duration now if it ends below the maroon A-C trend line.
Within the zigzag of primary wave D, intermediate wave (B) may not move beyond the start of intermediate wave (A) above 1,295.65.
HOURLY CHART
Click chart to enlarge.
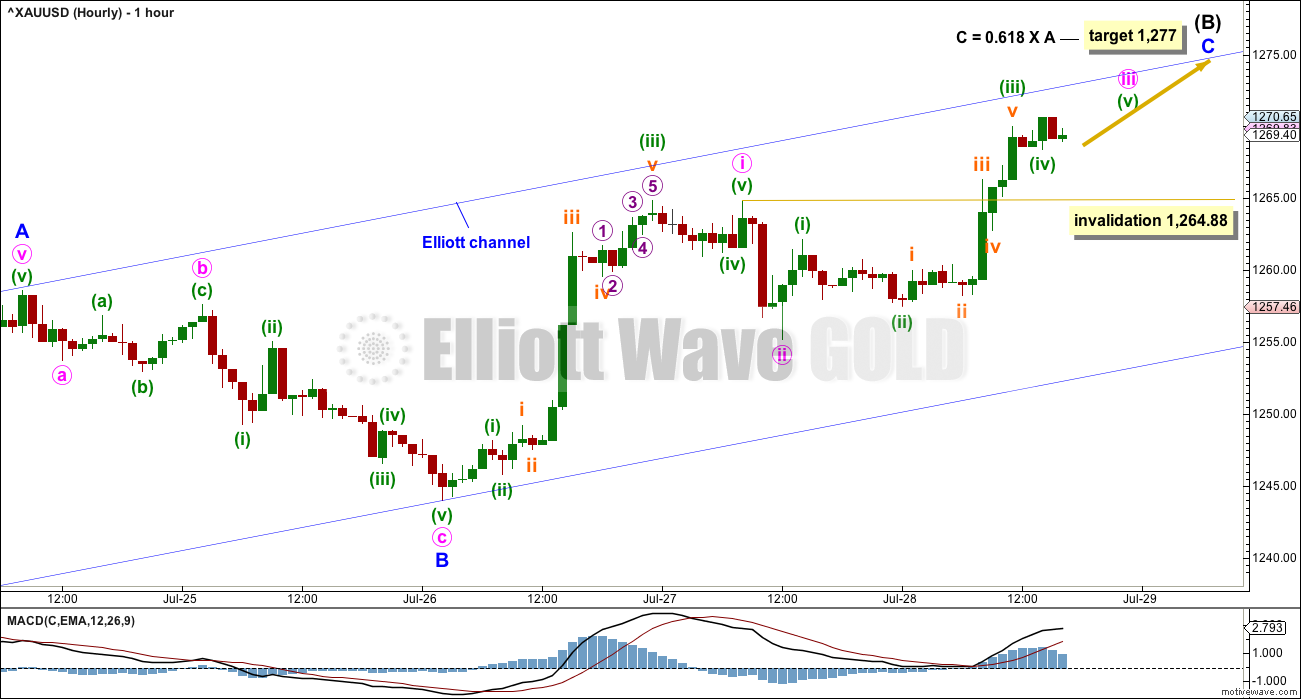
It looks like minor wave C is extending. Within minor wave C, minute wave ii shows up on the daily chart as one red daily candlestick. So for the structure to have the right look at the daily chart level minute wave iv may also show up as one or more red daily candlesticks or doji.
Minute wave iv may not move into minute wave i price territory below 1,264.88.
If this labelling is invalidated in the short term, then the second hourly chart below may be correct. However, a new low below the channel and then below 1,244.01 would still be required for reasonable confidence in a trend change.
The target given here for intermediate wave (B) to end would see it fall slightly short of the maroon A-C trend line on the daily and weekly charts. If the target is wrong, it may be a little too low. Price may move higher to touch the trend line.
SECOND HOURLY CHART
Click chart to enlarge.
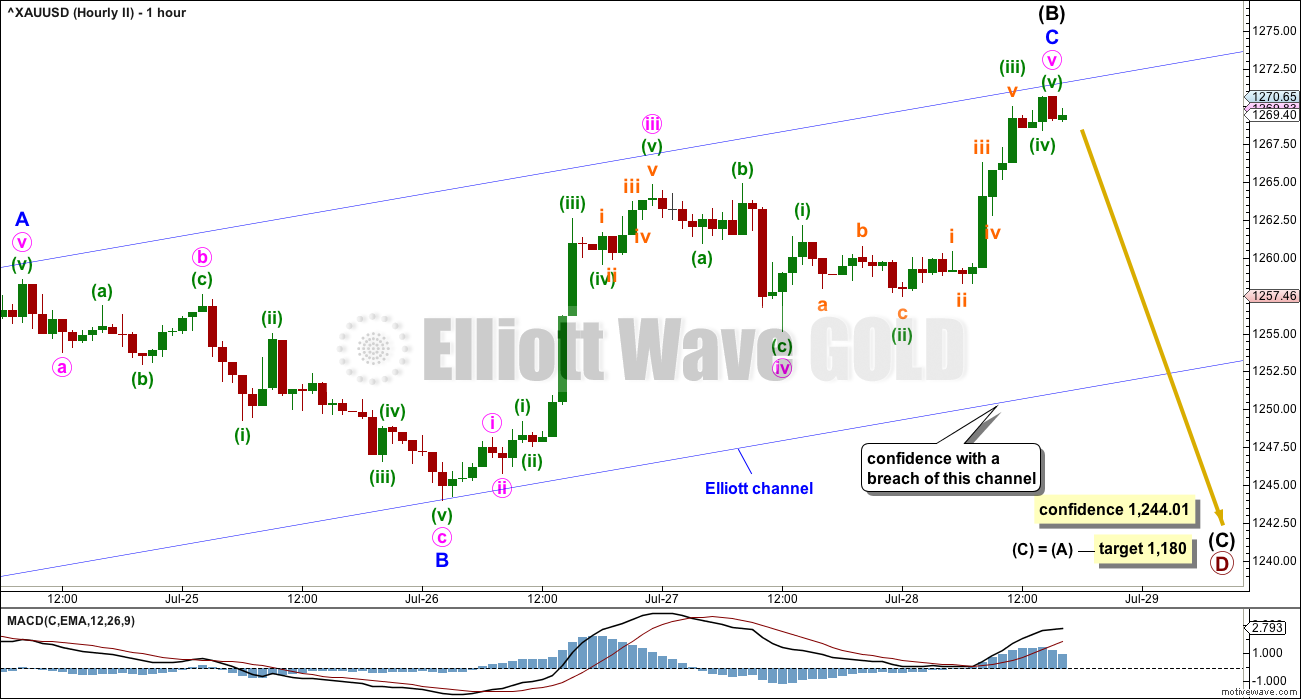
It is possible again that intermediate wave (B) is over at Friday’s high.
Within minor wave C, there is gross disproportion between minute waves ii and iv. Minute wave iv shows up at the daily chart level but minute wave ii does not. This disproportion must necessarily reduce the probability of this wave count to an alternate.
This wave count requires a breach of the blue Elliott channel and then a new low below 1,244.01 before reasonable confidence may be had in it.
1,244.01 is the start of minor wave C. A new low below its start may not be a second wave correction, so at that stage minor wave C would have to be over.
ALTERNATE ELLIOTT WAVE COUNT
WEEKLY CHART
Click chart to enlarge.
This wave count has been published only in historical analysis. At this stage, it will be published on a daily basis.
There are more than 23 possible corrective structures that B waves may take, and although cycle wave b fits best at this stage as a triangle (main wave count), it may still be another structure. This wave count looks at the possibility that it may be a double zigzag.
If cycle wave b is a double zigzag, then current upwards movement may be part of the second zigzag in the double, labelled primary wave Y.
The biggest problem with this wave count is the structure of intermediate wave (A) within primary wave Y. This upwards wave looks very much like a three and not a five. This upwards wave must be seen as a five for this wave count to work.
Within the second zigzag of primary wave Y, intermediate wave (B) is a completed regular flat correction. Minor wave C ends just slightly below the end of minor wave A avoiding a truncation. There is no Fibonacci ratio between minor waves A and C.
The target remains the same as previously published for this wave count.
Along the way up, some resistance should be expected at the cyan Magee trend line.
Within intermediate wave (C), no second wave correction may move beyond the start of its first wave below 1,205.41.
DAILY CHART
Click chart to enlarge.
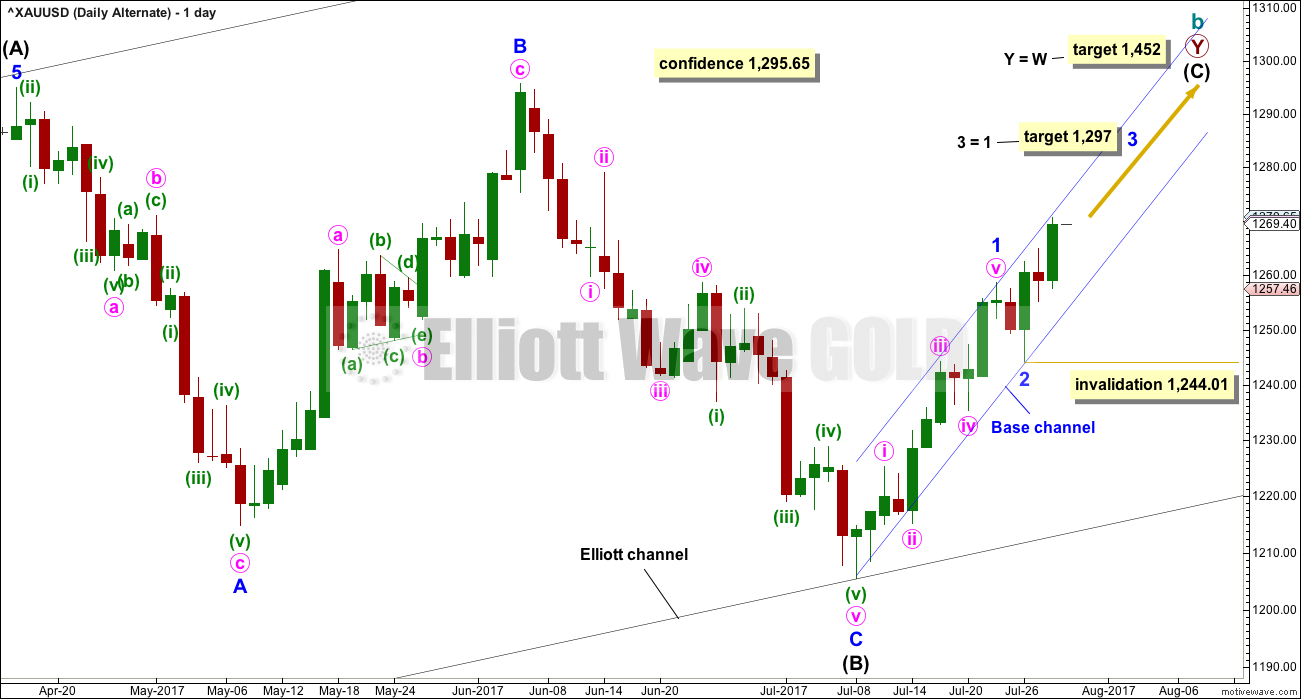
Intermediate wave (C) may be unfolding as an impulse.
Minor wave 2 may be over as a very quick and shallow zigzag.
Because minor wave 1 was a long extension, the target for minor wave 3 is for equality with minor wave 1.
Within minor wave 3, no second wave correction may move beyond the start of its first wave below 1,244.01.
HOURLY CHART
Click chart to enlarge.
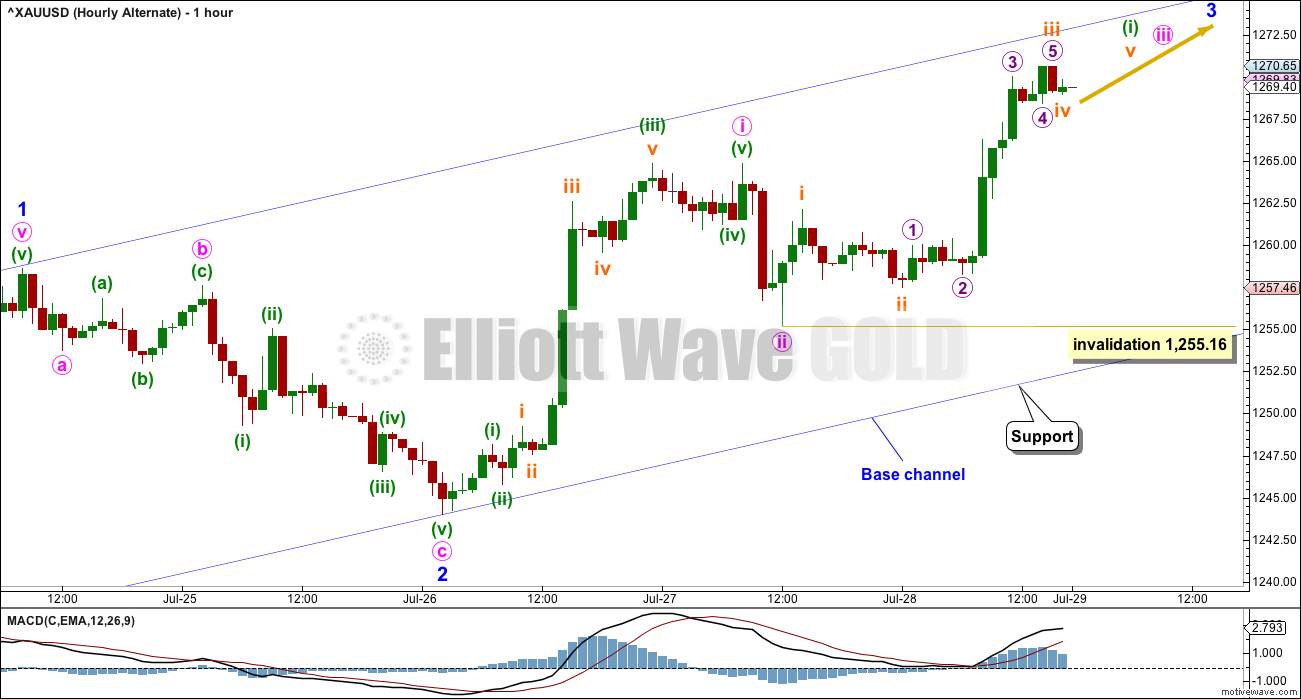
If minor wave 3 for this alternate is to be an extension reaching equality with minor wave 1, then its subdivisions may show up on the daily chart like those for minor wave 1 do.
This wave count would now expect a strong increase in upwards momentum next week as the middle of a third wave passes.
For this alternate, only minuette wave (i) within minute wave iii may be completing. Minuette wave (i) shows weaker momentum than minute wave i, which is acceptable.
Minuette wave (ii) may not move beyond the start of minuette wave (i) below 1,255.16.
TECHNICAL ANALYSIS
WEEKLY CHART
Click chart to enlarge. Chart courtesy of StockCharts.com.
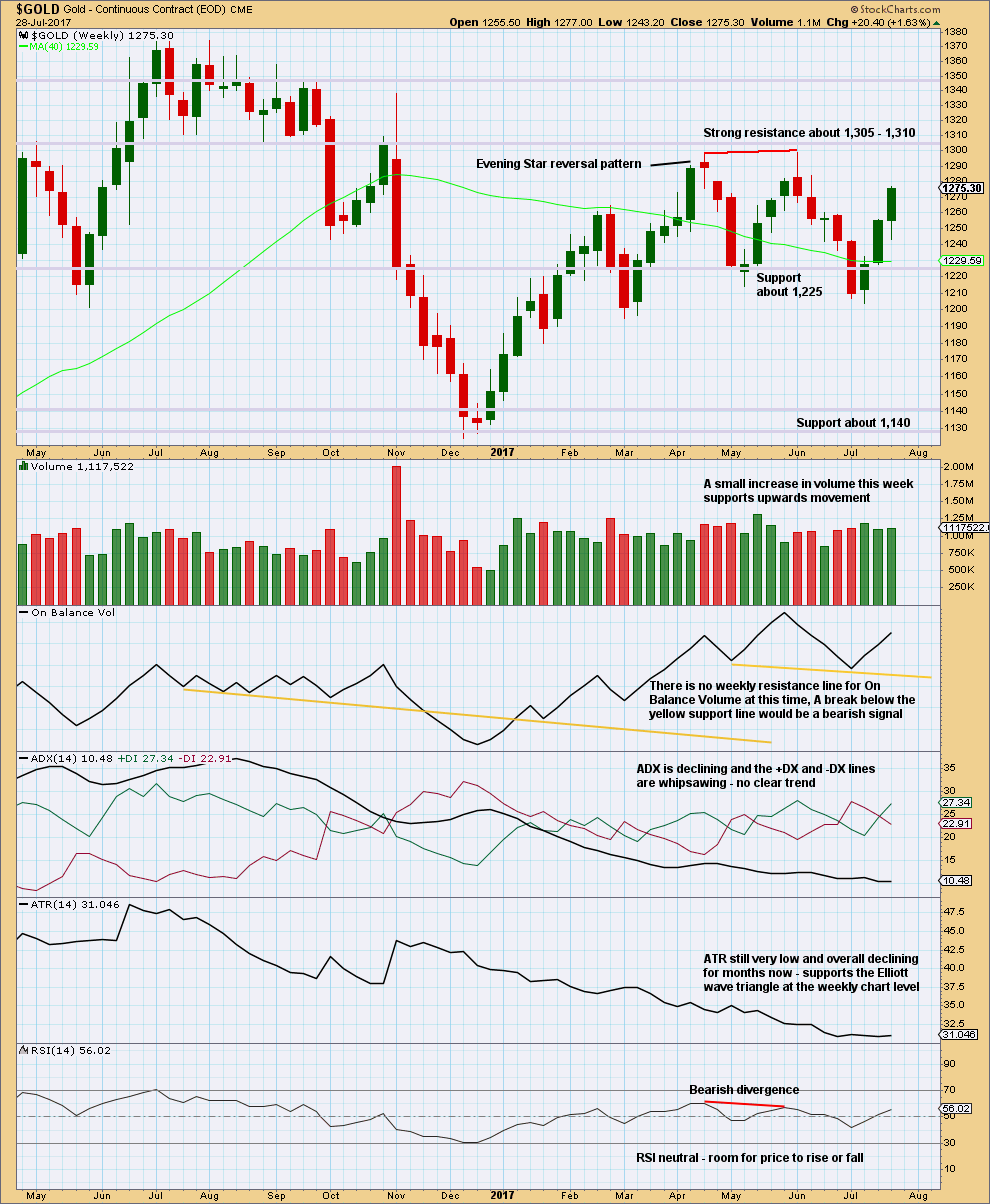
A long lower wick and some support from volume suggest more upwards movement next week.
Price is range bound with resistance about 1,305 to 1,310 and support about 1,225 to 1,205. During this range bound period, it is an upwards week that has strongest volume suggesting an upwards breakout may be more likely than downwards. This is contrary to the main Elliott wave count.
ATR continues to decline, which does support the main Elliott wave count.
DAILY CHART
Click chart to enlarge. Chart courtesy of StockCharts.com.
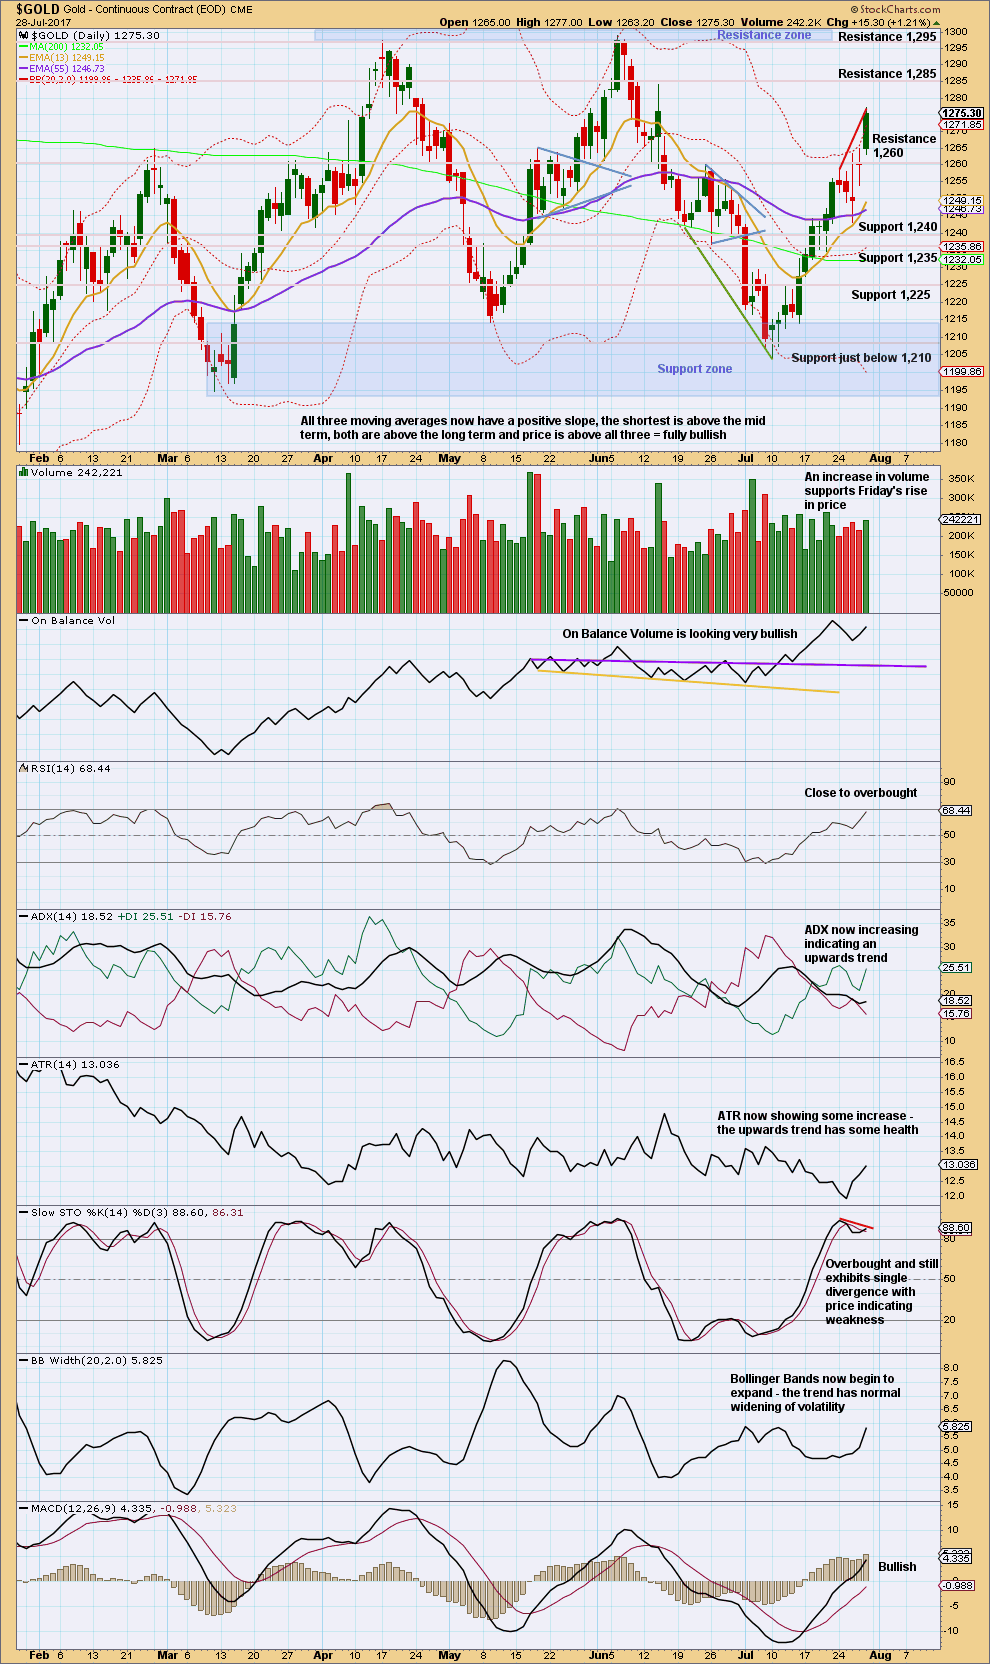
Despite apparent weakness after Thursday, Friday moved price strongly higher. Next resistance is about 1,285.
Stepping back and looking at the larger consolidation, Gold moved into a range back in February this year, delineated by support and resistance zones. During this consolidation, it is two upwards days of 7th of April and the 17th of May that have strongest volume. This suggests an upwards breakout is more likely than downwards, and it supports the alternate Elliott wave count and not the main Elliott wave count.
The only sign of weakness short term, after Friday’s strong upwards day, is single bearish divergence with price and Stochastics. Stochastics can remain extreme for long periods of time during a strong trend, and it can develop multiple divergence while extreme before price turns.
Overall, this chart now is looking more bullish than bearish.
GDX
DAILY CHART
Click chart to enlarge. Chart courtesy of StockCharts.com.
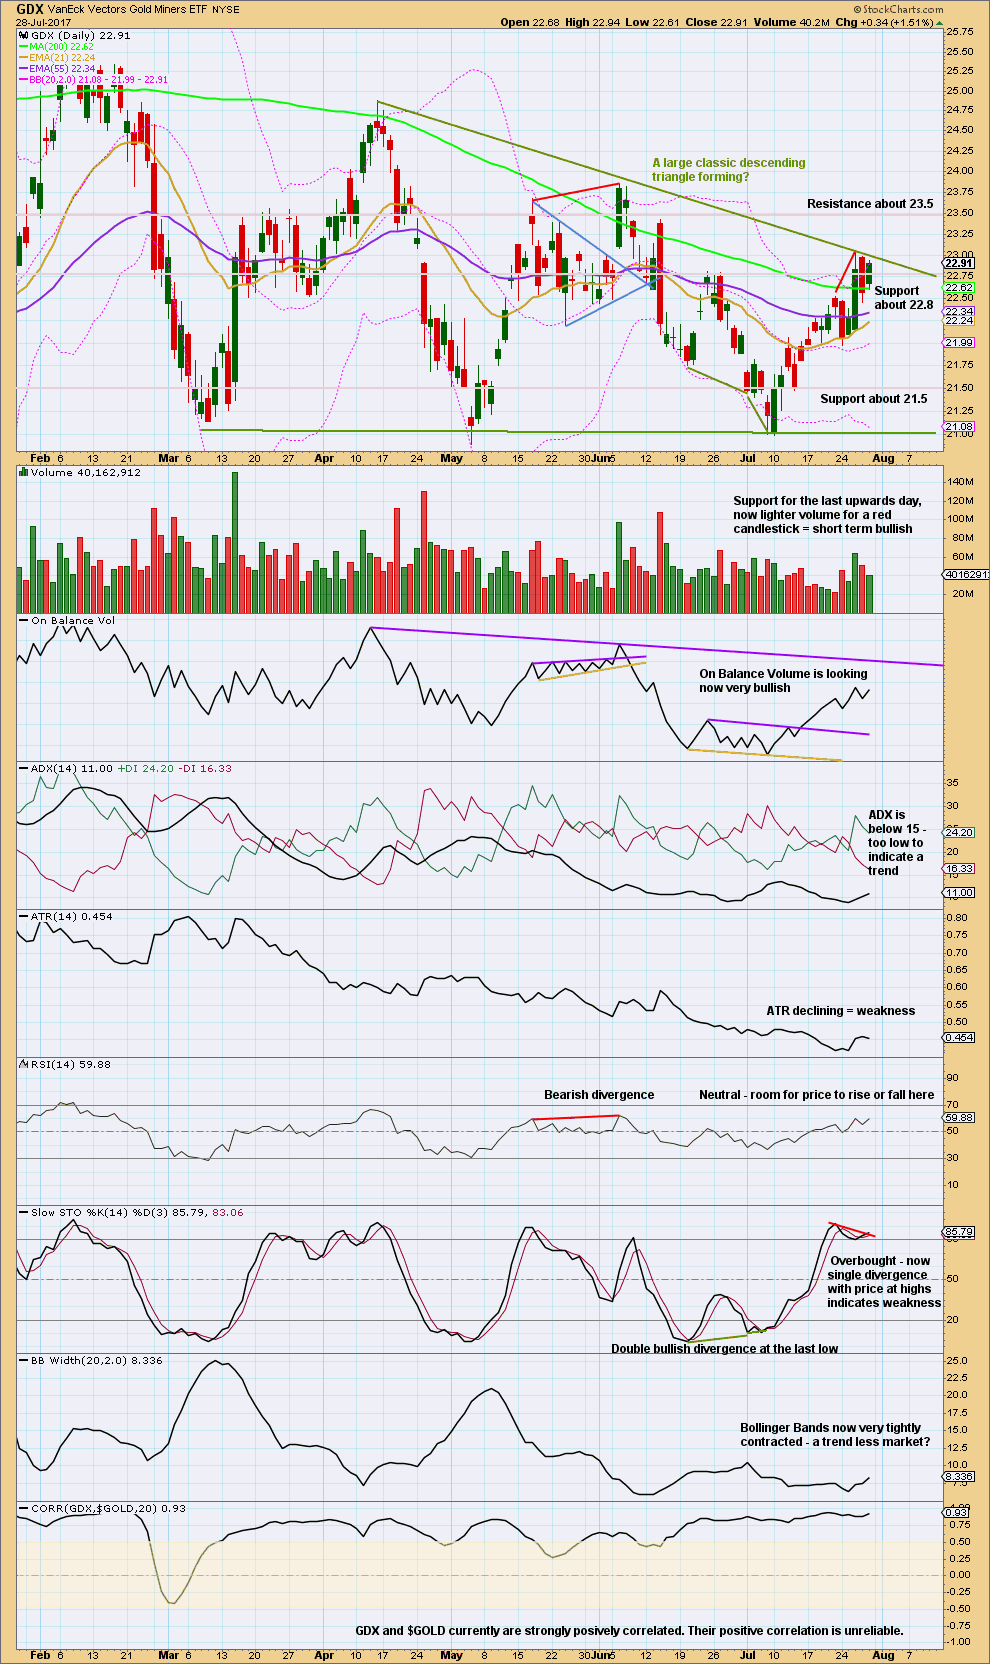
Stepping back for GDX too, to look at the past six months, a large descending triangle looks like it has formed and may be close to a breakout. Breakouts from descending triangles are usually downwards.
During this structure though it is an upwards day for the 15th of March that has strongest volume suggesting an upwards breakout may be more likely than downwards.
There is overall some decline in volume lately. This supports the view that a triangle is nearing completion. ATR also supports this view.
Published @ 03:20 a.m. EST on 29th July, 2017.
This analysis was pretty close so far:
https://www.edelsoninstitute.com/gold-silver/strong-earnings-from-gold-miners-is-it-time-to-buy/?sc=WAV-E
Hourly chart update:
Minute iii and iv may be complete. Minute ii and iv have good proportion, this looks right. Minute iii is shorter than minute i, so minute v is limited to no longer than equality in length with minute iii so that minute iii is not the shortest. The limit is above the target.
As soon as we see a new high for Gold it could be ready to turn. As soon as we see a new high the invalidation point no longer applies because both minute iv and v could be over.
After a new high (whether or not the target is met) if price turns and breaks below the blue channel that shall be indication of a trend change.
Volume analysis suggests caution for GDX
https://surfcity.co/2017/07/30/gdx-and-gdxj-volume-patterns/
I’ve mentioned the low volume up move over the course of this move so I agree with you, it doesn’t look like a strong move up. However Gdx could break out soon of the triangle and I believe Lara mentioned that volume within the triangle could be lower. If it breaks out vol would increase dramatically. Commercials adding to their short position is also a concern, but overall the commercial short position is closer to that seen at bottoms then tops. North Korea and or a market swoon could also factor in….so really just have to be nimble. Hope it moves back down so I can buy some more long term but may not get that opportunity.
This post from Elliott_trader:
Weekly triangle counts are slightly different than Lara’s. Both agree on triangle.
http://studyofcycles.blogspot.com/2017/07/weekly-gold.html
I don’t like the running flat in that count for (b) within C.
Excellent comment Lara. Thanks you are the best.
This wave count for the triangle is the same as the one by J Kennedy that you posted below. The problem is with the (a) point. Both wanted a 3-3-5 triangle, and ended up with a running flat. As explained in my response to the Kennedy post, I have the same picture but my (a) point is at the next peak to yield a normal flat, or a zigzag with C=A.
I guess monday is +-10$. To the end of a monz I expect window dressing. The Pop Gun I was trading should end in a decline. …
Interesting pattern. I’d never heard of it before.
You’re right, the decline resumes after the pop, for this pattern.
Now my guess is a 4 hour pop gun is in work…. really exciting.
…and failed!
US Oil Weekly Ichimoku Analysis
Data as at market close of July 28
============================
The WTI crude oil market rallied throughout the week, reaching a high of 49.81 on Friday. Investors had been cheered by the positive outcome from the meeting between the OPEC and the non-OPEC nations. The promise of a reduction in output had calmed nerves.
Crude oil price is trading above both the tenkan-sen and the kijun-sen. The tenkan-sen lies above the kijun-sen. This is the traditional bullish setup. Moreover, prices have broken above the top cloud boundary convincingly, and has risen above the 200-day SMA. However, as oil prices approach the round number 50.00, I have my apprehensions for a further northward foray. Prices have already risen too far too fast, and some pullback should be in order. The 50-day SMA lies below the 200-day SMA, a not too encouraging sign. The kumo is red all through August, indicating the market is still not considered bullish yet. A daily close above 50.00 will inject the bulls with vigour, and prices could then rise to 52.00, the previous high of May 25, and possibly the 55 level which was the highest price recorded this year. But, I doubt whether we could reach that far.
Silver essentially mirrors gold, so there is no necessity of putting up a separate analysis for it. I reckon 16.50 is the supportive level, and the market is targeting 17.00 next.
End of Week Analysis
Data as at the market close of July 28
==============================
Gold markets initially fell during the week, but found enough support underneath the 1250 level to turn around at 1244.01 and formed a nice-looking hammer. Prices then rebounded strongly, surging to as high as 1270.65 on Friday.
Indications remain strong that the uptrend is still ongoing. The cloud is green until August 7, so we should have a week of bullish sentiment ahead of us. Prices have almost broken free of the shackles of the top cloud boundary. Tenkan-sen is trading above the kijun-sen, and this with increasing slope. Both lines lie below the gold price, and serve as support. This is the classic bullish scenario, akin to the price > 50 SMA > 200 SMA situation which most traders are familiar with. Momentum remains positive as the MACD histogram prints in the black with an upward sloping trajectory which points to higher prices. The 5-day RSI is still pointing upwards in the overbought region.
On the upside, the greatest battle is for a break above the long-term downtrend resistance line drawn from the ATH (not shown). This resistance is currently in the 1275-1280 region. If prices can surmount this barrier, then the double top of 1294.96 and 1295.65 would be next. A break above this would be difficult, but if it does do so, then 1350 will not be out of the question. Conversely, should prices be rejected by the long-term downtrend resistance line or the double top, then profit-taking would set in, sending prices southwards, targeting the 1244.01 low on Wednesday, followed by a retest of the brown resistance-turned-support trendline in the 1240s. A successful breach would see prices tumbling towards 1205.41. Should prices drop below 1205.41 on a daily closing basis, then the round-number psychological support of 1200, as well as the 1183-1193 region, would appear as quotes.
Hi Alan, your contribution is highly appreciated. Thank you very much
You are most welcome.
Here’s the hourly GDX count. Expecting a couple more up days before a reversal down…
Target = 23.52
https://www.tradingview.com/x/rh2bbktj/
Not much change for my weekly GDX count. Still expecting a little more up next week toward the purple trendline. Target = 23.52.
Volume continues to be in overall decline since last November. A very slight increase in volume for the last week suggests the current move up is not over.
In the less probable event that 23.86 is broken to the upside, that would likely necessitate a bullish count.
https://www.tradingview.com/x/4HcMdcTH/
And on the USD, J Kennedy sees the USD falling further to the .50 or .618 retrace before turning higher. In theory, that could support a move up in gold, although gold and the dollar have had a very inconsistent inverse correlation for the last year.
So a couple of days ago I shared gold counts from Tom Denham of EWI. On Friday I captured a gold count from Jeffrey Kennedy of EWI. Friday was the last day of their free access.
It seems that analysts at EWI don’t work together on their counts as the counts for gold from these two analysts couldn’t be more different.
Anyway, J Kennedy sees gold with a bullish count (good to know), but he’s showing a running flat which I think would make it a lower probability count.
If, and that’s a big if at this point, the bull count wins out, I think Lara’s bull count makes more sense.
Any thoughts?
The bullish count is possible if you redraw the Triangle with gold finishing D at July’s low and now heading up to break through the 2011 long term trend line. Which fits with silver finishing it’s D and now heading up to break through to its descending rectangular trendline.
Here is silver’s rising up from it’s D and heading towards it E of it’s descending trend lines. Can it break through?
Rin, not sure I agree with your point. If Gold finished “D” at the July low, this leg up would be “E” and a big move down would be expected…
Oh really, I always thought E was the point of breakout for a symmetrical triangle
If it does drop, then it’s a good shorting opportunity. I still feel gold needs to retest 1180 area of support before she can break through to all time highs. We shall see I guess
Elliott wave triangle example
Dreamer’s right. It doesn’t make sense.
Take a look at the video on the Education page for triangles. Then try labelling yours beginning with A.
Where does A begin?
Finally…. for an EW triangle, the direction of entry is the same as the direction of exit. They’re analogous to pennants in classic pattern analysis for smaller versions, and symmetrical triangles for larger versions.
You have to fit it into the larger picture at the monthly chart level.
I really really don’t like that running flat. The probability of that must be judged to be low. They are rare, and should only come within a price movement that can has very strong momentum.
Momentum is most definitely not strong here.
That’s what I thought you would say. Thanks for confirming 😀
LOL You’re getting to know me well then Dreamer 🙂
I have my blue (A) or possibly (1) to the right at the peak between the blue (A) and the orange B. In that way, I count 5 waves from the low of circled X.
Update on Gold weekly long term chart. Gold monthly chart has bullish reversal candle; hammer.
Bullish Inv HnS just below the major resistance line from 2011 top.
Possible. As you know, Rambus talks about consolidations below a major trendline. For me to get bullish, the Magee Bear trendline needs to get broken.
Is anyone else seeing a possible head and shoulders developing? The target looks to be just about the area of the December lows.
Like this?
Looks like a good possibility if we reverse down next week.
https://www.tradingview.com/x/MgF4SC6d/