
A breakout from the consolidation was expected for Friday but did not happen. Both Elliott wave counts at the hourly chart level remain valid.
Summary: A downwards breakout from this consolidation may now come on Monday or Tuesday. A new low reasonably below 1,237.06 would indicate price should be breaking out downwards.
A new high above 1,253.82 would indicate a short lived false upwards breakout, before an eventual downwards breakout.
New updates to this analysis are in bold.
Last monthly charts and alternate weekly charts are here, video is here.
Grand SuperCycle analysis is here.
WEEKLY CHART
Click chart to enlarge.
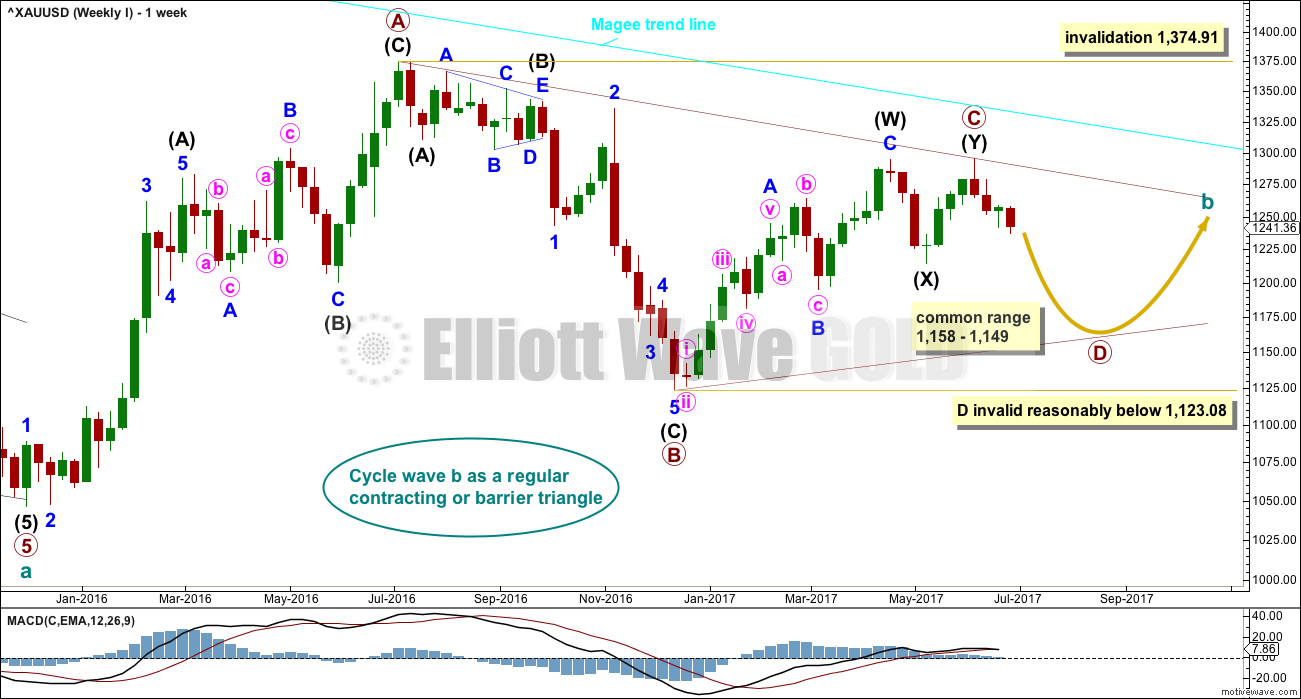
The Magee bear market trend line is added to the weekly charts. This cyan line is drawn from the all time high for Gold on the 6th of September, 2011, to the first major swing high within the following bear market on the 5th of October, 2012. This line should provide strong resistance.
At this stage, a triangle still looks most likely and has the best fit for cycle wave b.
Within a triangle, one sub-wave should be a more complicated multiple, which may be primary wave C. Primary wave C may not move beyond the end of primary wave A above 1,374.91. This invalidation point is black and white.
At this stage, it looks like primary wave C is now complete at the hourly and daily chart level. However, at the weekly chart level, it looks possible it may continue higher. This possibility must be acknowledged while price remains above 1,214.81. Within intermediate wave (Y), minor wave B may not move beyond the start of minor wave A.
Primary wave D of a contracting triangle may not move beyond the end of primary wave B below 1,123.08. Contracting triangles are the most common variety.
Primary wave D of a barrier triangle should end about the same level as primary wave B at 1,123.08, so that the B-D trend line remains essentially flat. This involves some subjectivity; price may move slightly below 1,123.08 and the triangle wave count may remain valid. This is the only Elliott wave rule which is not black and white.
There are three alternate wave counts that have been published in the last historic analysis, which is linked to above. They are all very bullish. They will only be published on a daily basis if price shows them to be true with a new high now above 1,295.65.
DAILY CHART
Click chart to enlarge.
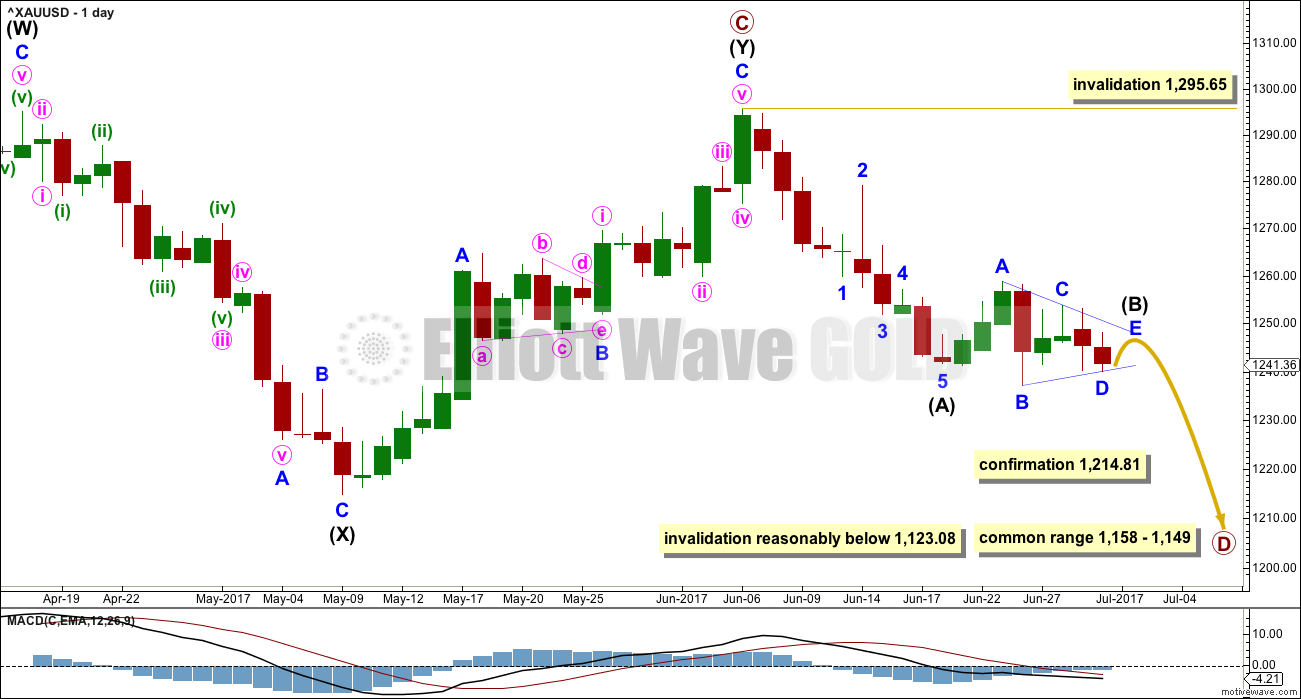
Intermediate wave (Y) may now be a complete zigzag if it is accepted that a triangle completed in the position labelled minor wave B. This has a perfect fit on the hourly chart.
A new low below 1,214.81 could not be minor wave B within intermediate wave (Y) and would provide strong confirmation that intermediate wave (Y) is over.
A common range for triangle sub-waves is from about 0.8 to 0.85 the prior sub-wave, this gives a range for primary wave D from 1,158 to 1,149.
If primary wave C is correctly labelled as a double zigzag, then primary wave D must be a simple A-B-C structure and would most likely be a zigzag. Within primary wave D, intermediate wave (B) may not move beyond the start of intermediate wave (A) above 1,295.64.
Intermediate wave (A) lasted only ten days. So far intermediate wave (B) has lasted eight days. At the hourly chart level, it does not look like it is over yet, so it may not exhibit a Fibonacci duration.
At this stage, it looks like intermediate wave (B) may be completing as a triangle. If this is correct, then it must be very close to completion and the breakout should be downwards. The degree of labelling may not be moved down one degree within it because A waves do not subdivide as triangles.
The main hourly chart below follows on from the labelling here on the daily chart.
The alternate would see minor wave A complete in the same position but minor wave B incomplete as a triangle.
Primary wave A lasted 31 weeks, primary wave B lasted 23 weeks, and primary wave C may have been complete in 25 weeks.
Primary wave D should be expected to last at least 8 weeks (but most likely longer). The next Fibonacci ratio in the sequence would be a Fibonacci 13 and then 21.
HOURLY CHART
Click chart to enlarge.
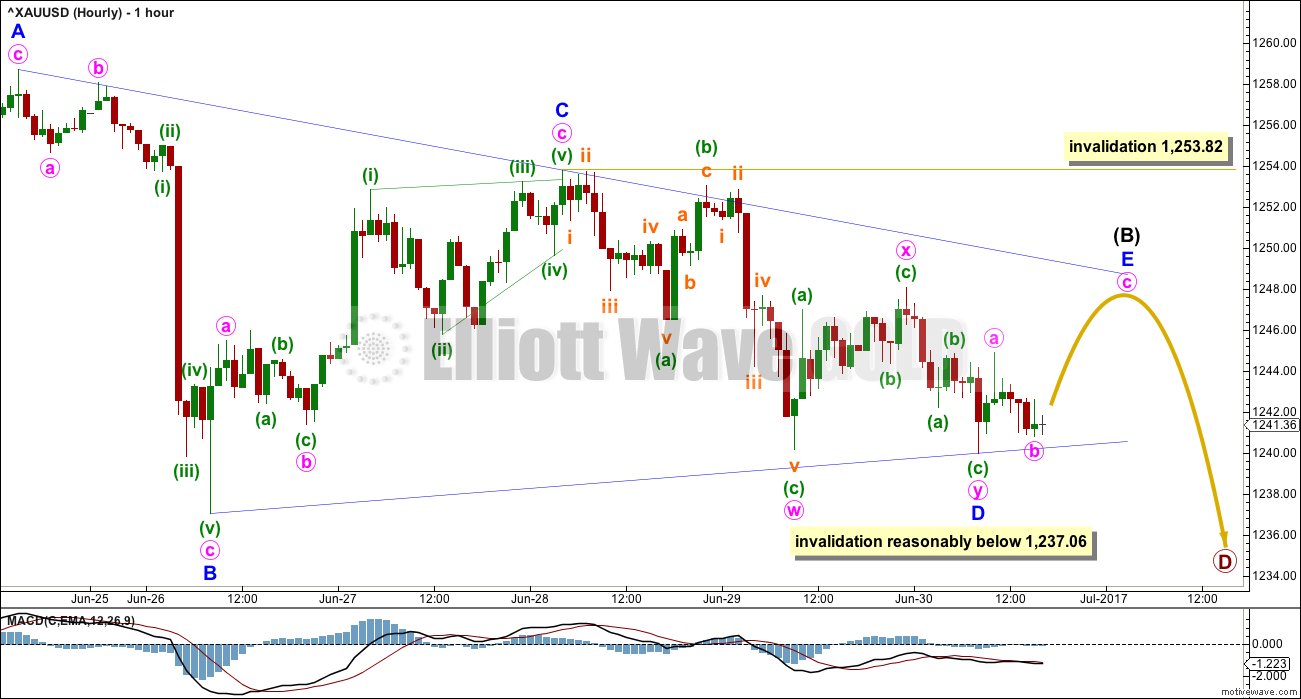
It is looking increasingly likely that intermediate wave (B) is unfolding as a running contracting or running barrier triangle.
It is possible that minor wave A within the triangle could have been a single zigzag, although this does not have as good a fit as a double zigzag in that position.
If minor wave A was a single zigzag, then the very slight new low within Friday’s session may be a double zigzag for minor wave D.
Minor wave E would most likely fall short of the A-C trend line. If it does not end there, then the next likely point for it to end would be with a small overshoot of the A-C trend line.
Minor wave E may not move beyond the end of minor wave C above 1,253.82.
If minor wave D continues any lower, then it may not move below the end of minor wave B at 1,237.06 for a contracting triangle. For a barrier triangle, minor wave D may end about the same level as minor wave B; as long as the B-D trend line remains essentially flat the triangle will remain valid. This price point involves some subjectivity.
If price moves sideways and slightly higher, then turns and begins to move very strongly lower, look out for an end to the triangle. When triangles conclude, price normally moves out of them with strong and fast movement.
ALTERNATE HOURLY CHART
Click chart to enlarge.
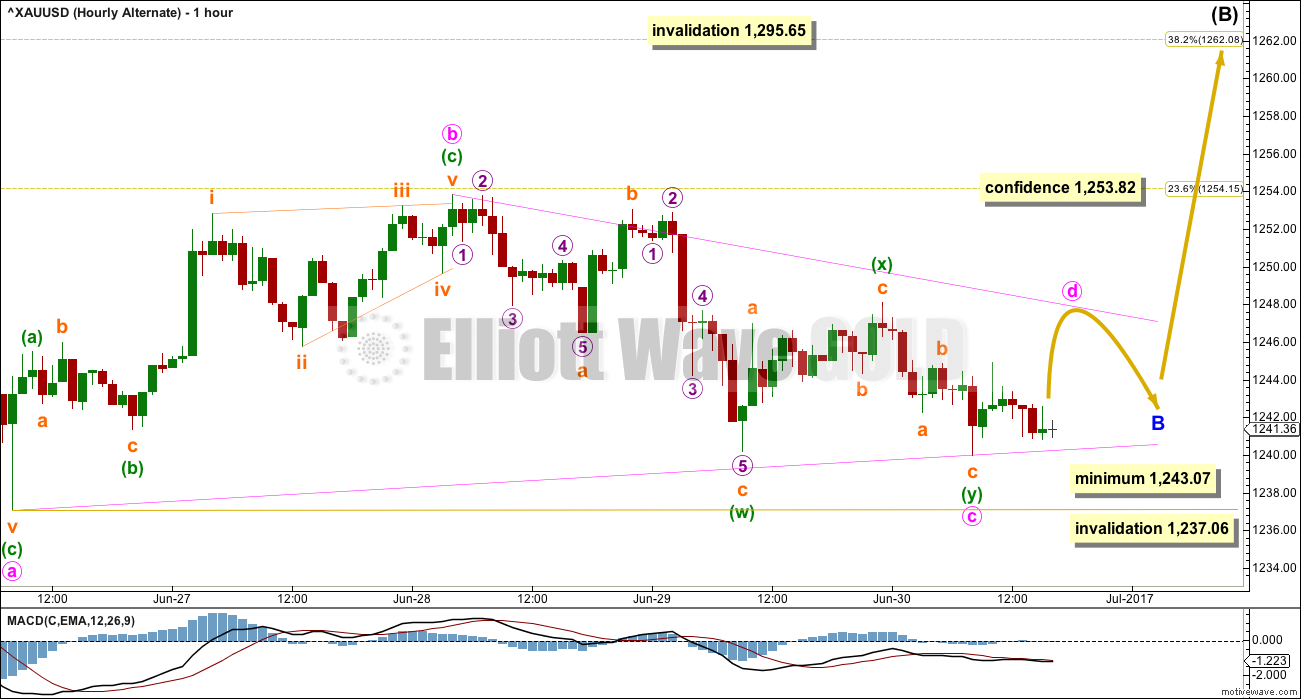
It is very important to always consider alternate ways of labelling a structure that looks like is unfolding as an Elliott wave triangle. Triangles are very tricky structures; it is only clear exactly how they unfolded when they end.
A flat correction may still be unfolding. Within the flat correction, minor wave A is a double zigzag and this is classified as a three; A waves within flats subdivide as threes. Within the flat correction, minor wave B must at its end retrace a minimum 0.9 length of minor wave A, so minor wave B must end at or below 1,243.07.
Within the triangle of minor wave B, minute wave c may now be complete and minute wave d may now be unfolding higher.
For a contracting triangle, minute wave d may not move above the end of minute wave c at 1,253.82; minute wave d may end when price comes up to touch the upper b-d trend line. For a barrier triangle, minute wave d may end about the same level as minute wave b; a barrier triangle will remain valid as long as the b-d trend line remains essentially flat.
Minute wave e may not move beyond the end of minute wave c below 1,240.17.
This alternate still expects some sideways movement for another one to two days followed by a short upwards thrust for minor wave C, which may look like a false upwards breakout.
Along the way up, a new high now above 1,253.82 would invalidate the first hourly wave count and provide some confidence in this alternate.
TECHNICAL ANALYSIS
WEEKLY CHART
Click chart to enlarge. Chart courtesy of StockCharts.com.
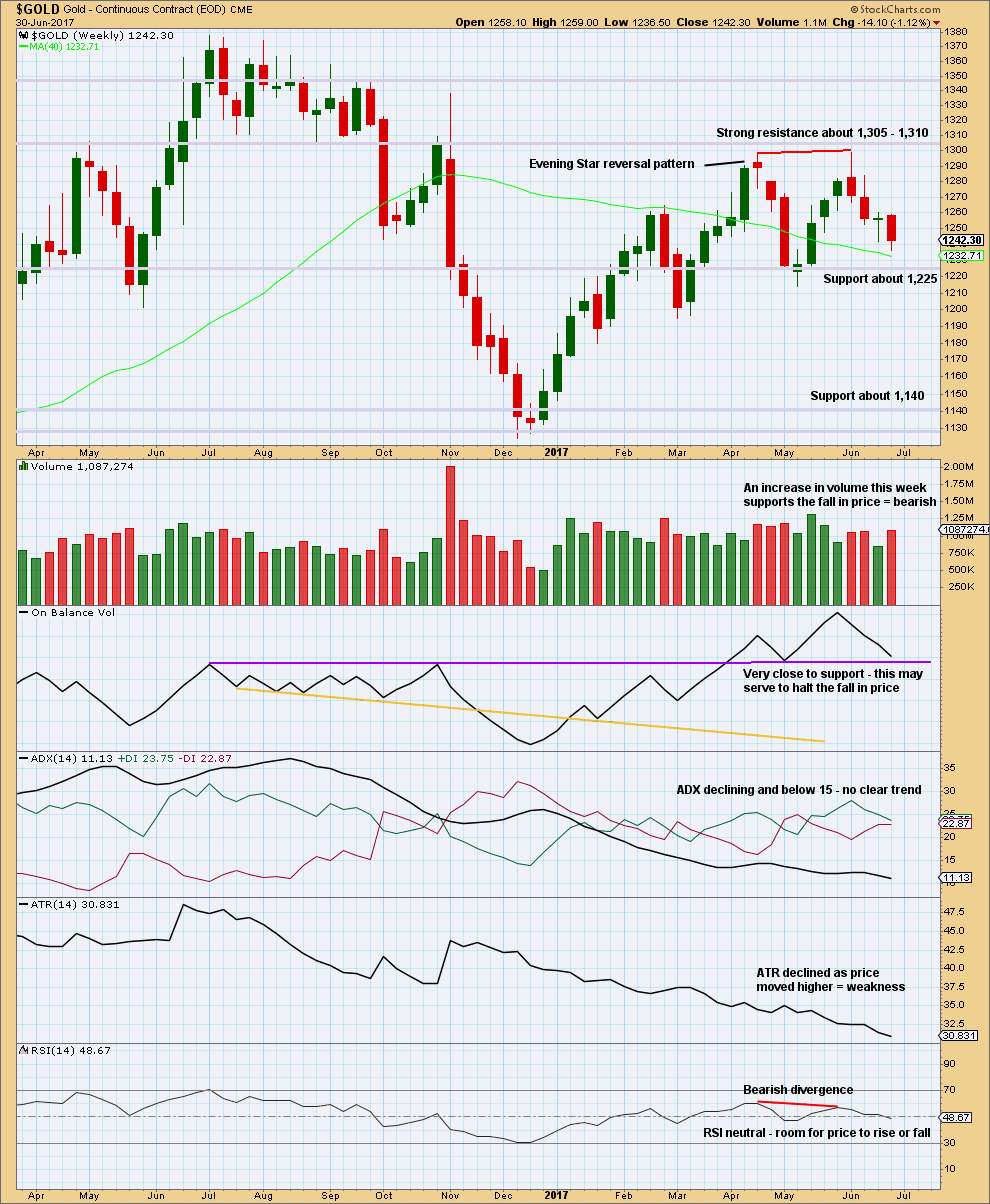
Volume this week supports the downwards trend at least short term.
If On Balance Volume breaks below the purple support line, it would offer a bearish signal. If it bounces up from this line, it would offer a bullish signal.
Declining ATR for a long time fits neatly with the expectation of a large triangle unfolding.
DAILY CHART
Click chart to enlarge. Chart courtesy of StockCharts.com.
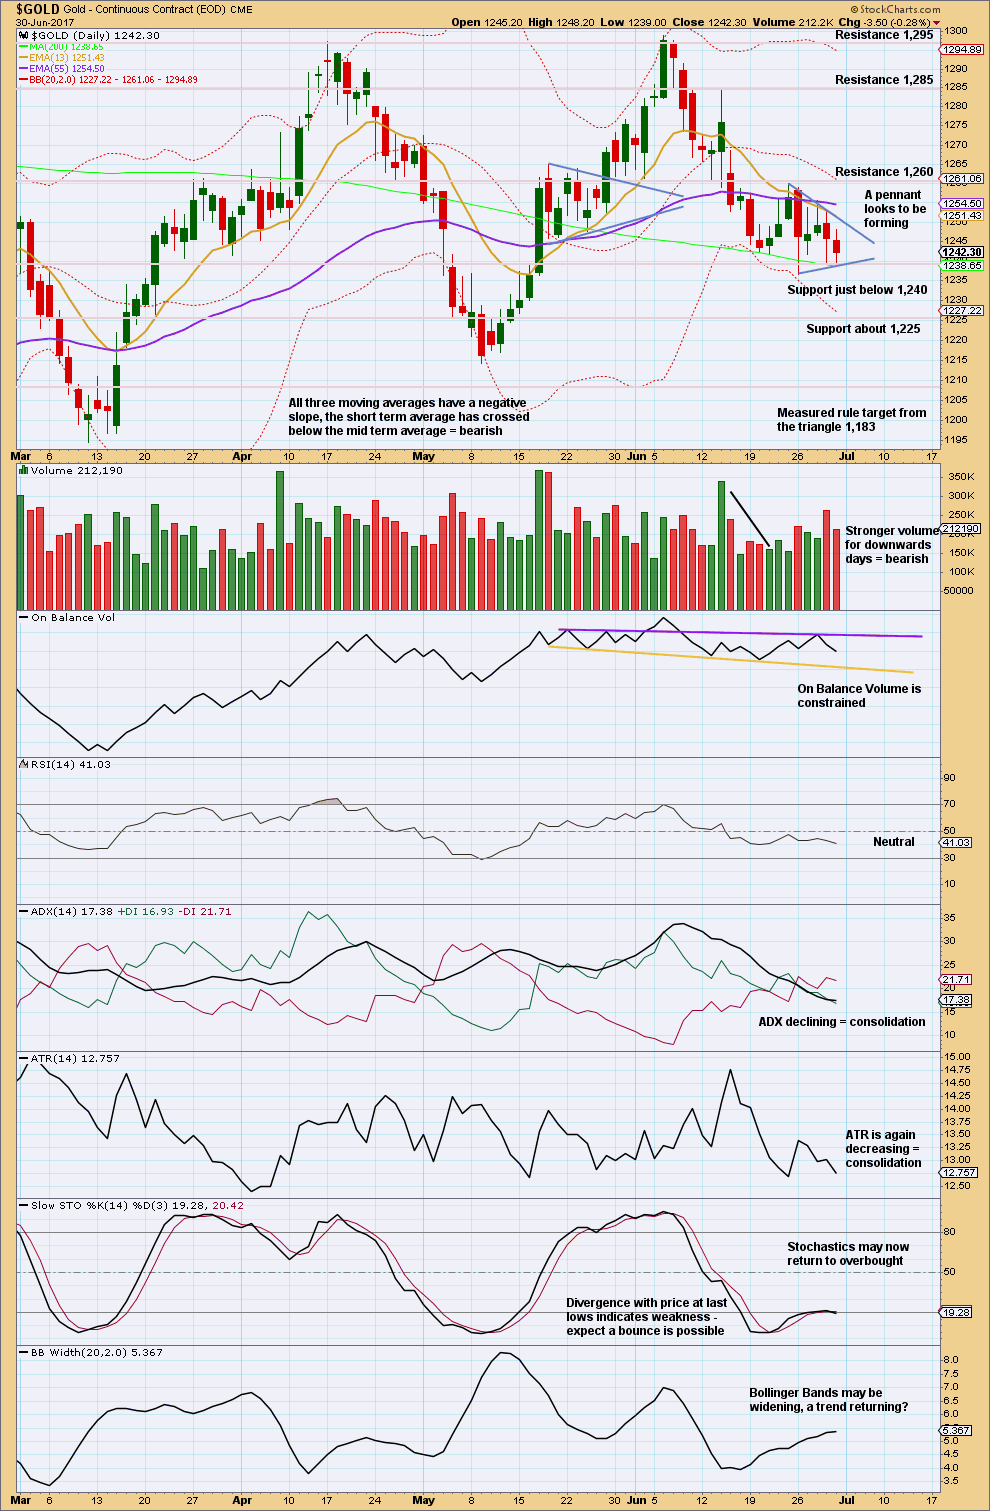
Price is range bound again with resistance about 1,260 and support about 1,240. So far, during this small consolidation, it is two downwards days that have strongest volume suggesting a downwards breakout is more likely than upwards. This supports the main hourly Elliott wave count over the alternate.
The consolidation now is looking like a pennant pattern. These are reliable continuation patterns. A target is calculated. The breakout should be downwards. However, volume is not declining as the pattern progresses, so volume does not support this pattern.
The resistance line for On Balance Volume is adjusted.
ATR and ADX agree that price is consolidating.
GDX
DAILY CHART
Click chart to enlarge. Chart courtesy of StockCharts.com.
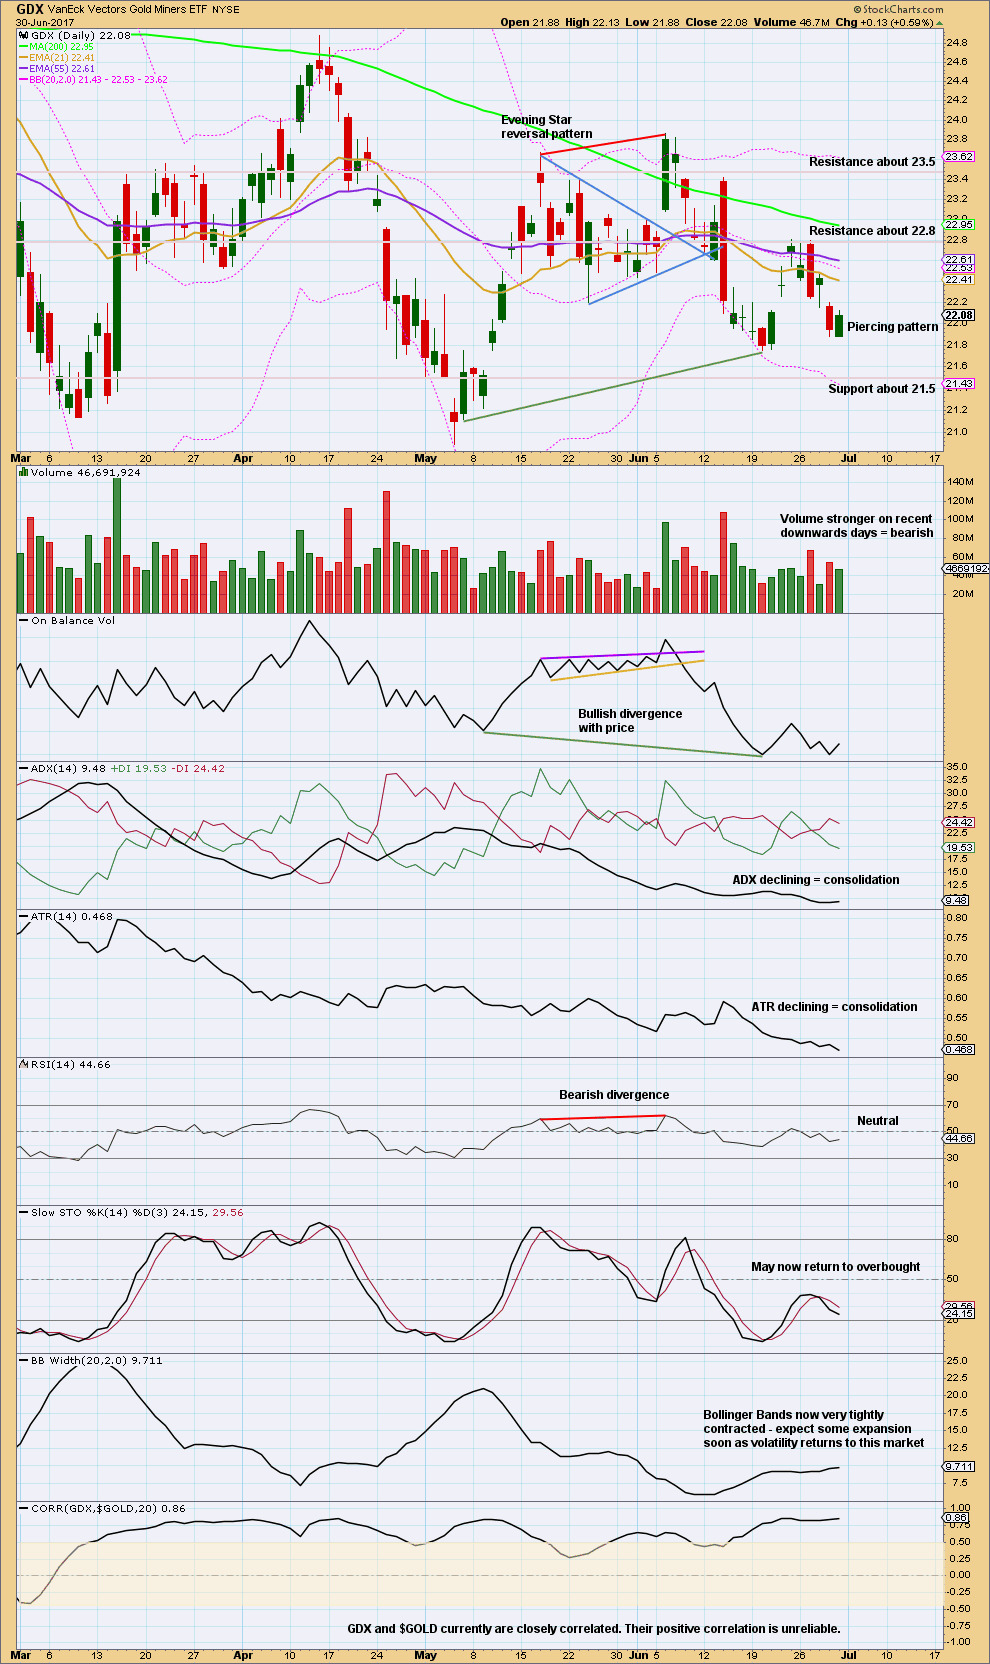
GDX is also consolidating. Resistance is about 22.80 and support is next at 21.5. During the consolidation, it is a day which had a balance of volume downwards that has strongest volume suggesting a downwards breakout is more likely than upwards.
The piercing pattern on Friday is bullish.
What looked like a possible breakout on Thursday is now negated. GDX is still consolidating.
This analysis is published @ 11:51 p.m. EST on 1st July, 2017.
Reverting to original labelling. The triangle was over.
Usually when a triangle finishes price moves quickly out of it. But this one began a little slowly. Which had me a bit stumped, thinking it had to be incomplete.
And that right there is the problem with markets and technical analysis. Usually, or mostly, is not the same as always. Nothing in technical analysis is 100% certain.
Oh well. At least we had the price point 1,237.06 to tell us the triangle must be over and the downwards breakout must be underway, which now it clearly is.
Target 1,160. There may not be big corrections along the way down.
I was waiting. I wanted to buy Alcoa or FreeportMCMoran. But to my surprise – this ones are getting more expensive. Have someone a clue of that. Do they serve us now with a last chance to sell for our favour or what is going on?
… this is fun; Gold price has just about tagged 61.8% of L 1123 / H 1375… imo gold price will likely now remain curtailed below 1223-25 which should set-up a break below 1217-1216…. wow, what a day!
Oil trade continues to set up nicely. Looking for USO to climb above its 50 dsma next few sessions. Anybody short yet?
Gold has to be near a bottom. It is busting through its lower BB today and that situation does not persist for very long. Time to nibble on GDX…
Selling July 21, 21.50 puts and buying 20.50 for credit of 0.30.
I am willing to take assignment of shares at a cost of 21.20 if GDX trading below 21.50 in three weeks.
There is a weekly trendline in oil, that called the last swing high at 52 on futures.
Looks like oil has a date with that line again.
New to the site and just want to say thank you Lara for great interpretation of gold market. Also thanks to Alan for supporting follow up. I just sold my Dust and made a decent profit. I am ok with getting out here. Thank you and Happy July 4th to you both.
Great. You’re welcome 🙂
Thanks. I’m glad to know that you’ve made a tidy profit.
Holiday week
NYSE closes at 1pm EST Monday and Closed on Tues
Sometimes big moves happen during low volume times
This site posts Daily Sentiment Index (DSI) data that normally costs an arm and a leg from the source. Gold at 18% and Silver at 22% is very low. The contrarian would say this is a buy signal, but it could of course go lower.
http://tag618.com
Dreamer. I do hope you have not an arm or a leg. That would have been disastrous.
😂
Sorry, typo. “Have not lost an arm or a leg.”
That’s one expensive chart dude! 🙂
A timely post from TSI-blog on sentiment.
http://tsi-blog.com/2017/07/trying-to-solve-the-sentiment-conundrum/
“It seems that the general public’s stock-market sentiment has not reached an optimistic extreme during the current cycle. Does this mean that there’s a lot more price strength to come or does it mean that the next major price top will happen without the general public having fully embraced the upward trend?”
Thanks Alan.
Sure is the brown up trending S/R line is critical. I am watching GSR top HnS . If it breaks down below in two hour period. This indicator will give a clear warning which way gold will break.
So far not cigar. However there are two other indicators (Gold to $usd ratio, and Swiss franc) warning signal already have given the signal that gold will break upward.
Wait and see.
Papudi. You are absolutely correct. The next couple of hours will be critical. Whether gold breaks down or up ought to be settled here.
Ichimoku Gold 4-Hourly Analysis
Data as at 5:00 am ET, July 3
===========================
So much has changed today. Both the Main and the Alternate counts have to be tweaked, as reported by Dreamer and me separately earlier.
Longer-term price action remains trapped in the triangle pattern in which Primary D is currently underway. The gold market remains in a bearish trend as prices have not managed to break the 1260 short-term resistance. Gold is trading below the (red) cloud in the 4-hourly timeframe. This is exacerbated by a negative crossover of the tenkan-sen with the kijun-sen at 10 am last Friday. Prices are trading below both the tenkan-sen and the kijun-sen, and the gap between prices and the lines have widened in the last 10 hours. It does look as though the market is getting increasingly bearish by the minute.
A word of caution though. Prices are almost at the brown uptrend support line (please see the Weekend Analysis). That line has been tested 4 times already, and is technically very significant. A bounce and a start of a new uptrend move is possible from this area. It is time to protect the shorts, if any. However, should the brown uptrend line be decisively breached, I for one will go all out to short the market. I’m sure many investors are waiting for the same price action. For the more cautious, it might pay to wait for prices to pullback and test the brown uptrend line, now turned resistance, for a final farewell “kiss”.
The triangle of the Alternate Hourly was invalidated with a low below 1237.06.
Perhaps Minor B is a zigzag with Minute B being correct as labelled. Minor C is correct up till Minuette X. Minuette Y is a simple 5-wave drop.
Minor B could end at 1232.14 (Minute C = Minute A), or 1231.14 (Minor B = 1.618 * Minor A). Intermediate B then becomes an expanded flat targeting 1275ish, where Minor C = 2.618 * Minor A.
Let’s see how this plays out. The Main expects a continued price drop after a brief pullback. The Alternate expects a large rise. Getting interesting!
Hi Alan! Don’t look like gold price has the rhythm to get to or past 1245 other than for gradually correct the below 30 RSI of the hourly/4-hourly; imo sustaining below 1242-43 opens up a break below 1233 for 1225ish lol…. Have a fine day. GL all! 🙂
Hi Syed. I do agree with your judgement. Just be cautious though as prices are near a long-term support line and may bounce significantly, as detailed in my Ichimoku update just now.
Thanks Alan will be judicious here and lighten up shorts cmp 1234 and below; but if this has been a break of the triangle below then really one should be looking out for about 1223-22…. Let’s see how this goes, no signs yet of a throw back to 1250s….. 🙂
I should point out that if 21.75 fails to hold, this count is not completely invalidated until a break below 20.89.
21.75 is just the short term invalidation for Intermediate wave 2 as labeled.
https://www.tradingview.com/x/RSHF78du/
The critical point for GDX short term is 21.75. Above that = Bull, below = Bear
https://www.tradingview.com/x/2jlEdtZy/
The triangle may have completed earlier than expected
https://www.tradingview.com/x/byVna6HV/
Dreamer. I had the same feeling. You beat me to the post while I was out for lunch.
Glad we are looking at it the same way. Thanks for all your analysis. I always look forward to reading your work! 🤙 👀
Critical test coming
https://www.tradingview.com/x/V0SFsaOR/
Alan, thank you very much for your analysis on Gold, Silver and Oil. It’s very kind of you to continue to share.
I’ll be updating Oil Elliott wave analysis after Monday’s session. Looking now for some indication the rise is over, and then to find a short entry point for the next wave down.
Lara. It’s my pleasure.
I find it very much easier to organise my thoughts in writing. It forces me to think things through systematically. And once I have my thoughts wrapped up, it is only logical to just put it down in a post. In that way, my thoughts not only benefit myself but also others. I’m really glad to hear from some members that they have profited from my posts.
I’m putting up an analysis on WTIC Crude Oil as I see vast potential for shorting the oil market most likely towards the end of this week. The possible play is from the 47.50 region towards Lara’s 25.59 price target, an almost 50% drop. This market gives a much more straightforward play than the gold market which has not decided yet to be bearish or bullish. The current lethargy in the gold market is extremely frustrating, to put it euphemistically. As Syed had said, “a very miserly diminishing trading range”.
US Oil Weekly Ichimoku Analysis
Data as at market close of June 30
===========================
The WTI Crude Oil market bounced from the low of 42.05, breaking above the 45 level. It looks as if the buyers are trying to push towards the 47.50 level, but I would expect to see a lot of resistance in that area. I’m looking for a breakdown to short the market as there are a lot of headwinds to a continued price rise; the oversupply situation continues to be extreme, but the demand hasn’t been welcoming.
On the Daily Ichimoku Chart, tenkan-sen has been lying below the kijun-sen since June 8. Since the price low at 42.05, prices have tried to rally as the cloud turned briefly green, and this lasts until the end of the coming week. This is supported by the rising MACD. The 5-day RSI had sounded caution though, at 78.55. The first resistance to a continued price rise in the kijun-sen at 47.57, which coincides rather well with the 50 day SMA at 47.21. I don’t think prices can rise much beyond this point, at most the bottom cloud boundary near 48.80. Shorting the market at the top ought to be highly lucrative; Lara had picked 25.59 as the target for the drop.
Thanks Alan!
Your work on gold, silver and oil is very much appreciated. I really like the way you reference Lara’ Elliott counts and price points into your analysis. It really helps to get a clear picture, of the most likely future path for these commodities. I already enjoy your daily gold reports (and profit from them). Please, keep silver and oil as weekend reports, as well. They are the perfect companion to Lara’ already excellent work. Thanks again!
Thanks John for your compliments. I’m glad to hear that you have profited from my posts. That is my intention, that everyone of us should gain something from these markets.
Great trade setting up in Oil and the 200 dsma gives a great trigger. USO last few times moved slightly above it. The first red candle printed above the line is the signal to enter short. I will enter trade with a bearish 9.0/9.5 USO bearish call spread (July 21) in anticipation of move above the line and exit short leg when trade triggers. Easy peasy.
Next move down should take USO well below 8.50
SILVER Weekly Ichimoku Analysis
Data as at market close of June 30
=============================
Mirroring gold, the silver market initially plunged on Monday as far as 16.23, just at the brown long-term uptrend line. The subsequent bounce brought prices towards the 17.00 level where the bottom cloud boundary currently is, reaching as far as 16.92. Just like gold, the 50 day SMA capped its progress, and the classic “kiss of death” should be underway.
In the Daily Ichimoku Chart (not shown), prices continue to trade below both the tenkan-sen and the kijun-sen, and the cloud has been red for more than half a month already. The tenkan-sen made a negative crossover with the kijun-sen on June 20, one day earlier than gold’s, adding to the woes of a bearish market. Moving forward, prices ought to drop this coming week, playing out the “kiss of death” script. In the case of silver, this is more pronounced as the cloud is red into the near future, unlike gold. It only remains to be seen whether prices can drop below the brown uptrend line. I expect that it would not do so. This line is even more supportive than gold’s. It is in force for more than a year, compared to the 6 months in the case of gold. In addition, it had been successfully tested five times, more than gold’s three.
If trading silver, it would be wise to closely monitor the brown support line for the first signs of trouble. A break below that, and the bear rules.
Commercials are dumping shorts and going long . Specs are doing the opposite. The spec Longs are about 93.8 k while the spec short position is about 58.3 k contracts. That is about 35.5 thousand contracts net long. The specs take the opposite side of the commercials for the most part. At the bottom the specs were about 20k contracts net long silver in Jan 2016 before a big rally. At recent tops it was about 100 k net long for specs. So if we do break down below this line it may not be for a long time and there may be a swift reversal. This should be a major rally afterwards if it occurs and I think if you buy silver and gold here it will be higher in the next several months. Keeping your powder dry for a major buying opportunity is probably the wise bet. Longer term bets for gold and silver will probably do well and short term bets, out a few months, betting short may also do well, imo.
End of Week Analysis
Data as at the market close of June 30
=============================
Gold markets began the week with a plunge as far as 1237.06, but found enough support at the brown uptrend line to turn things around and break above the 1240 level. The brown uptrend line has been massively supportive, having been tested three times. On the rebound, prices reached as high as 1253.82 on Wednesday before gravity again took its toll. The 1260 region has been highly resistive; the 50 day SMA had been capping the progress. The rebound towards the 50 day SMA and its subsequent rejection appears to be the textbook definition of the “kiss of death”. The fall in prices on Friday was quite sluggish, not the strong momentum that one would expect from this price pattern.
The Daily Ichimoku Chart shows that gold prices have closed the week below the bottom cloud boundary. The cloud would be entering a short period next week when it is briefly red, indicating a slight pullback. Moreover, the tenkan-sen had been lying below the kijun-sen since June 21, and the gap between the two had been widening. This leads me to infer that gold prices would continue to hammer at the brown uptrend support line in the coming week. If Ichimoku predicts correctly, this will be followed by a rise in price until August, testing the 1260 level. This means that the brown uptrend line will again prove its mettle. Buyers will return to buy the market, pushing up prices.
I would be waiting for this pullback to end before going long into at least the beginning of August, following the contour of the cloud. (Please note that Ichimoku analysis can only project 26 trading days into the future). Currently, the movements in the gold miners indicate that it is easier to go the upside, so that’s exactly how I’m looking at the market. This has already been strongly manifested on Friday when gold prices tumbled, yet the miners have bucked the trend, rising instead. I had spent the whole night thinking about this paradox and this is the most logical conclusion I can think of. I believe that people who trade in the highly leveraged ETFs, NUGT and DUST, are anything but dumb. At that level of leverage, they cannot afford to be. Their actions have very often proved their sagacity.