
Sideways movement fits expectations following the strong downwards day of the 3rd of July, which was also expected. The Elliott wave count is nicely predicting price behaviour at this time, and it has substantial support from classic technical analysis.
Summary: Expect price to now move sideways and slowly higher over a few days to end about 1,237. This may offer a good entry point for a short position.
It is strongly recommended that members keep all trades with the trend: the trend is down. Always use a stop and invest only 1-5% of equity on any one trade. Stops should technically be set just above 1,248.09, profit target is now at 1,160.
New updates to this analysis are in bold.
Last monthly charts and alternate weekly charts are here, video is here.
Grand SuperCycle analysis is here.
WEEKLY CHART
Click chart to enlarge.
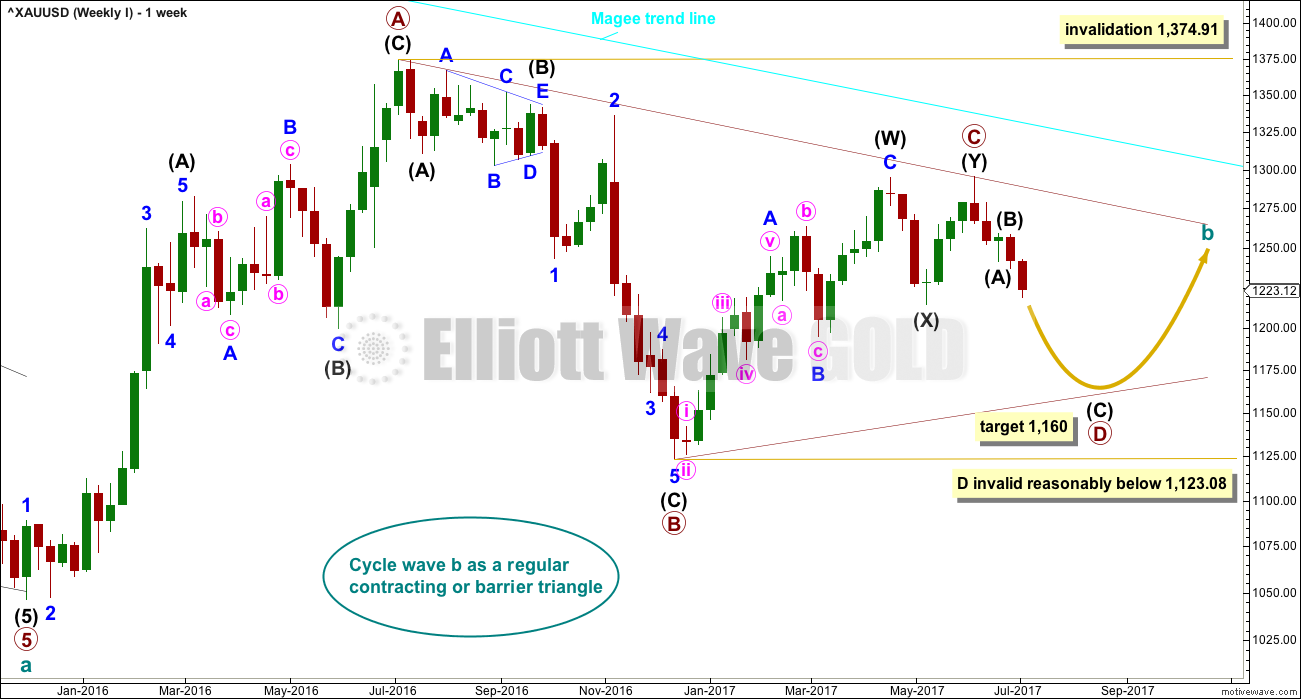
The Magee bear market trend line is added to the weekly charts. This cyan line is drawn from the all time high for Gold on the 6th of September, 2011, to the first major swing high within the following bear market on the 5th of October, 2012. This line should provide strong resistance.
At this stage, a triangle still looks most likely and has the best fit for cycle wave b.
Within a triangle, one sub-wave should be a more complicated multiple, which may be primary wave C. Primary wave C may not move beyond the end of primary wave A above 1,374.91. This invalidation point is black and white.
At this stage, it looks like primary wave C is now complete at the hourly and daily chart level. However, at the weekly chart level, it looks possible it may continue higher. This possibility must be acknowledged while price remains above 1,214.81. Within intermediate wave (Y), minor wave B may not move beyond the start of minor wave A.
Primary wave D of a contracting triangle may not move beyond the end of primary wave B below 1,123.08. Contracting triangles are the most common variety.
Primary wave D of a barrier triangle should end about the same level as primary wave B at 1,123.08, so that the B-D trend line remains essentially flat. This involves some subjectivity; price may move slightly below 1,123.08 and the triangle wave count may remain valid. This is the only Elliott wave rule which is not black and white.
There are three alternate wave counts that have been published in the last historic analysis, which is linked to above. They are all very bullish. They will only be published on a daily basis if price shows them to be true with a new high now above 1,295.65.
DAILY CHART
Click chart to enlarge.
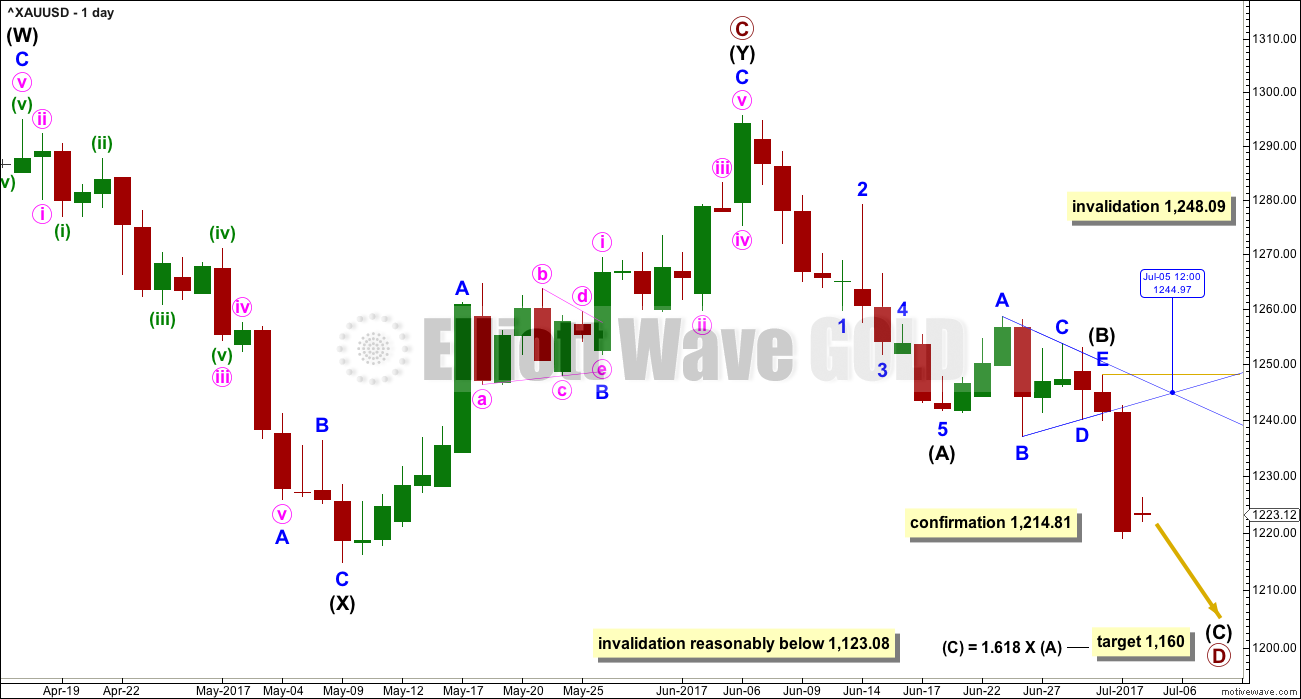
Intermediate wave (Y) may now be a complete zigzag if it is accepted that a triangle completed in the position labelled minor wave B. This has a perfect fit on the hourly chart.
A new low below 1,214.81 could not be minor wave B within intermediate wave (Y) and would provide strong confirmation that intermediate wave (Y) is over.
A common range for triangle sub-waves is from about 0.8 to 0.85 the prior sub-wave, this gives a range for primary wave D from 1,158 to 1,149. A Fibonacci ratio is used to calculate a target, which is just above this common range, for intermediate wave (C) now that intermediate waves (A) and (B) look to be complete.
The point in time when an Elliott wave triangle’s trend lines cross over often (not always) sees a trend change. That point in time is for the 5th of July for this triangle. This trend change is not always a large one; it may be a smaller change within a consolidation.
If primary wave C is correctly labelled as a double zigzag, then primary wave D must be a simple A-B-C structure and would most likely be a zigzag. Within intermediate wave (C), no second wave correction may move beyond the start of its first wave above 1,248.09.
Intermediate wave (A) lasted only ten days. Intermediate wave (B) has lasted eight days. As intermediate wave (C) is expected to be longer in length than intermediate wave (A), it may also be longer in duration and may last a Fibonacci thirteen days as the first expectation or a Fibonacci twenty one days as the next expectation.
Primary wave A lasted 31 weeks, primary wave B lasted 23 weeks, and primary wave C may have been complete in 25 weeks.
Primary wave D should be expected to last at least 8 weeks (but most likely longer). The next Fibonacci ratio in the sequence would be a Fibonacci 13 and then 21.
HOURLY CHART
Click chart to enlarge.
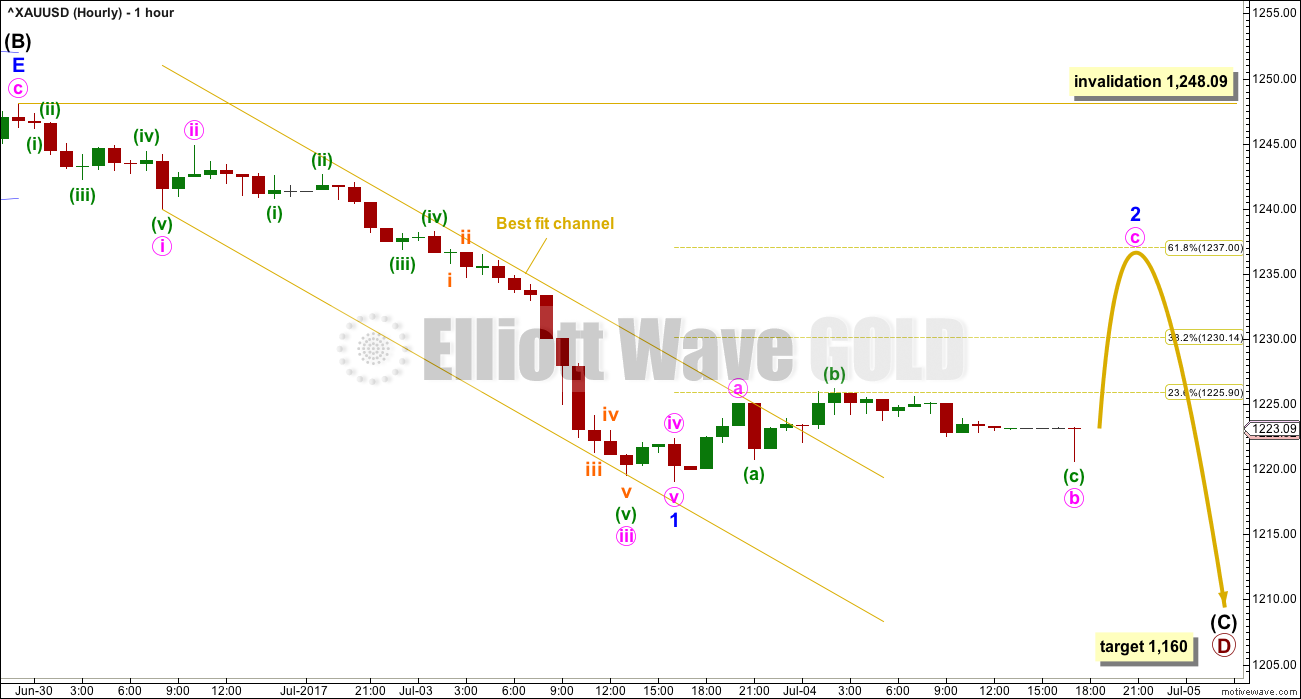
This hourly chart shows all of intermediate wave (C) so far.
Intermediate wave (C) must subdivide as a five wave motive structure, either an impulse (much more likely) or an ending diagonal. Let us assume the more likely structure until proven otherwise.
So far a five wave structure downwards looks complete for minor wave 1. Minor wave 2 may correct to either the 0.382 or 0.618 Fibonacci ratios of minor wave 1. The 0.618 Fibonacci ratio is slightly more likely. This may be a typical curve back up to retest resistance at prior support after the breakout.
Upwards and sideways movement for the 4th of July session was very quiet, and has managed to break out of the best fit channel containing minor wave 1. This is a strong indication that minor wave 1 is over and minor wave 2 has begun. Expect minor wave 2 may last a Fibonacci three or five days in total.
Minor wave 2 may not move beyond the start of minor wave 1 above 1,248.09.
The trend is down. All trades should be with the trend. Always use a stop. Invest only 1-5% of equity on any one trade.
TECHNICAL ANALYSIS
WEEKLY CHART
Click chart to enlarge. Chart courtesy of StockCharts.com.
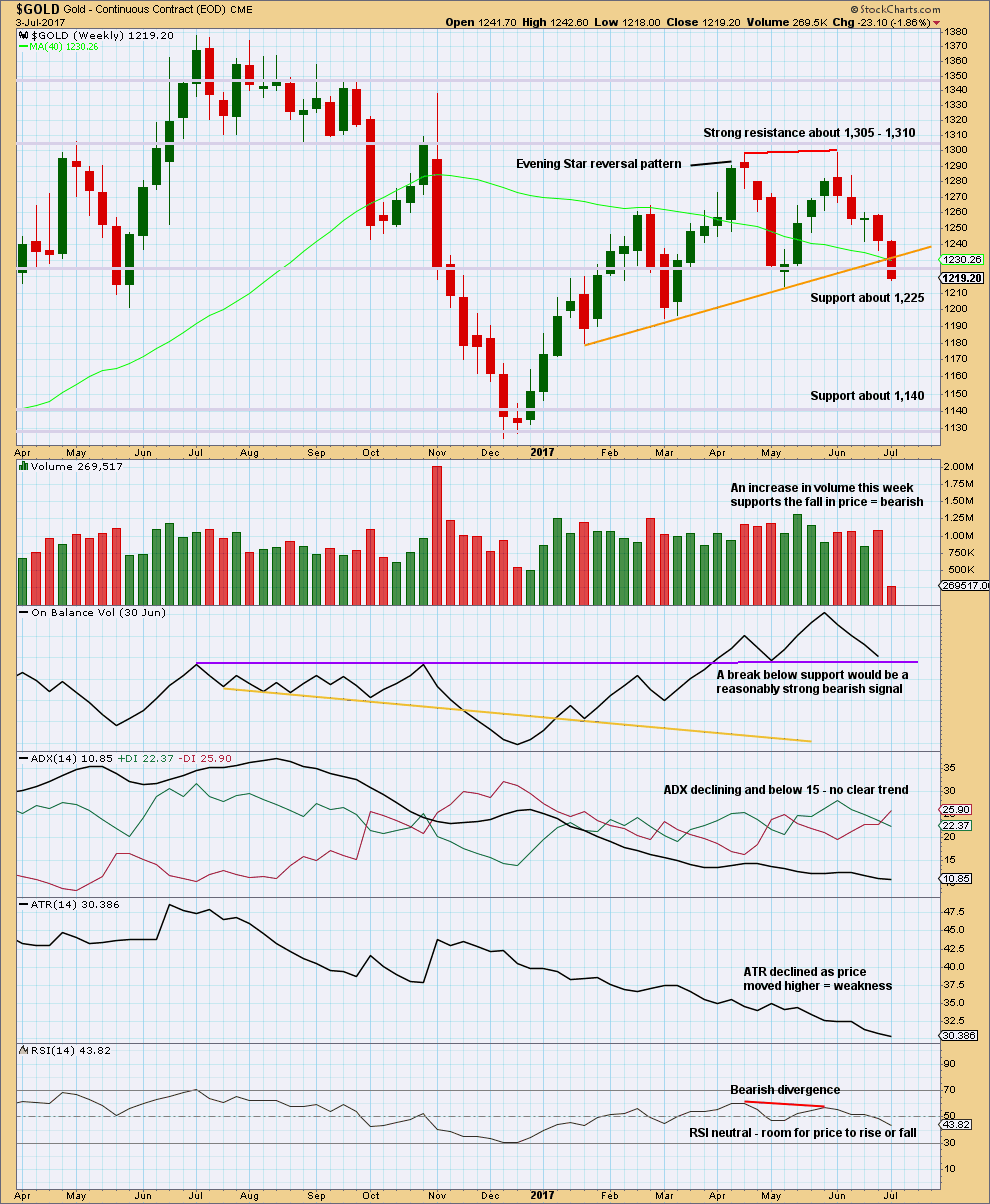
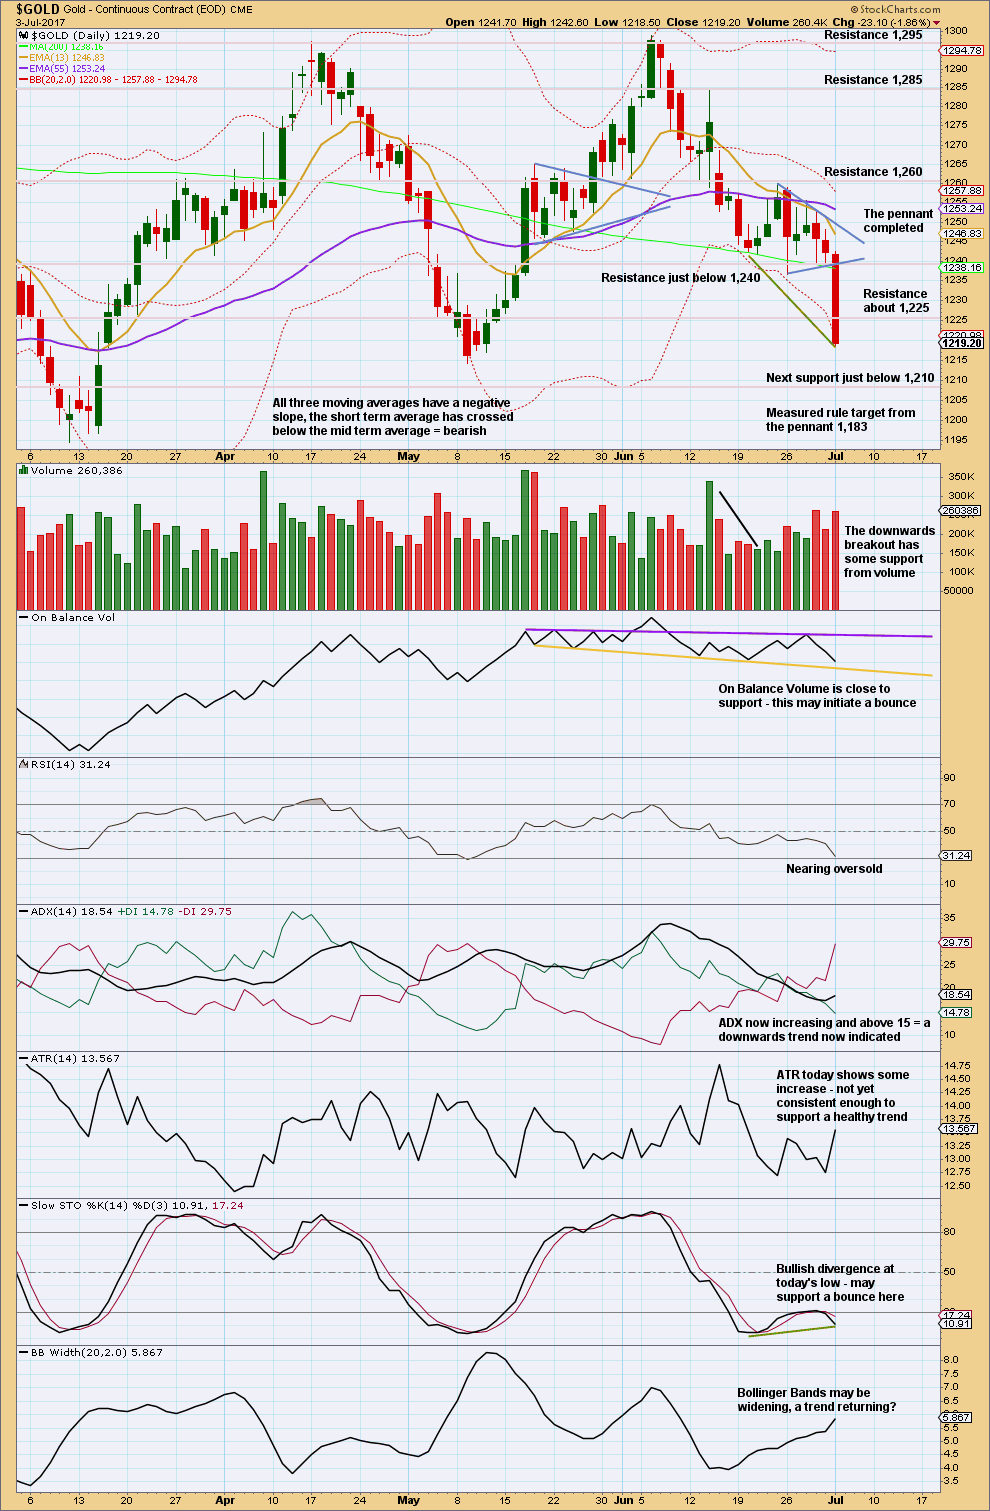
The weekly chart is updated today: a trend line is added (orange) to show the breach on the 3rd of July. This break below support is significant. This is a strong bearish signal.
Volume last week supports the downwards trend at least short term.
If On Balance Volume breaks below the purple support line, it would offer a bearish signal. If it bounces up from this line, it would offer a bullish signal.
Declining ATR for a long time fits neatly with the expectation of a large triangle unfolding.
DAILY CHART
Click chart to enlarge. Chart courtesy of StockCharts.com.
StockCharts data is New York session only. Because New York is closed for the 4th of July holiday there is no new data to analyse today. The classic technical analysis for Gold and GDX remains the same.
The pennant has been completed and is followed by a downwards breakout that has support from volume. Have confidence in the downwards trend at this time.
Pennants are reliable continuation patterns. I want to draw members attention to a prior pennant on this chart from the 18th to 26th of May: price broke out upwards as expected from that pennant on the 26th of May. After the breakout price curved around effecting another small consolidation that found its low four days later. This low was very close to the upper edge of the pennant pattern. This was a typical curve around to retest support at prior resistance.
Expect it is fairly likely (but not certain) that price may do the same again here and now, in reverse. Look out now for a curve back up and sideways to retest resistance at prior support. That resistance may now be about 1,235 – 1,240. This fits neatly with the Elliott wave expectation for minor wave 2 to bounce up to about 1,237.
If price behaves in this typical fashion, it would provide a high confidence entry point for a short position that may be held for weeks. Some patience is required to wait for the set up.
Stochastics and On Balance Volume support this view.
GDX
DAILY CHART
Click chart to enlarge. Chart courtesy of StockCharts.com.
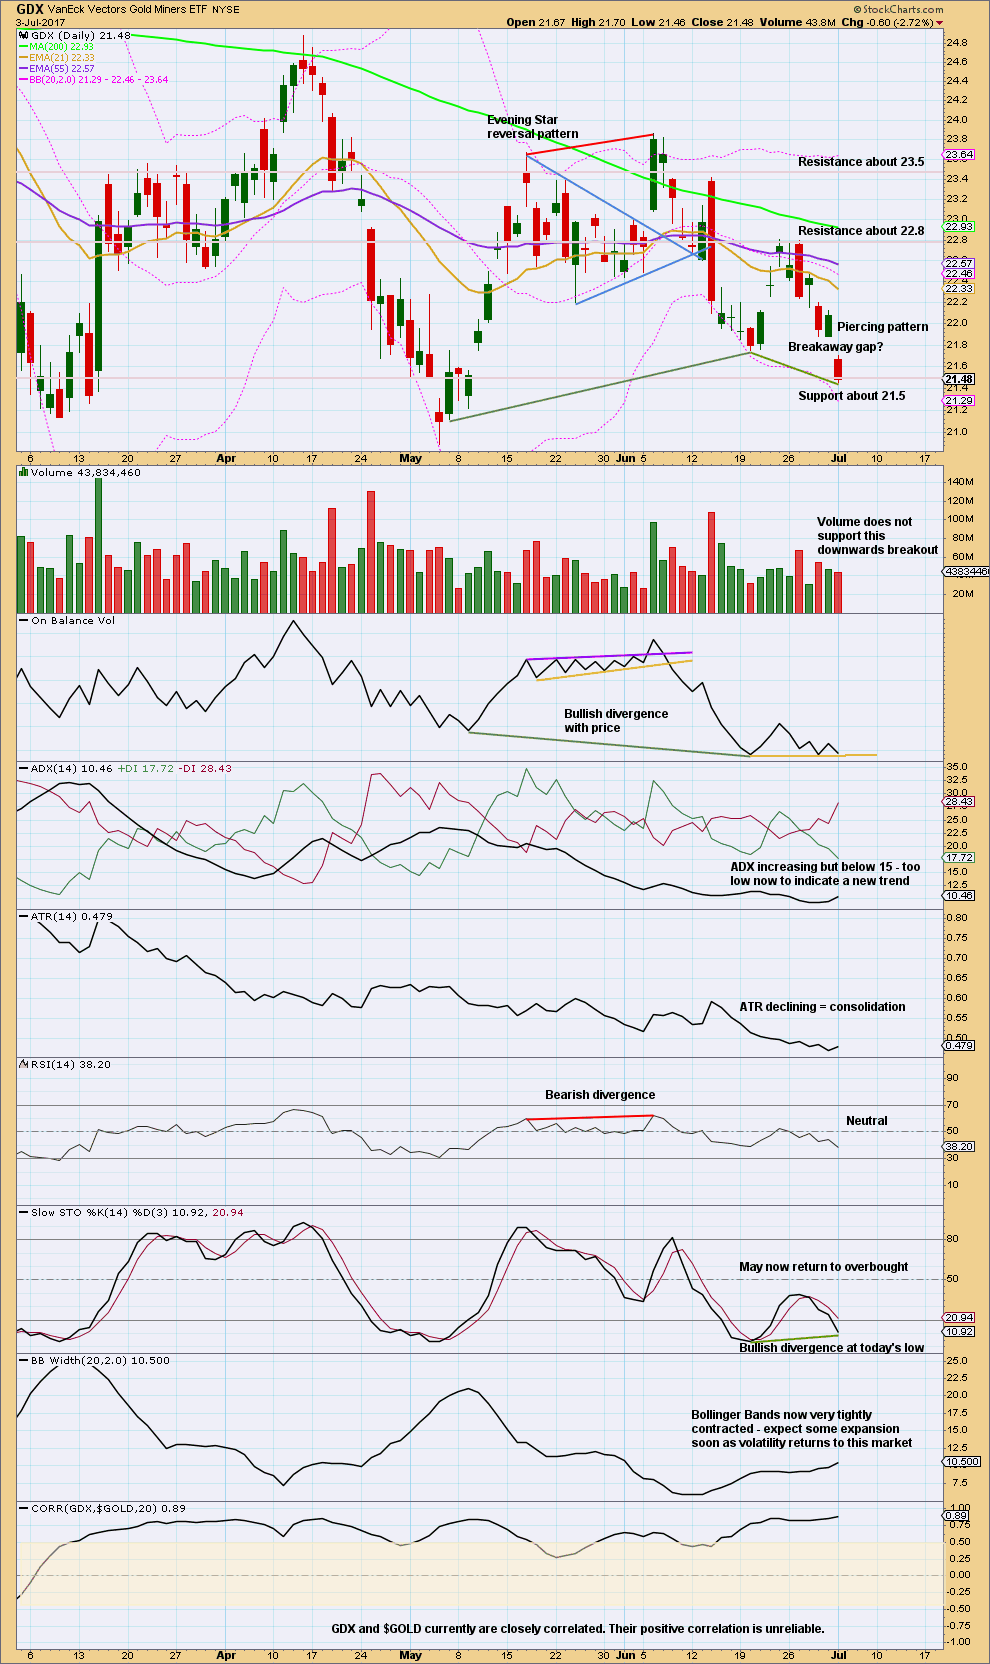
Price has broken out downwards from the consolidation, but the breakout is suspicious because it is not supported by volume. But we must keep in mind that not all downwards breakouts are supported by volume though; the market can fall of its own weight.
If the gap today is correctly labelled as a breakaway gap, then the upper edge should offer resistance. Breakaway gaps are not usually closed. This resistance is at 21.88.
Look out for a curve up now to retest resistance at prior support.
A new support line is added today to On Balance Volume. This along with divergence with Stochastics and price supports the idea of a curve up from here.
This analysis is published @ 06:11 p.m. EST.
The new low looks like wave B within a flat correction. I have a rather wide $5 target range for minor 2 now to end.
PMBull gold price data is unreliable. Did Gold hit 1214 or below this morning?
No. The barchart low was 1,217.61
Thanks Dreamer. Got saved today. Lara’s (unpublish) bull wave count still alive.
What’s going on with oil?
(now $45.50/barrel)
Is this the big plunge?
This is most likely the B wave in micro 2. If correct, the C wave will reach the target of 47.50 – 48.00.
Thanks Alan,
much appreciated!
Not necessarily. This move looks pretty strong. I’m waiting to see what the volume is like. Will be updating Oil charts in comments on last Oil analysis later today.
aaaaaannnd… it’s rebounding strongly.
sitting on the fence on this one
has anyone else noticed StockCharts data for Oil and Gold is a duplicate of 3rd July today? most frustrating.
Mixed signals in oil today both DRIP (3X bear ETF) and USO up. DRIP may be leading the price action. I am short USO.
Imo Gold price should really be heading for 1210-1208 range from cmp 1220s…. Let’s see…GL all!
So we got a lower low at 1,217.61 so far, and now gold is moving back up. If a new high above 1,228.74 can be reached, then Minor 2 may be an expanded flat.
If price fails to make a new high above 1,228.74, then Minor 2 is likely complete as a very shallow correction.
Lara’s EW analysis is great. Her wave counts called the turn of gold early.
I have been watching GSR a reliable indicator for metal nominal price direction. A BO here on hour chart is the point where short position can be initiated.
GSR just BO of consolidation and is above 76.
Lara:”This may offer a good entry point for a short position.”
Gold may not go to 1237 now.
Folks. I can’t produce the Ichimoku report today. StockCharts is still on holiday. TradingView charts are all fouled up. Probably they are also on holiday. Fortunately, nothing much transpired yesterday. Prices are still in a consolidation mood, without any inspiration for a decent pullback yet. We may have to wait until the US market opens for some action to take place. Hopefully, traders are awake from their indulgences yesterday, a day of unhealthy barbecue and booze.
Wow! If that plunge was only minor one, minor three, and possibly five should be doozies!
Hello every one,
Alan has been very generous to provide his excellent analysis day after day. His analysis not only includes added benefits of EW counts but also ichimoku cloud TA indicator as added benefit.
For those who may not know what Ichmoku cloud represent and how it is calculated below is the link from Stock charts.com explaining the details of this indicator.
This reading may enhance your understanding of Alan’s analysis and confidence in it.
Enjoy:
http://stockcharts.com/school/doku.php?st=ichimoku+cloud&id=chart_school:technical_indicators:ichimoku_cloud
thank you very much… to you and Alan,
very kind of you to share your knowing ….
Thanks Papudi for your compliments as well as posting this excellent reference on the Ichimoku Cloud, technically called kumo. I personally like to use this indicator because I’m too lazy to delve through the large number of indicators available to get a good snapshot of the market. I must compliment Lara and Dreamer for their diligence in doing so. They have done really excellent work in that area.
In essence, Ichimoku was not created by a trader, but by a journalist who needs to see the big picture, and that rather quickly. This is why it is so useful in the heat of trading where every second counts. I’m not into buy-and-hold and so fast facts are a must. Once you get into the hang of it, you will find that it is very easy to use. At a glance, you will be able to see the overall trend, the price momentum, the resistance/support points, and the future price direction (albeit only up to 26 days).
I use Elliott Wave count to see the really big picture. EW can be used for very small timeframes provided one has the skill and patience to count down to the sub-waves at nth degree. Any mistake will cascade and create havoc. Ichimoku is useful during actual trading, and when combined with candlestick analysis, often results in a rock-solid interpretation of, and the forecast to, the immediate future price movements. Unless, of course, we encounter much more formidable opponents: manipulators and HF algorithms. There is no defence to those.