
More sideways and upwards movement was expected. An outside day which closed higher fits expectations.
Summary: Expect price to continue higher to about 1,233 to 1,237. This may offer a good entry point for a short position.
It is strongly recommended that members keep all trades with the trend: the trend is down. Always use a stop and invest only 1-5% of equity on any one trade. Stops should technically be set just above 1,248.09, profit target is now at 1,160.
New updates to this analysis are in bold.
Last monthly charts and alternate weekly charts are here, video is here.
Grand SuperCycle analysis is here.
WEEKLY CHART
Click chart to enlarge.
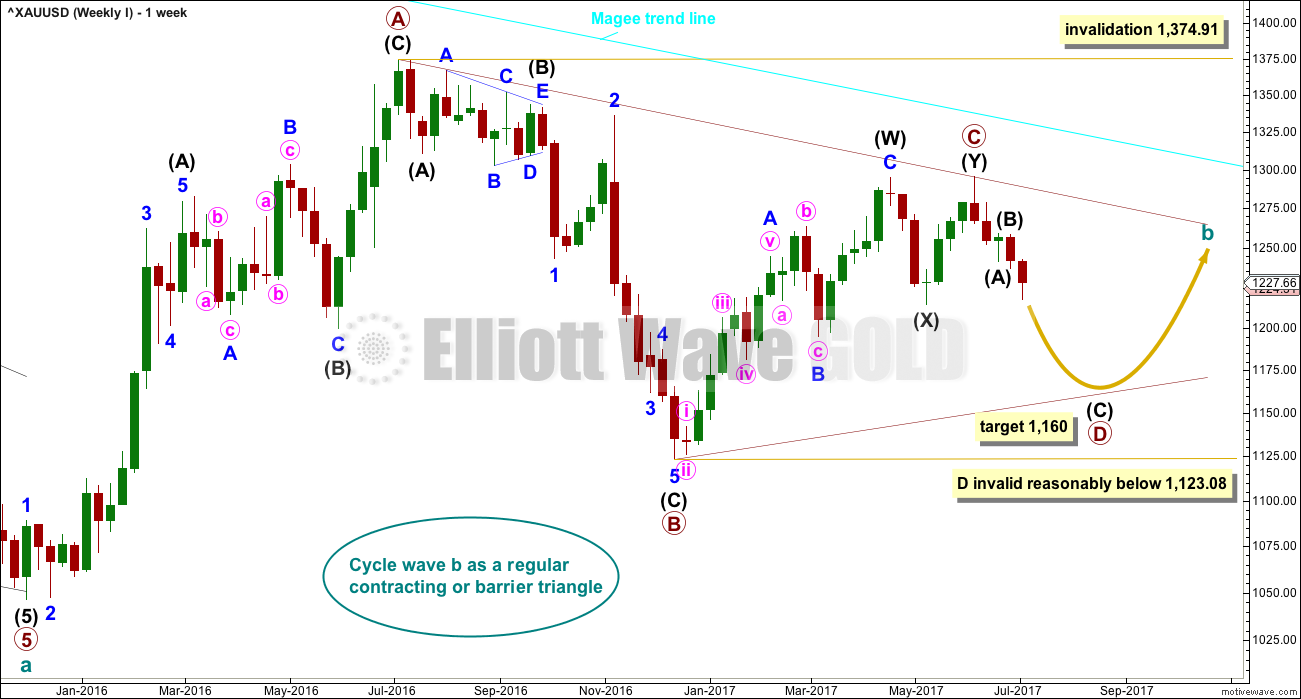
The Magee bear market trend line is added to the weekly charts. This cyan line is drawn from the all time high for Gold on the 6th of September, 2011, to the first major swing high within the following bear market on the 5th of October, 2012. This line should provide strong resistance.
At this stage, a triangle still looks most likely and has the best fit for cycle wave b.
Within a triangle, one sub-wave should be a more complicated multiple, which may be primary wave C. Primary wave C may not move beyond the end of primary wave A above 1,374.91. This invalidation point is black and white.
At this stage, it looks like primary wave C is now complete at the hourly and daily chart level. However, at the weekly chart level, it looks possible it may continue higher. This possibility must be acknowledged while price remains above 1,214.81. Within intermediate wave (Y), minor wave B may not move beyond the start of minor wave A.
Primary wave D of a contracting triangle may not move beyond the end of primary wave B below 1,123.08. Contracting triangles are the most common variety.
Primary wave D of a barrier triangle should end about the same level as primary wave B at 1,123.08, so that the B-D trend line remains essentially flat. This involves some subjectivity; price may move slightly below 1,123.08 and the triangle wave count may remain valid. This is the only Elliott wave rule which is not black and white.
There are three alternate wave counts that have been published in the last historic analysis, which is linked to above. They are all very bullish. They will only be published on a daily basis if price shows them to be true with a new high now above 1,295.65.
DAILY CHART
Click chart to enlarge.
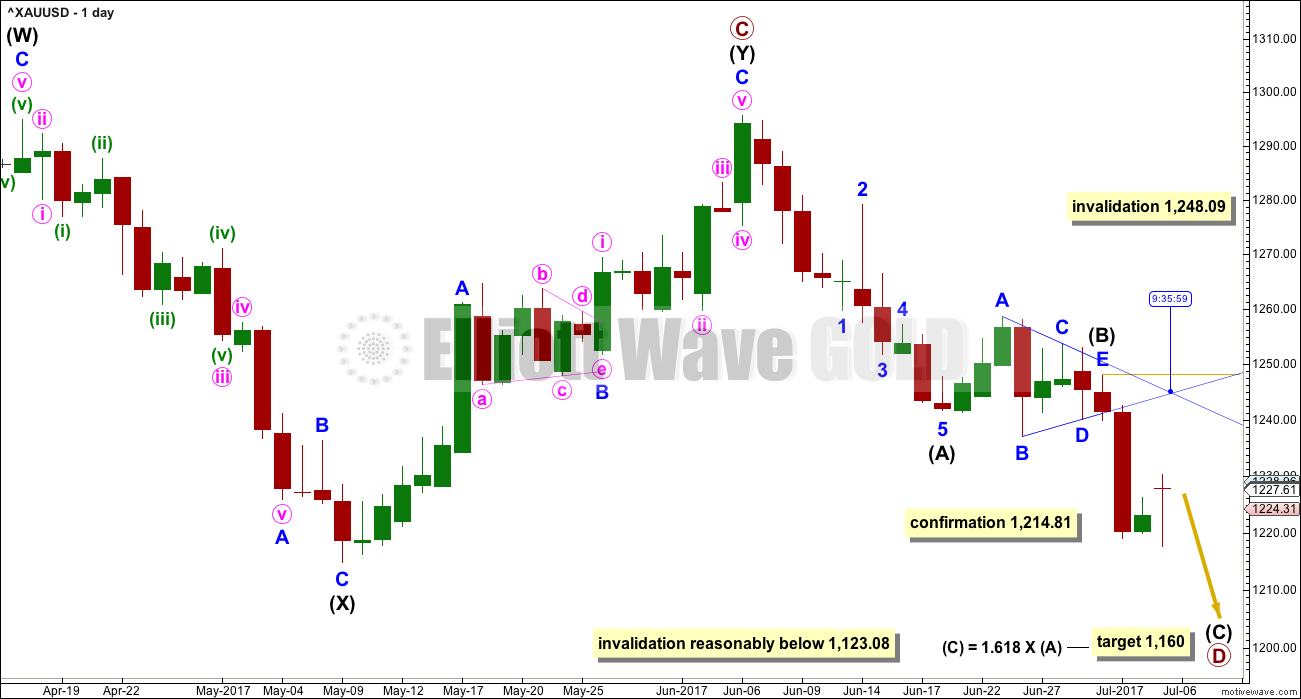
Intermediate wave (Y) may now be a complete zigzag if it is accepted that a triangle completed in the position labelled minor wave B. This has a perfect fit on the hourly chart.
A new low below 1,214.81 could not be minor wave B within intermediate wave (Y) and would provide strong confirmation that intermediate wave (Y) is over.
A common range for triangle sub-waves is from about 0.8 to 0.85 the prior sub-wave, this gives a range for primary wave D from 1,158 to 1,149. A Fibonacci ratio is used to calculate a target, which is just above this common range, for intermediate wave (C) now that intermediate waves (A) and (B) look to be complete.
The point in time when an Elliott wave triangle’s trend lines cross over often (not always) sees a trend change. That point in time is for the 5th of July for this triangle. This trend change is not always a large one; it may be a smaller change within a consolidation.
If primary wave C is correctly labelled as a double zigzag, then primary wave D must be a simple A-B-C structure and would most likely be a zigzag. Within intermediate wave (C), no second wave correction may move beyond the start of its first wave above 1,248.09.
Intermediate wave (A) lasted only ten days. Intermediate wave (B) has lasted eight days. As intermediate wave (C) is expected to be longer in length than intermediate wave (A), it may also be longer in duration and may last a Fibonacci thirteen days as the first expectation or a Fibonacci twenty one days as the next expectation.
Primary wave A lasted 31 weeks, primary wave B lasted 23 weeks, and primary wave C may have been complete in 25 weeks.
Primary wave D should be expected to last at least 8 weeks (but most likely longer). The next Fibonacci ratio in the sequence would be a Fibonacci 13 and then 21.
HOURLY CHART
Click chart to enlarge.
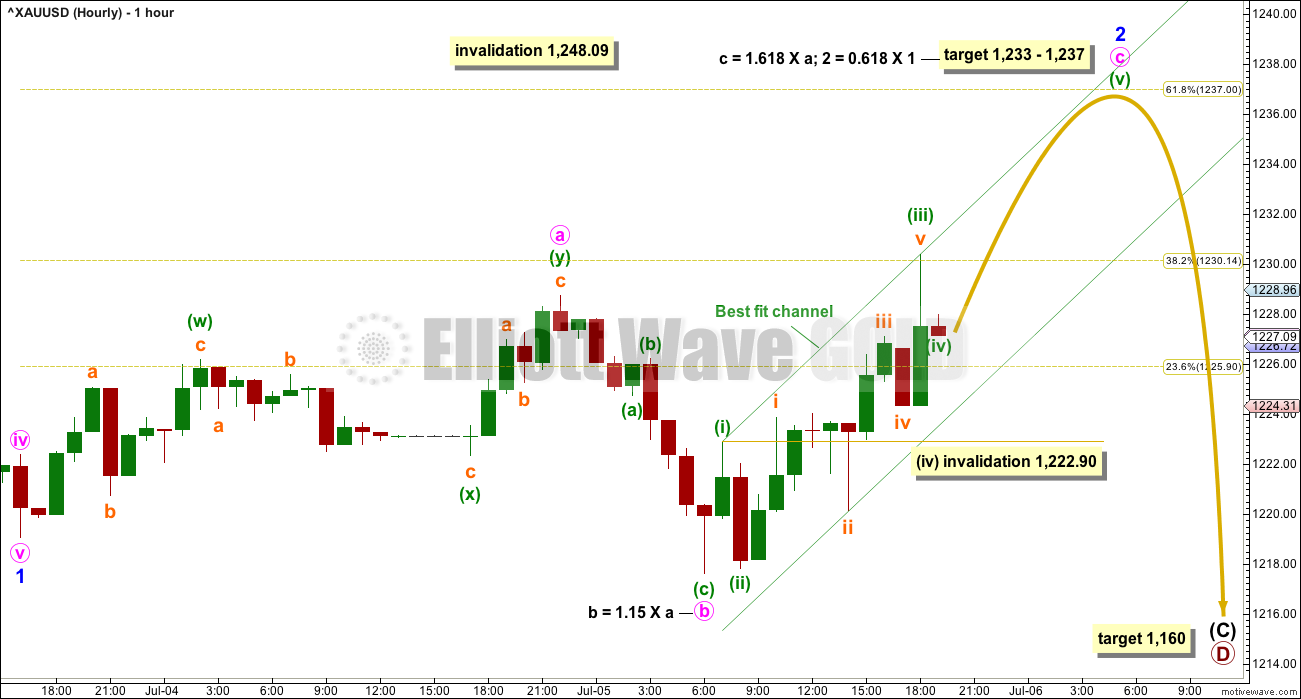
Today’s focus on the hourly chart is on the structure of minor wave 2.
The slight new low during Wednesday’s session looks like minute wave b of an expanded flat for minor wave 2. Expanded flats are very common structures.
It is just possible now that minute wave c could be over; it has made a new high above the end of minute wave a at 1,228.74, so a truncation and a very rare running flat is avoided. However, the structure of minute wave c does not look complete yet.
Within minute wave c, the correction for minuette wave (iv) may not move into minuette wave (i) price territory below 1,222.90.
Expanded flats do not fit neatly within channels. So to indicate when they are complete a channel about their C waves should be used.
While minute wave c is incomplete, price should remain within the best fit channel containing it. When the channel is breached by downwards movement, that shall be the earliest indicator that minute wave c is over and minor wave 2 might be over.
Minor wave 2 may not move beyond the start of minor wave 1 above 1,248.09.
The trend is down. All trades should be with the trend. Always use a stop. Invest only 1-5% of equity on any one trade.
TECHNICAL ANALYSIS
WEEKLY CHART
Click chart to enlarge. Chart courtesy of StockCharts.com.
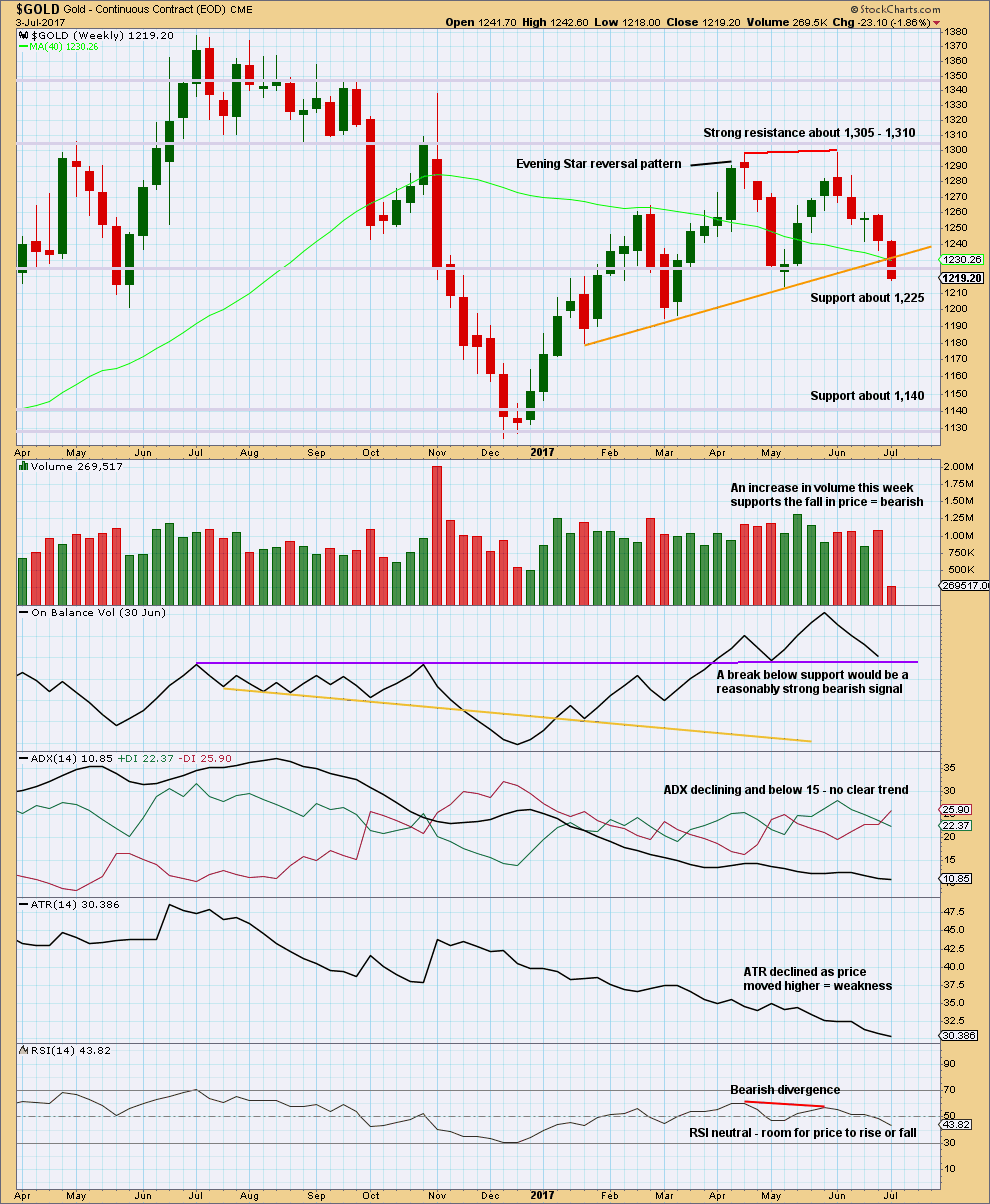
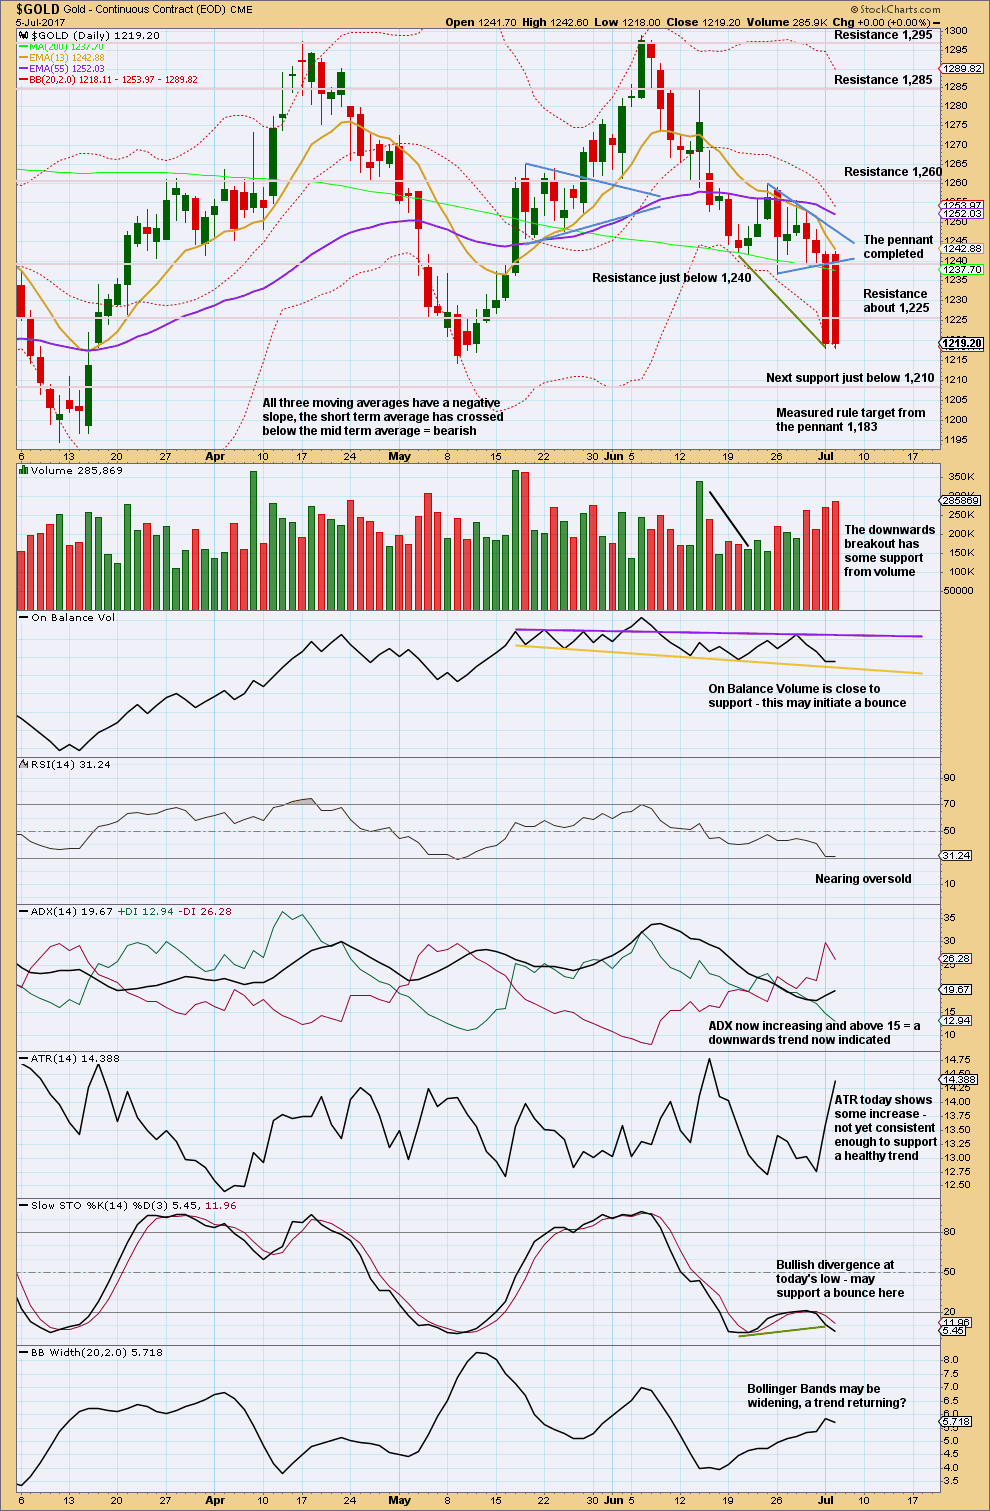
The weekly chart is updated: a trend line is added (orange) to show the breach on the 3rd of July. This break below support is significant. This is a strong bearish signal.
Volume last week supports the downwards trend at least short term.
If On Balance Volume breaks below the purple support line, it would offer a bearish signal. If it bounces up from this line, it would offer a bullish signal.
Declining ATR for a long time fits neatly with the expectation of a large triangle unfolding.
DAILY CHART
Click chart to enlarge. Chart courtesy of StockCharts.com.
As you can see on this chart from StockCharts the candlestick for the 5th of July is not correct. When StockCharts fixes this problem, then classic analysis will be updated and a new chart published.
The pennant has been completed and is followed by a downwards breakout that has support from volume. Have confidence in the downwards trend at this time.
Pennants are reliable continuation patterns. I want to draw members attention to a prior pennant on this chart from the 18th to 26th of May: price broke out upwards as expected from that pennant on the 26th of May. After the breakout price curved around effecting another small consolidation that found its low four days later. This low was very close to the upper edge of the pennant pattern. This was a typical curve around to retest support at prior resistance.
Expect it is fairly likely (but not certain) that price may do the same again here and now, in reverse. Look out now for a curve back up and sideways to retest resistance at prior support. That resistance may now be about 1,235 – 1,240. This fits neatly with the Elliott wave expectation for minor wave 2 to bounce up to about 1,237.
If price behaves in this typical fashion, it would provide a high confidence entry point for a short position that may be held for weeks. Some patience is required to wait for the set up.
Stochastics and On Balance Volume support this view.
GDX
DAILY CHART
Click chart to enlarge. Chart courtesy of StockCharts.com.
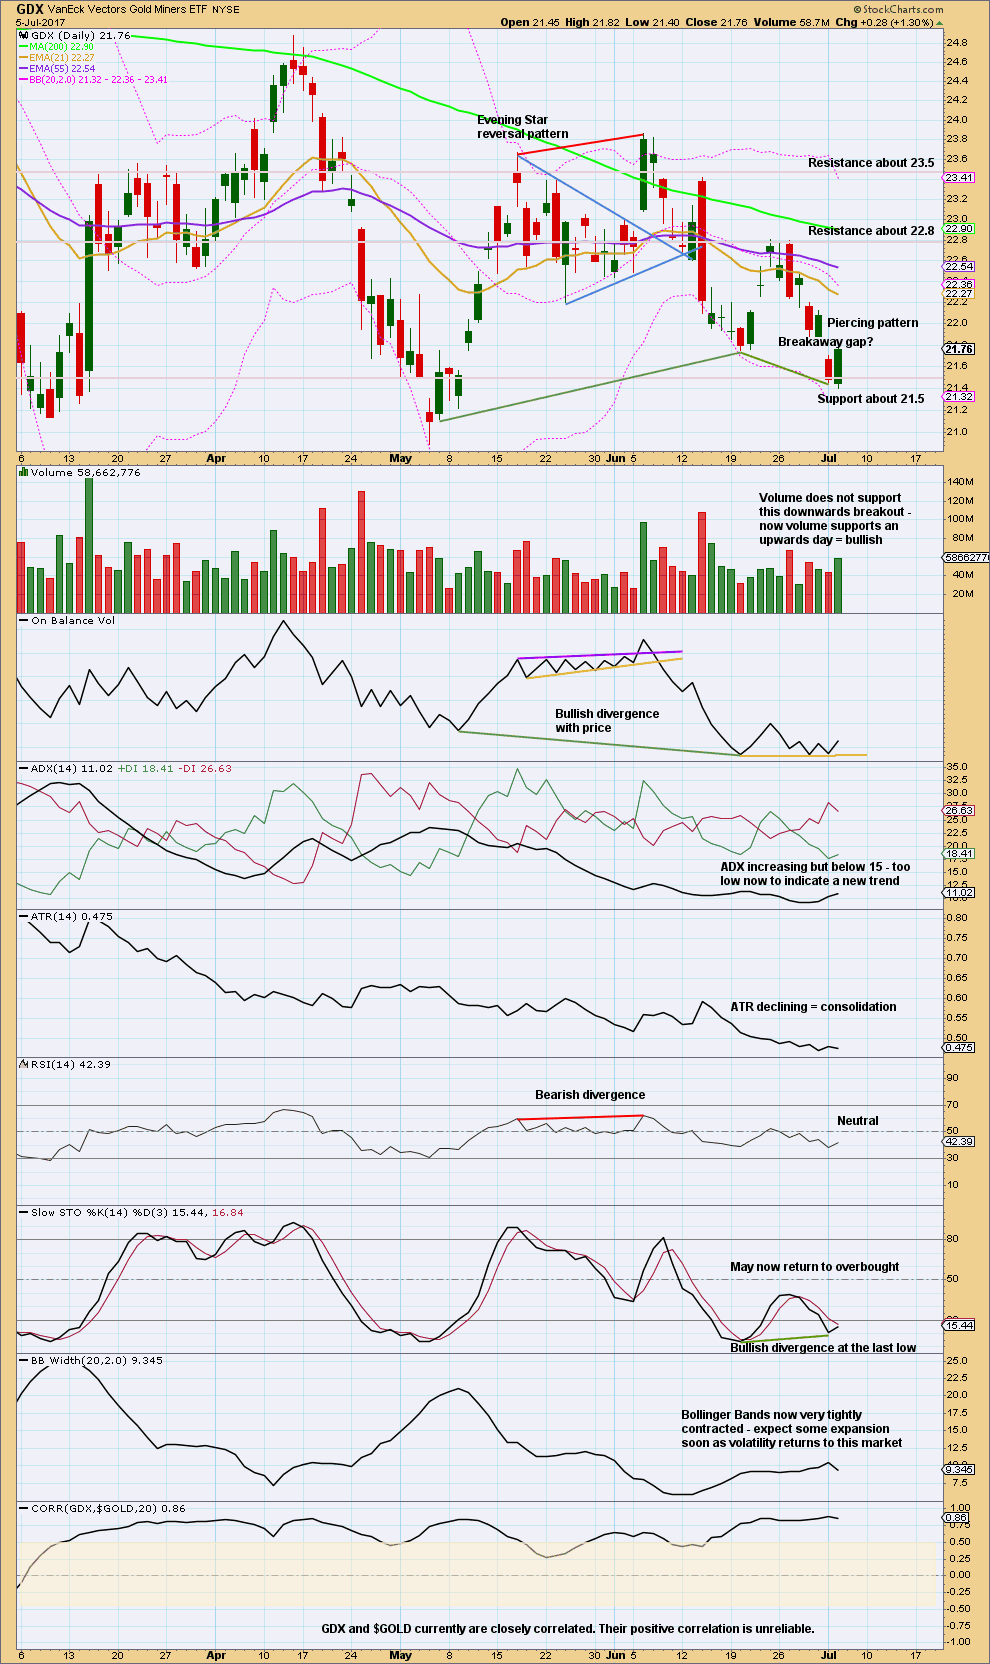
Price has broken out downwards from the consolidation, but the breakout is suspicious because it is not supported by volume. But we must keep in mind that not all downwards breakouts are supported by volume though; the market can fall of its own weight.
If the gap is correctly labelled as a breakaway gap, then the upper edge should offer resistance. Breakaway gaps are not usually closed. This resistance is at 21.88.
Today’s upwards movement looks so far like a typical curve back up to retest resistance at prior support, as long as the gap is not closed.
The yellow support line on On Balance Volume provided support and initiated a bounce. Volume is bullish.
This analysis is published @ 07:55 p.m. EST.
With a low so far at 1,222.72 (Barchart), the hourly count is invalidated. Minor 2 is likely complete. Going down 📉
Alternatively, Minor 2 could be 1219.05 – 1228.95 – 1222.72 – Minute C.
Minute C = 1232.62 if Minute C = Minute A.
It could go either way tomorrow with the jobs report. 😴 for now
I have posted an update on oil in Lara’s US Oil post. This is a reproduction for those members who have no access to that.
=========================
US Oil Ichimoku Analysis
Data as at market close, July 5
=========================
Oil price rallied for 8 consecutive days from 42.05 to a high of 47.32 on Wednesday. The market then quickly tumbled to a low of 44.51. After the market close, prices quickly recovered and had been trading sideways ever since.
The question is: has 47.32 been all there is to minuette 2 in the Main Count (micro 2 in the Alternate)? Or is the second wave an ABC, with 47.32 being only the A wave and the drop towards 44.51 being the B wave?
Now, 47.32 is a wee bit larger than the 0.50 retrace from 42.05 towards the previous high of 52.00. At mid-price, it is difficult to determine the future movement. Of course, if price does break above 47.32, then the ABC scenario is correct. And, if price breaks down below 42.05, then the second wave is already over.
What is the likelihood of each possibility? If prices rise further, resistance will be in the form of 46.17 kijun-sen resistance, followed by the 50 day SMA at 47.07. Only if these two are cleared could prices retest yesterday’s high of 47.32, and if this is also overcome, then the bottom cloud resistance near 48.80 should be the final stop. The cloud is turning menacingly red soon so there’s no doubt that prices will find great difficulty in breaking above the cloud. On the other hand, a down move has only got tenkan-sen support at 44.79 to overcome. The 5-day RSI would have risen slightly above the 50.18 value at market close, indicating a rebound off the 50-mark, a mildly bullish sign. The MACD histogram is turning slightly down, taking the opposite view.
On balance, I think that the easier path for oil to follow is down. To be on the safe side, I would be waiting to see if oil can break above the three resistance barriers to determine an entry point: 46.17, 47.07, and 47.32. Rejection from any one of these increases the chances of a top being in place. This short trade is extremely lucrative, with an eventual target of 25.59 (Alternate Count), and better yet, 15.40 for the Main Count. I’m sure many of us are eagerly waiting to pounce on this short. A little patience is perhaps the best insurance against any miscue.
Thank you, Alan, for this analysis. You have no idea how much I look forward to these. Yes…tad more patience…
Updated Daily count for GDX:
While GDX appears to have broken down from a completed triangle, I don’t want to get too comfortable as it’s still possible that the triangle is incomplete and just expanding. That said, I think this count matches up well with Lara’s main gold count. GDX often leads gold, so GDX completing it’s triangle before gold makes sense.
With the 50MA below the 200MA and both sloping down, the bears appear to be in full control. The labeling of the move down out of the triangle may change as more structure develops. Let’s use the channel to help tell us when a larger correction up has arrived.
https://www.tradingview.com/x/Fdg8c0b7/
Dreamer. A brilliant expose on the miners. I’m sure this would help many of us see a clearer picture of where we are likely to be heading.
Ichimoku Gold Intraday Update
Data as at 4:05 am ET July 6
========================
Gold prices had made a lower low yesterday at 1217.61, but bounced sharply back towards resistance at 1235, as discussed in the Daily Analysis.
In the 4-Hour Ichimoku Chart, gold price is trading comfortably below the kumo (cloud). The cloud has turned red. The tenkan-sen is still lying below the kijun-sen with no signs of a let-up. The short-term trend is clearly bearish. The divergence from the 5-day RSI, as shown in the Daily Analysis, gave a signal for a brief rebound. Gold prices have now broken above the tenkan-sen, raring to go further. The first resistance to the rebound is at 1232.72, current 4-hourly kijun-sen resistance. This is followed by the downward sloping lower cloud boundary, not an optimistic sight. If gold prices do manage to get back into the cloud, and this is a possibility since the cloud is relatively thin, then the top cloud boundary, coming in at 1237.66 later on in the day, ought to stop the bulls in their tracks. I will be monitoring these price points closely to continue shorting the market. I expect the rebound to last no longer than today, or at worst tomorrow. As discussed in the July 3 report, prices ought to fall to at least 1175, if not 1160, and this short should be a lucrative one.
Folks, I’m happy to report that StockCharts had finally awakened from a hangover due to a drunken stupor on July 4, and so I have access to Ichimoku from which to base a report. As of now, there are still some chinks in TradingView’s armour, but I believe these will be ironed out soon.
===========================
Gold Daily Analysis
Data as at Market Close, July 5
===========================
With the price drop below the short-term brown uptrend support line, now turned staunch resistance, it is extremely unlikely that prices can break upwards above 1235-1240. From experience with trendline resistance/support, it would probably take at least three attempts before it can achieve success, which means we have to resign ourselves to lower gold prices for some time.
The weak attempt to rally yesterday is testament to this. Prices rolled over from a valiant run towards 1250, fizzled out, and then dropped to 1217.61 before bouncing again. Make no bones about it, this market is set to drop further. Once prices approach or touch the brown uptrend support line, it will surely get rejected and continue its downward path of least resistance. The only things that could put a stop to this will be strong geopolitical factors such as an all-out war in retaliation to North Korea’s incessant provocation by tauntingly firing missiles at will, or a sudden collapse of the stock market.
Gold price had dropped way below the 50 day SMA at 1253.51 and the kijun-sen resistance at 1257.65. We can forget about these price points for the time being as it is unlikely that prices can surge that high. That the tenkan-sen is lying way below the kijun-sen had posed a veritable barrier to any bullish attempt. The 200 day SMA at 1237.71 and the tenkan-sen resistance at 1238.25 however are within striking distance. The current rebound appears to be headed to test these, and these price points will serve as an estimate of my entry for a short. My judgement is that this rebound is likely to be short-lived, possibly ending by today, if not tomorrow. Although the 5-day RSI is in oversold territory, begging for a rise, the MACD isn’t co-operative: it is still dropping.
Nice analysis Alan. Amazing how the 50MA has already turned down after the “Golden Cross” just over a month ago. With both the 50MA and the 200MA sloping downward, we may get a “Death Cross” within the next few weeks. This will be significant.
Thanks Alan. My conclusion is exactly the same as yours essentially.
It looks like the bounce is going to be more shallow and over soon.