
Some upwards movement was expected, which is exactly what has happened.
Summary: Expect a small bounce to end either about 1,228 – 1,230, or a little below 1,228. Thereafter, look out for strong downwards movement.
This correction is an opportunity to join the trend. Stops may be set at prior support, which may now be resistance about 1,240, or for those with a higher risk appetite just above 1,248.09.
Profit target is now at 1,160.
New updates to this analysis are in bold.
Last monthly charts and alternate weekly charts are here, video is here.
Grand SuperCycle analysis is here.
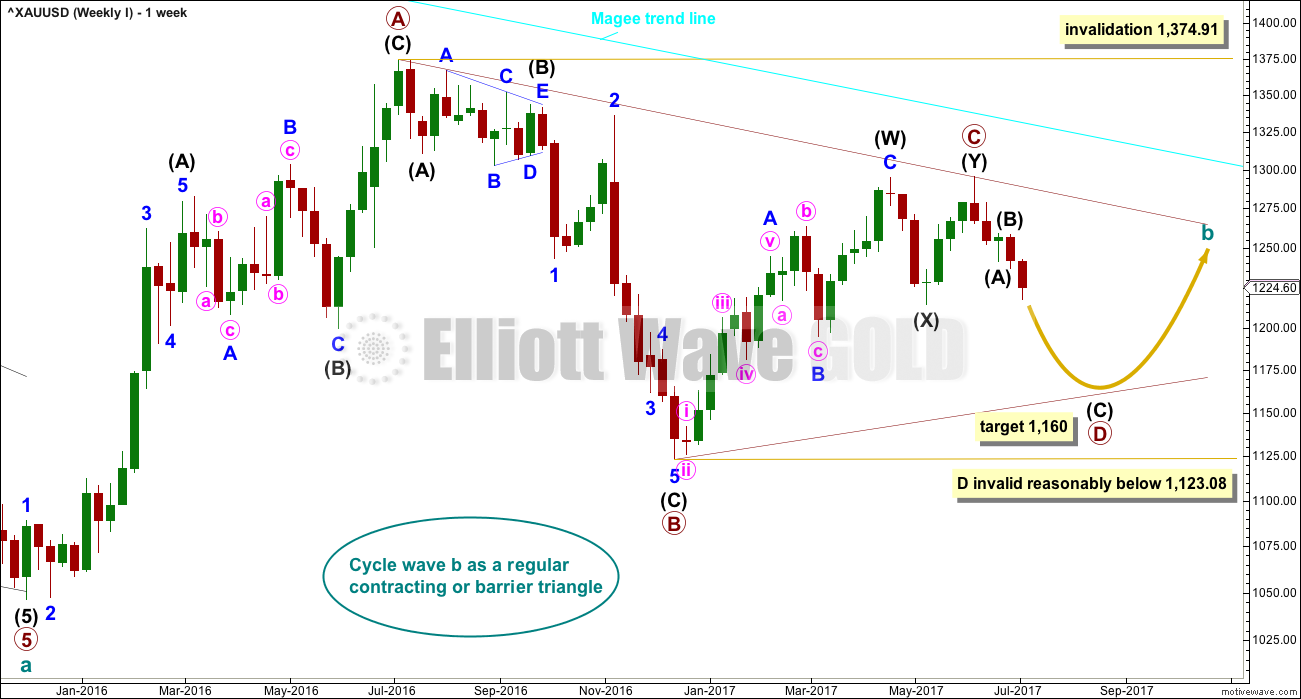
WEEKLY CHART
Click chart to enlarge.
The Magee bear market trend line is added to the weekly charts. This cyan line is drawn from the all time high for Gold on the 6th of September, 2011, to the first major swing high within the following bear market on the 5th of October, 2012. This line should provide strong resistance.
At this stage, a triangle still looks most likely and has the best fit for cycle wave b.
Within a triangle, one sub-wave should be a more complicated multiple, which may be primary wave C. Primary wave C may not move beyond the end of primary wave A above 1,374.91. This invalidation point is black and white.
At this stage, it looks like primary wave C is now complete at the hourly and daily chart level. However, at the weekly chart level, it looks possible it may continue higher. This possibility must be acknowledged while price remains above 1,214.81. Within intermediate wave (Y), minor wave B may not move beyond the start of minor wave A.
Primary wave D of a contracting triangle may not move beyond the end of primary wave B below 1,123.08. Contracting triangles are the most common variety.
Primary wave D of a barrier triangle should end about the same level as primary wave B at 1,123.08, so that the B-D trend line remains essentially flat. This involves some subjectivity; price may move slightly below 1,123.08 and the triangle wave count may remain valid. This is the only Elliott wave rule which is not black and white.
There are three alternate wave counts that have been published in the last historic analysis, which is linked to above. They are all very bullish. They will only be published on a daily basis if price shows them to be true with a new high now above 1,295.65.
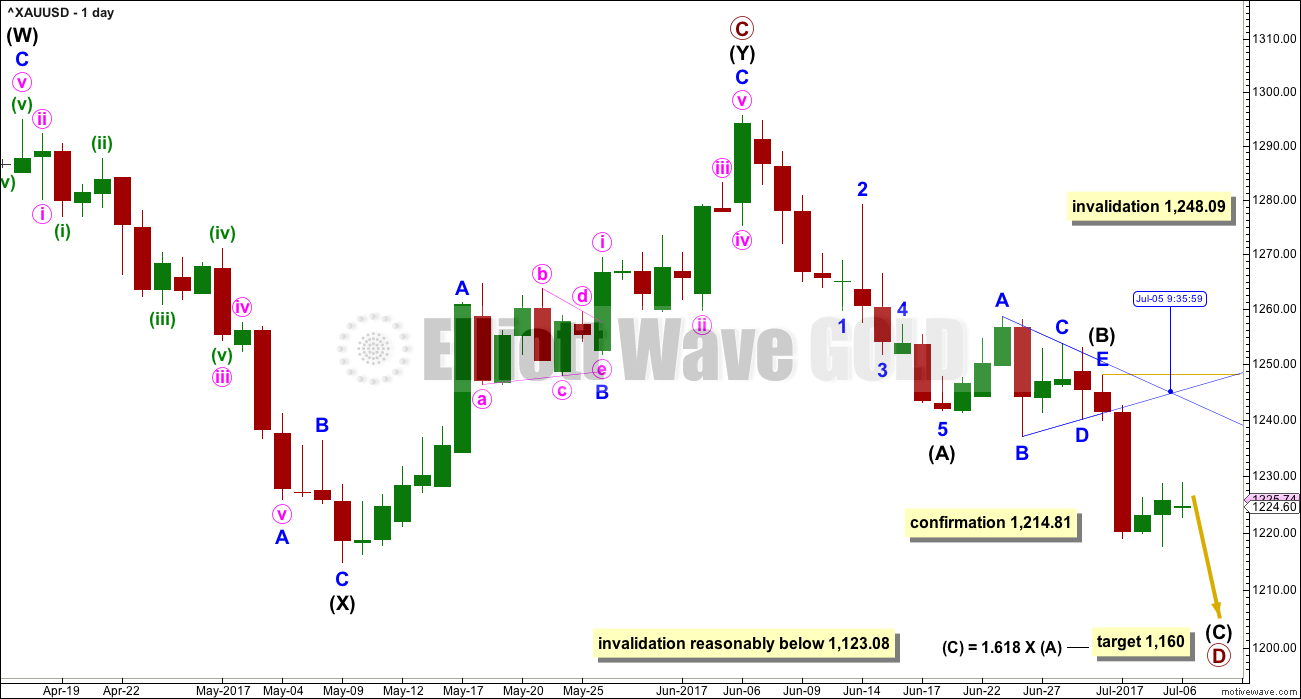
DAILY CHART
Click chart to enlarge.
Intermediate wave (Y) may now be a complete zigzag if it is accepted that a triangle completed in the position labelled minor wave B. This has a perfect fit on the hourly chart.
A new low below 1,214.81 could not be minor wave B within intermediate wave (Y) and would provide strong confirmation that intermediate wave (Y) is over.
A common range for triangle sub-waves is from about 0.8 to 0.85 the prior sub-wave, this gives a range for primary wave D from 1,158 to 1,149. A Fibonacci ratio is used to calculate a target, which is just above this common range, for intermediate wave (C) now that intermediate waves (A) and (B) look to be complete.
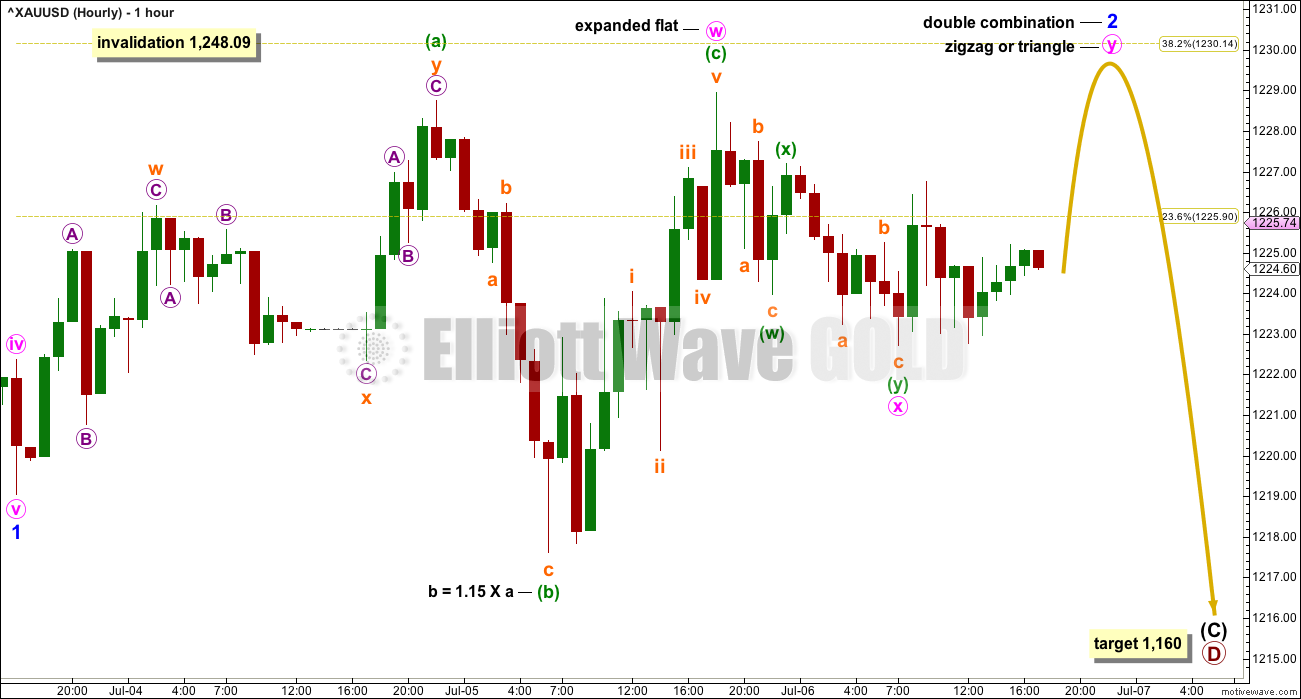
The point in time when an Elliott wave triangle’s trend lines cross over often (not always) sees a trend change. That point in time is now, so this offers some slight support to the alternate hourly wave count below. This trend change is not always a large one; it may be a smaller change within a consolidation.
If primary wave C is correctly labelled as a double zigzag, then primary wave D must be a simple A-B-C structure and would most likely be a zigzag. Within intermediate wave (C), no second wave correction may move beyond the start of its first wave above 1,248.09.
Intermediate wave (A) lasted only ten days. Intermediate wave (B) has lasted eight days. As intermediate wave (C) is expected to be longer in length than intermediate wave (A), it may also be longer in duration and may last a Fibonacci thirteen days as the first expectation or a Fibonacci twenty one days as the next expectation.
Primary wave A lasted 31 weeks, primary wave B lasted 23 weeks, and primary wave C may have been complete in 25 weeks.
Primary wave D should be expected to last at least 8 weeks (but most likely longer). The next Fibonacci ratio in the sequence would be a Fibonacci 13 and then 21.
HOURLY CHART
Click chart to enlarge.
At this stage, it looks like minor wave 2 may be completing as a very common double combination. The first structure in the double is a completed expanded flat correction. The double is joined by a three in the opposite direction, a double zigzag labelled minute wave x.
The second structure in the double may be either a zigzag (most likely), triangle, or flat correction for a double flat. Double flats are actually very rare though, so let us assume a more likely double combination.
The purpose of a second structure in a double combination is to take up time and move price sideways. Combinations unfold when the first corrective structure does not take long enough. The second structure normally ends close to the same level as the first to achieve a sideways look. Minute wave y may be expected to end close to 1,228, or maybe slightly higher to reach the 0.382 Fibonacci ratio at 1,230.
Minor wave 2 may not move beyond the start of minor wave 1 above 1,248.09.
The trend is down. All trades should be with the trend. Always use a stop. Invest only 1-5% of equity on any one trade.
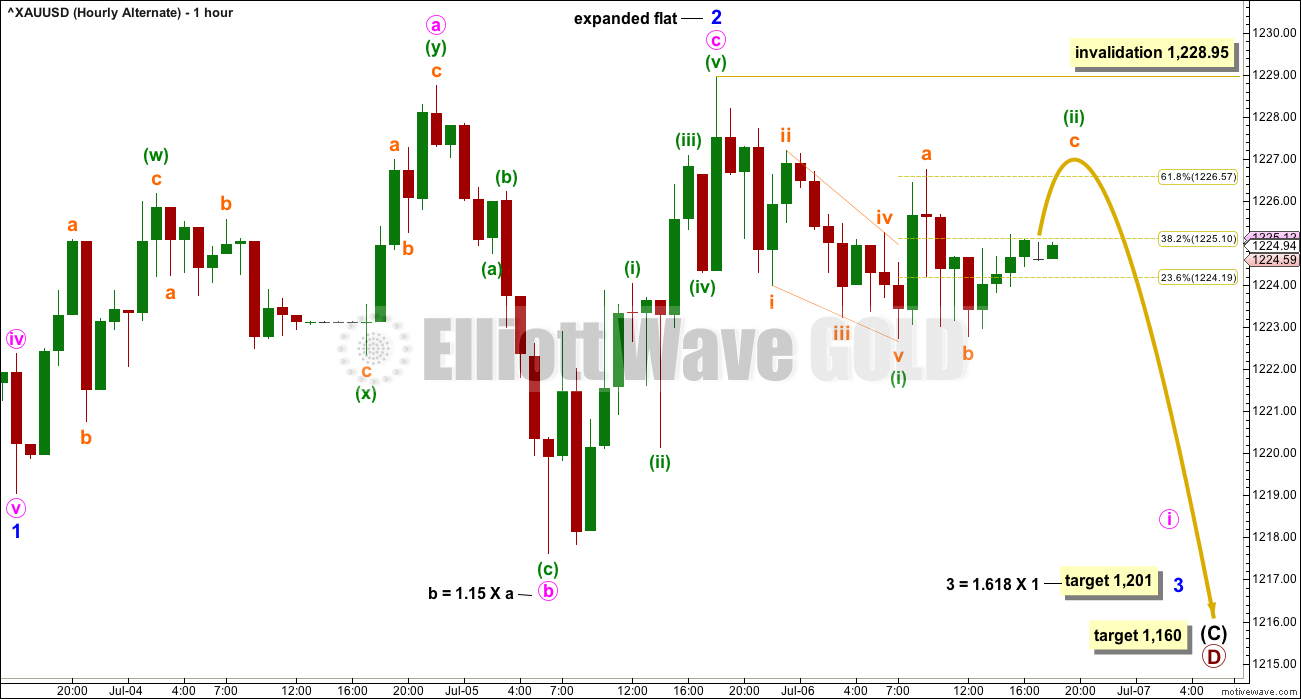
ALTERNATE HOURLY CHART
Click chart to enlarge.
It is possible that minor wave 2 is over already, but this alternate must be judged to have a lower probability. If minor wave 2 is over, then it is very brief and shallow. While this is possible, it is less likely than the main wave count.
If minor wave 2 is over, then the first wave down within minor wave 3 is labelled minuette wave (i). This wave subdivides well as a leading contracting diagonal.
First wave leading diagonals are commonly followed by very deep corrections. Expect minuette wave (ii) to be deeper than the 0.618 Fibonacci ratio of minuette wave (i).
Minuette wave (ii) may not move beyond the start of minuette wave (i) above 1,228.95.
Both hourly wave counts essentially expect the same movement next. The difference is in how high this current small bounce is expected to be. This alternate expects a more shallow bounce to remain below 1,228.95, whereas the main hourly wave count expects the bounce may end slightly above that point.
Thereafter, both hourly wave counts expect a third wave down to develop and show an increase in momentum.
TECHNICAL ANALYSIS
WEEKLY CHART
Click chart to enlarge. Chart courtesy of StockCharts.com.
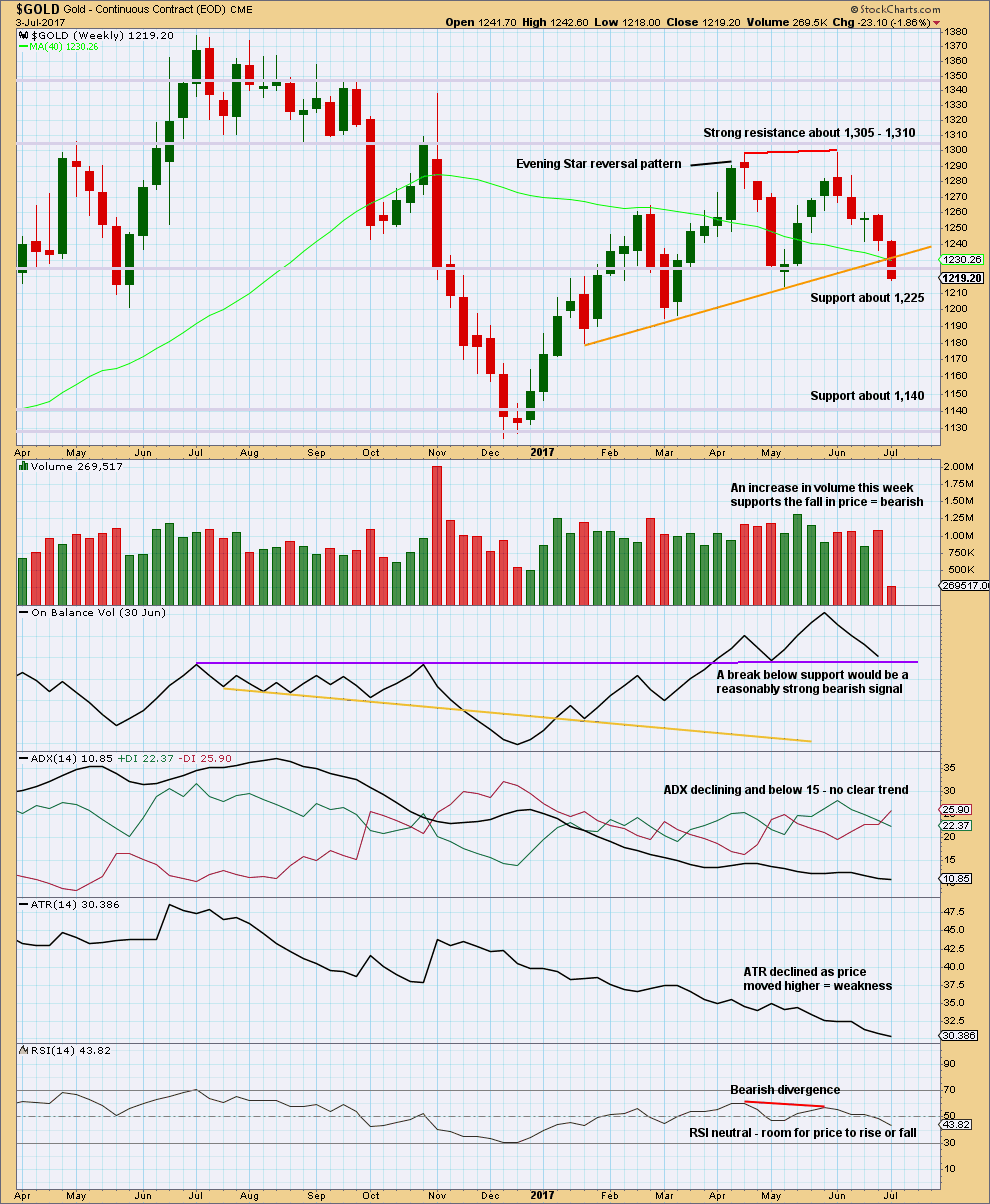
The weekly chart is updated: a trend line is added (orange) to show the breach on the 3rd of July. This break below support is significant. This is a strong bearish signal.
Volume last week supports the downwards trend at least short term.
If On Balance Volume breaks below the purple support line, it would offer a bearish signal. If it bounces up from this line, it would offer a bullish signal.
Declining ATR for a long time fits neatly with the expectation of a large triangle unfolding.
DAILY CHART
Click chart to enlarge. Chart courtesy of StockCharts.com.
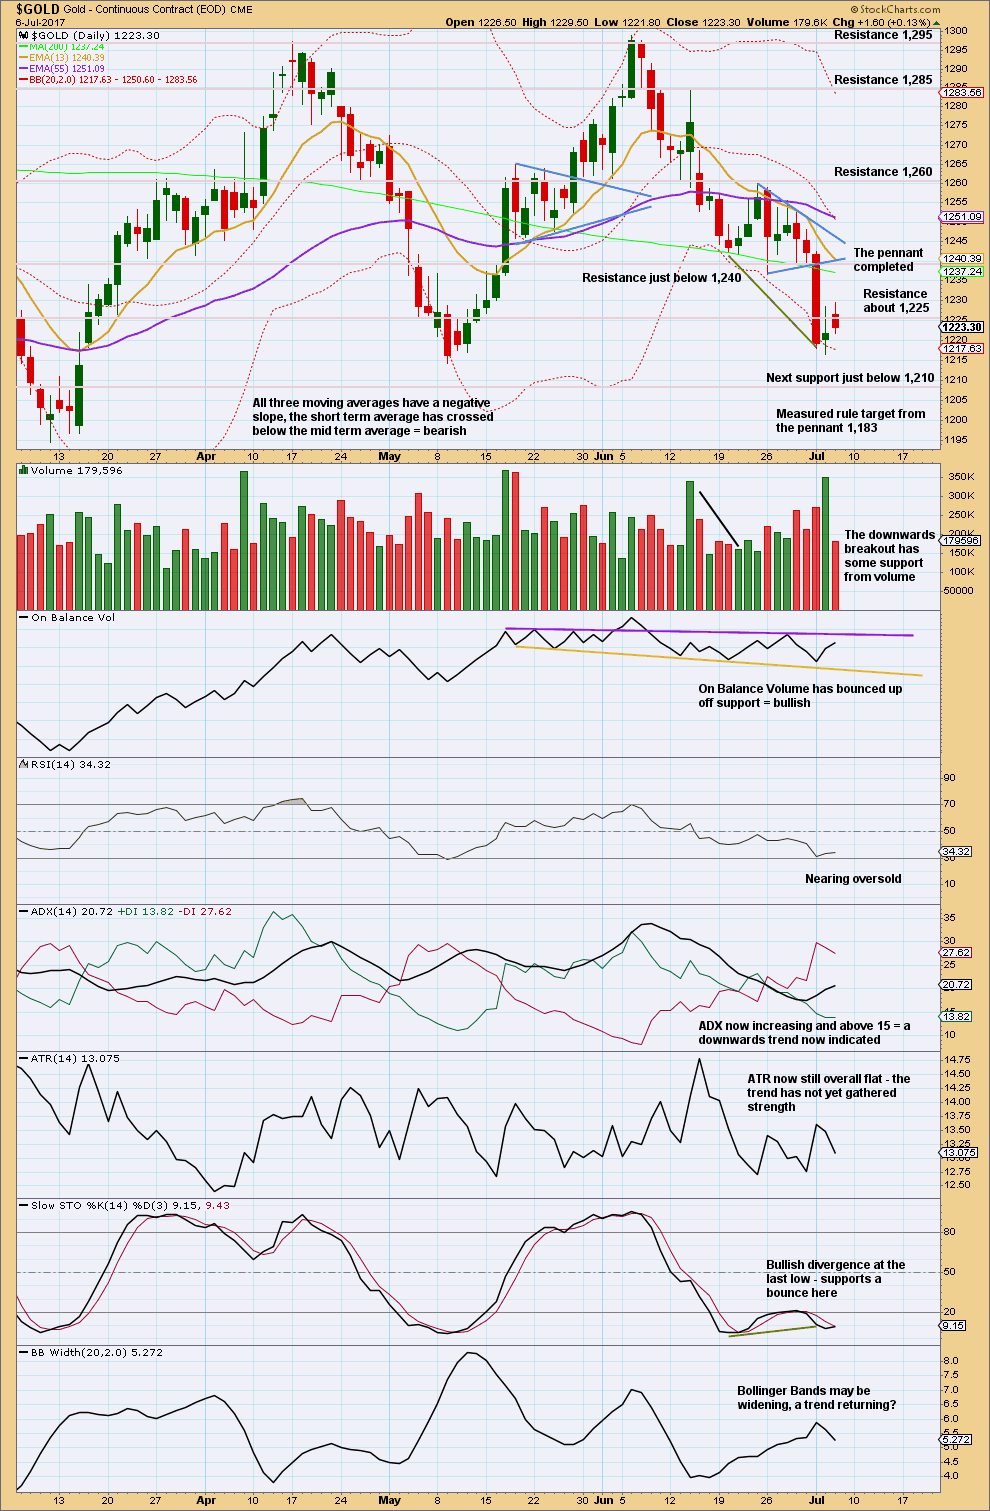
The downwards breakout from the pennant had support from volume. The following day made a new low and had a lower high, the definition of downwards movement, but the candlestick closed green and had a balance of volume upwards during the session. This upwards movement for the 5th of July has support from volume, so this is bullish for the short term.
The spinning top candlestick for the 5th of July looks like a pause in the downwards trend. This is typical after a strong movement. Now the 6th of July looks like a continuation of that pause.
Prior support was at 1,236. It would still be typical to see price curve up to test resistance there now. On Balance Volume allows for a little more upwards movement before it finds resistance.
The trend is down. Corrections are an opportunity to join the trend.
GDX
DAILY CHART
Click chart to enlarge. Chart courtesy of StockCharts.com.
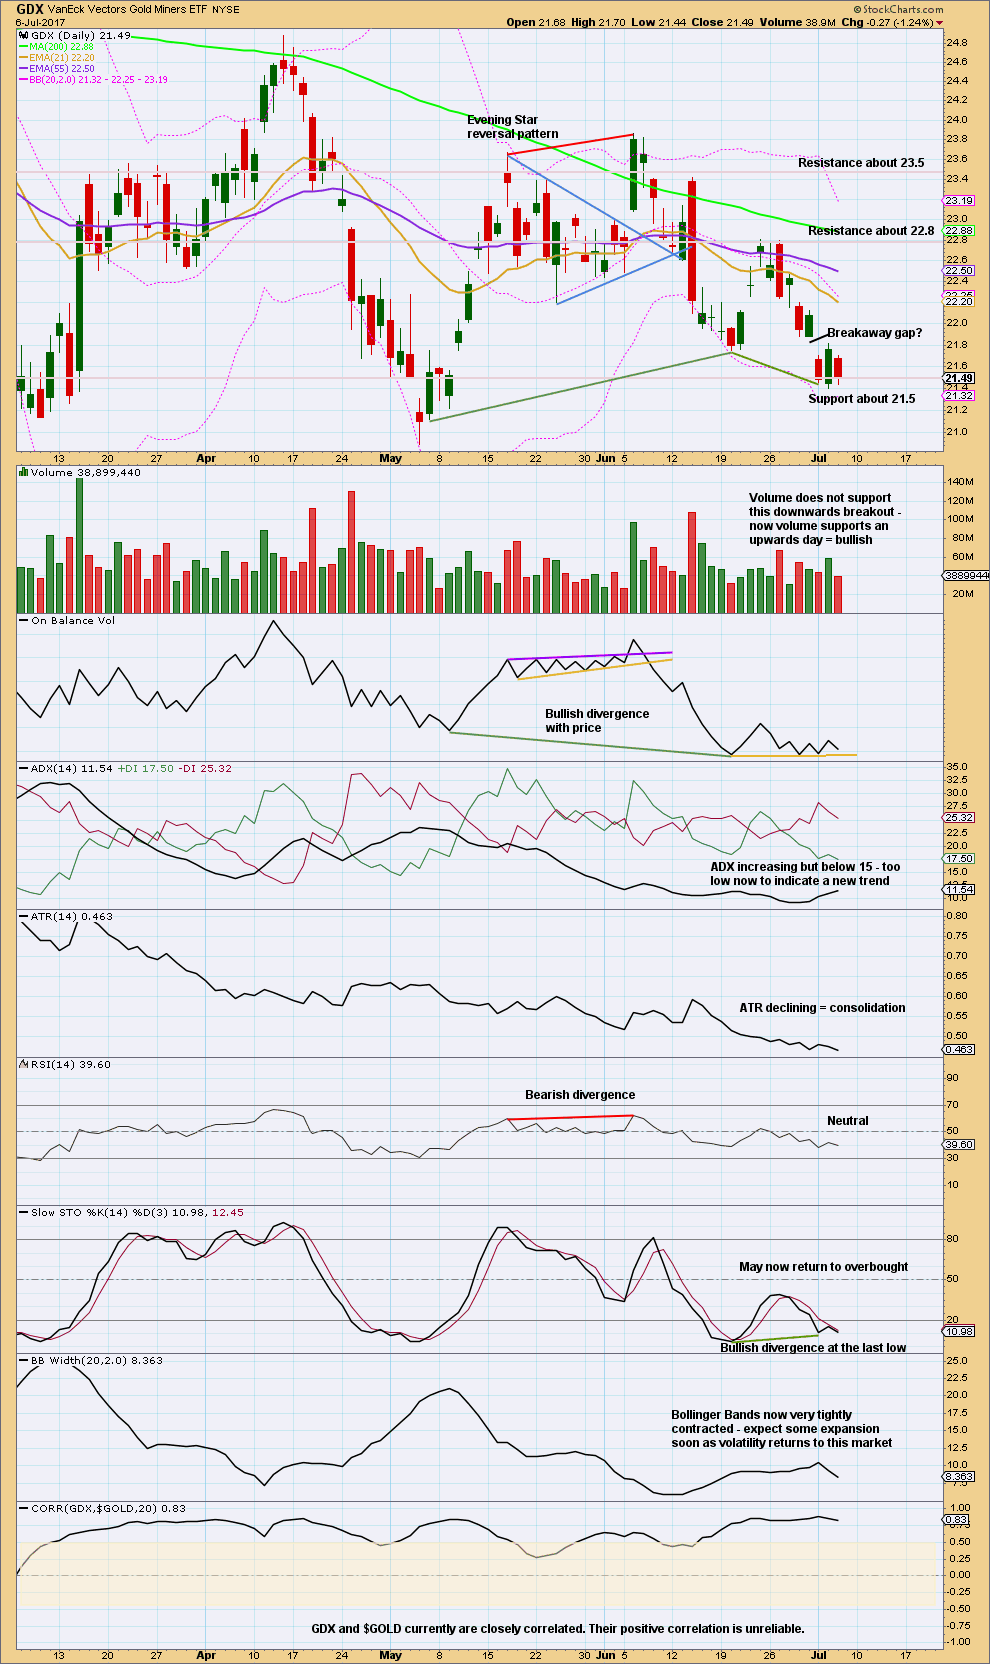
Price has broken out downwards from the consolidation, but the breakout is suspicious because it is not supported by volume. But we must keep in mind that not all downwards breakouts are supported by volume though; the market can fall of its own weight.
If the gap is correctly labelled as a breakaway gap, then the upper edge should offer resistance. Breakaway gaps are not usually closed. This resistance is at 21.88.
For the very short term, volume is slightly bullish supporting the idea that price may continue a little higher here to test resistance again.
This analysis is published @ 07:31 p.m. EST.
If history repeats itself oil should pull back up to the 45.60 level. Will place my shorts around this range. Have a good weekend all. Appreciate all the additional analysis.
So my last short public post was a “learn Elliott Wave” thing, here.
Only two people interacted, Verne and Dreamer. So I want to know, how many other members read it and found anything there in it for you?
Should this be a regular thing? Does it help you learn EW?
I’ve put up three charts there in comments: one with the “answers” to the quiz, another showing a valid count, and a third showing a problematic alternate
Lara,
I never saw that post, perhaps other members didn’t see it either? Please make more of these fun brainteasers and provide links to them on this main gold board.
To be honest, that’s all I ever look at.
Thanks, for all that you do for us.
Never saw this post either. Very odd. I love counting waves and a group of buddies and I do it even down to 1m TFs for fun while things get boring in higher TFs. Would love to engage.
Lara. I knew I ought to have gone there to take a look. I had my hands full analysing the gold, oil and S&P markets apart form my daily chores. The gold and oil markets especially are ripe for the pickings, and I wanted to make sure I have all bases covered. I had worked through as many scenarios as possible, to finally arrive at some workable trades. As a trader, it is always wise to plan all the trades early, before trading begins. That leaves the mind clear to be proactive, at worst reactive, during the heat of trading. It is no use crying over spilt milk afterwards. Like many people here in this forum, I trade highly leveraged ETFs, and these are not buy-and-hold types. So, mistakes are very costly, even with stops in place.
When I had a bit of free time today, I went in to take a look. Indeed, what you meticulously put up is highly educational, and good for those of us who are seriously trying to improve ourselves in EW knowledge. I know putting up something like this is hard work, and is rather dismaying if the response is low. I’m sure many of us do not really have that much time to spend on things other than trading. Reading your daily reports are, for many, the top priority, and may even be the only priority. Some even hold full-time jobs and trading is a supplemental activity. Much as I would like to see more of this, I would suggest that for health reasons, do this only if you really have the spare time.
Actually, I’m so used to EW and Motive Wave that it didn’t take very long at all to put this up.
I’m sure I can manage one a week or fortnight.
I found it a lot of fun actually.
I agree though about the time devoted to trading. I do find my own time dominated by EWG and EWSM, and my own trading tends to be left to last in my evening. To some extent that is how it has to be to meet my ethics guidelines for my CMT, but it does mean my own trading suffers for it.
Hi Lara,
Not commenting lately…have my hands full in family illness, etc., BUT I as a member of Gold analysis, try to review everything daily. Like John D., I was not aware that you posted this. When I can spot them, I find all of your learning posts VERY helpful. Perhaps if you just remind many Gold members that you are going to post something on Public Analysis and/or if we know you are going to continue…we will know to look there…Thank you!
I am sorry to hear about your family illness, I hope that gets better for you.
I will let members know here in comments when I make a public post.
Hourly chart updated:
moving everything up one degree within minor wave 3. the targets remain the same
draw the blue acceleration channel from the end of minor 1 (now off to the left of this chart) to the last low, place a parallel copy on the end of minor wave 2.
when minor wave 4 shows up it must remain below minor 1 price territory and it may find resistance at the upper edge of this channel.
any members who have shorts opened above 1,219 may be able to hold them until the end of primary wave D now, price for minor 4 may not move back above this point
Oil is currently undergoing a pullback in subminuette 2, targeting 45.50 – 46.00. I have exited at today’s low and is waiting for the pullback to end before going in again. Subminuette 3 should be a $6 to $7 drop.
When trading with leveraged ETFs, and I use SCO, it pays to take money off the table whenever possible. These creatures are a darling when the trend is right, but a scourge when it is not.
As I have already cleared the deck with both gold and oil, guess I’ll call it a night. Next week will bring new opportunities. Good night, and have a nice weekend, my friends.
I took half off the table this morning as well. USO had a long wick so we could see a bit of a bounce the next day or two that will present another good entry.
Alan,
If you have time this weekend, would you please do an ichimoku analysis for natural gas? Thanks, and thank you for all of your other updates as well.
Hi John.
Much as I love to help, I could not find a chart on Natural Gas in which I can put an Ichimoku overlay on. Even a good chart is hard to come by.
I could only find one on UGAZ, the triple leveraged ETF. The chart is largely similar to WTI crude oil. The market is very bearish, and would plunge just like WTI. I don’t trade that market, so I could not make any suggestions due to a lack of hands-on experience. Judging from the UGAZ chart, I reckon the natural gas market is one which could be shorted for good gains.
Thanks Alan,
I appreciate your effort to look.
Your gold, silver & oil updates are so greatly appreciated, as well.
John, Alan,
Here’s NatGas daily with Ichimoku overlay. It looks like a new downtrend channel is forming and price is below the cloud. Looks very bearish to me. GL
https://www.tradingview.com/x/r2AhhCeA/
Thank You, Dreamer.
Your post is very helpful.
The crowd chose to concentrate on the excellent number of jobs being created, but are either myopic or elected to gloss over the higher unemployment rate.
Gold prices dropped hard. Now, it is hovering near the weekly Ichimoku bottom cloud boundary, mentioned in my Intraday update below. Prices should rebound from there, probably to 1220ish for a 0.618 Fib Minute 2 retrace. I’m exiting my shorts, planning to return for the larger drop in Minute 3. That should take place early next week.
How they can report that unemployment rate with a straight face is beyond me. It speaks to the level of ignorance and gullibility of the American public, and the complicity of the news media. There is a lower percentage of men of working age, 22-54, now working than at the end of the great depression. Now that is a depressing statistic!
Whoo hoo, Gold price the little princess; gave me my target 1210-1208 from 1220s. Closed shorts and will look to short again on an uptick to 1219ish if this can get past 1216-17…. Have a fine weekend all. Thanks to those who post regularly with their chats supplementing Lara’s analysis…
Syed. Great job. My sentiments exactly.
Oil behaving beautifully. USO completed counter trend rally and now headed South. We have a ways down to go so not too late to join the party! For the more aggressive DRIP and SCO offer nice leveraged downside oomph. 🙂
Ichimoku Gold Intraday
Data as at 5:10 am ET July 7
=======================
Gold prices had dropped to a low of 1219.24 after market close, but have bounced in a relief rally ever since. The good news is that price had not made a new overnight low as silver did.
In the 4-Hour Ichimoku Chart, gold price is trading comfortably below the kumo (cloud). The cloud has turned red. The tenkan-sen is still lying below the kijun-sen, and price is trading below the tenkan-sen. The short-term trend remains decidedly bearish. Prices are locked in consolidation between 1220 and 1230. Kijun-sen is dropping while tenkan-sen is rising feebly. A crossover could theoretically happen, and this gives some hope for the continuation of the brief rally. If so, the first resistance is at 1224.13 tenkan-sen, followed by kijun-sen resistance at 1227.76. The best it might do is to attempt to break into the cloud.
On the down side, the bears will be let out of the gates in full force below the weekly kumo (not shown) bottom cloud boundary currently at 1207.17. Then, it will be all systems go until we reach Lara’s target of 1160.
I’m sure all this lethargic price movements are a reflection of the wait for the NFP report, which is rumoured to be solid (at least meeting the consensus estimate of 178K net additional jobs) despite yesterday’s disappointing ADP report. But, who knows, with great expectancy may come great disappointment.
Hello Lara
Is this idea possible?
Yes, it’s essentially the same as my weekly II chart in historic analysis, except my wave B would need adjusting to a completing expanded flat.
but within wave C of that potential expanded flat, there’s what looks like a triangle in a second wave position
so the idea has some big problems
Gold Daily Analysis
Data as at Market Close, July 6
=========================
The gold market has been very volatile on Thursday, bouncing from a low of 1226.75, and reaching a high of 1228.95, before succumbing to gravity for the rest of the day. After market close, a plunge took the market to 1219.24 from where a pullback is currently underway. I think this uncertainty stems from the wait for the NFP announcement today. These figures have a massive effect on the Fed’s interest rate outlook. Raising interest rates will be negative for gold, at least temporarily, and if the jobs number is strong, then gold is most likely to dive further.
Not much change to the Daily Ichimoku picture transpired. Gold remains way below the 50 day SMA at 1252.63 and the kijun-sen resistance at 1257.65. Again, we can forget about these price points for the time being as it is unlikely that prices can surge that high; the tenkan-sen lying way below the kijun-sen poses a formidable barrier to any bullish attempt. The 200 day SMA at 1237.24 and the tenkan-sen resistance at 1238.25 however are within striking distance. (They also tie in well with Lara’s predicted values). Unless the gold price had topped as depicted in Lara’s Alternate Count, the current rebound is playing out the Main Count scenario. (Alternatively, this could be part of Minuette 2 in the Alternate Count). In either case, the gold price appears to be headed to test these two price points, and these will serve as an estimate of my entry for a short. My judgement is that this rebound is just a relief rally, subjected to the data of the NFP which would move the market. Although the 5-day RSI is in oversold territory, begging for a rise to at least 30, the MACD is still dropping, presenting a divergent view. It would be left to the crowd sentiment reacting to the NFP to direct the market.
Here’s my hourly chart for GDX. The trend is down. If Minuette 4 is a triangle, we may get a quick spike up in the morning after the jobs report release, then the downward move continues.
That said, as you can see, I’m expecting a series of 4th waves which will make the journey choppy with a downward slant.
If this count is correct, then I would expect Intermediate wave 1 to correspond with the end of Primary wave D for Lara’s Gold triangle.
You can refer to yesterday’s post for the GDX daily count.
Let’s see how this works out!
https://www.tradingview.com/x/bLJ08SXz/
The bpgdm is dropping to levels of previous bottoms. Next week it will probably be closer to 10
Yes, that’s a good indicator and it does look like it has room to move down.
DSI is very low for Gold and Silver now, but it can still bounce around this level and go a little lower.
I’m going to take a punt on the short side now for Gold. The main wave count just isn’t looking quite right.
Reducing risk to just below 3% of equity though, because I could be wrong. I want to leave some powder dry.
Stop set just above the high of 5th July at 1,228.95.
Unfortunately some of us in the states are limited to the trading day. I’m looking into getting a futures trading account, fidelity doesn’t have that. Anyone have any suggestions, ameritrade?
This could even move down in the next few hours if it follows silvers lead, although much thinner market. Might want to sell some if it does before the jobs report if you have some nice profits…best of luck.
That’s most unfortunate. Anyone here in the USA can point to a broker that allows 24 hour access to gold markets?
I know my NZ broker doesn’t 🙁
Unfortunately Gold is a 24 hour market, not US only. It’s global and so is this membership, although the membership is dominated by folks in the USA
Interesting silver hit 14.8 or so is now 15.83. Silver commercials were selling there shorts and now most probably going long silver. The specs were net long 35 k contracts last week. When they report next week they will probably be net short about 15 to 25 k contracts. In 2016 before the big run up, the spec position was about 20k long, probably what it is now, if not less. Lara’s goal was 14.6 to 15.3 or so. 14.8 meets that range. If the job report sucks tomorrow, who knows maybe we go up? Or a spike down to that level again of 15 or so and then a huge move up?
Hi Lara
Do you have any comment on explosive high volume trades to downside occurring within minutes after 7pm est at least on TOS chart software. Silver touched 14.26 and gold 1219 and bounced quickly back. Double fat finger trade, option trade gone awry or conspiracy?
And what does this do to the wave counts? What a way to disrupt the charts! And as I write they are slipping again. Nice of the big players to wait to aftermarket to make intentions known and not let retail people participate! Feels like tomorrow is going to be a huge trade for all markets. 7/7/17. Even the date is spooky.
Wow, yeah, I see it. I wish they’d done that before I published.
The main hourly wave count isn’t quite invalid, minor 2 could possibly be a double flat. But they are really very rare, I think I’ve only ever seen one for sure in my 9 years. So the probability of that is now especially low… or I’ve not seen the correct wave count.
OR
The alternate is increasing in probability… but minuette (ii) may already be over.
This strong move down may be the early stage of minor wave 3.
Silver made an even more incredible move by comparison.