
A small bounce to about 1,228 to 1,230 was expected before downwards movement resumed, but this is not what happened. The high was already in place.
Summary: The trend is down. Corrections, even small ones, present an opportunity to join the trend.
Profit target is now at 1,160.
Always use a stop and invest only 1-5% of equity on any one trade.
New updates to this analysis are in bold.
Last monthly charts and alternate weekly charts are here, video is here.
Grand SuperCycle analysis is here.
WEEKLY CHART
Click chart to enlarge.
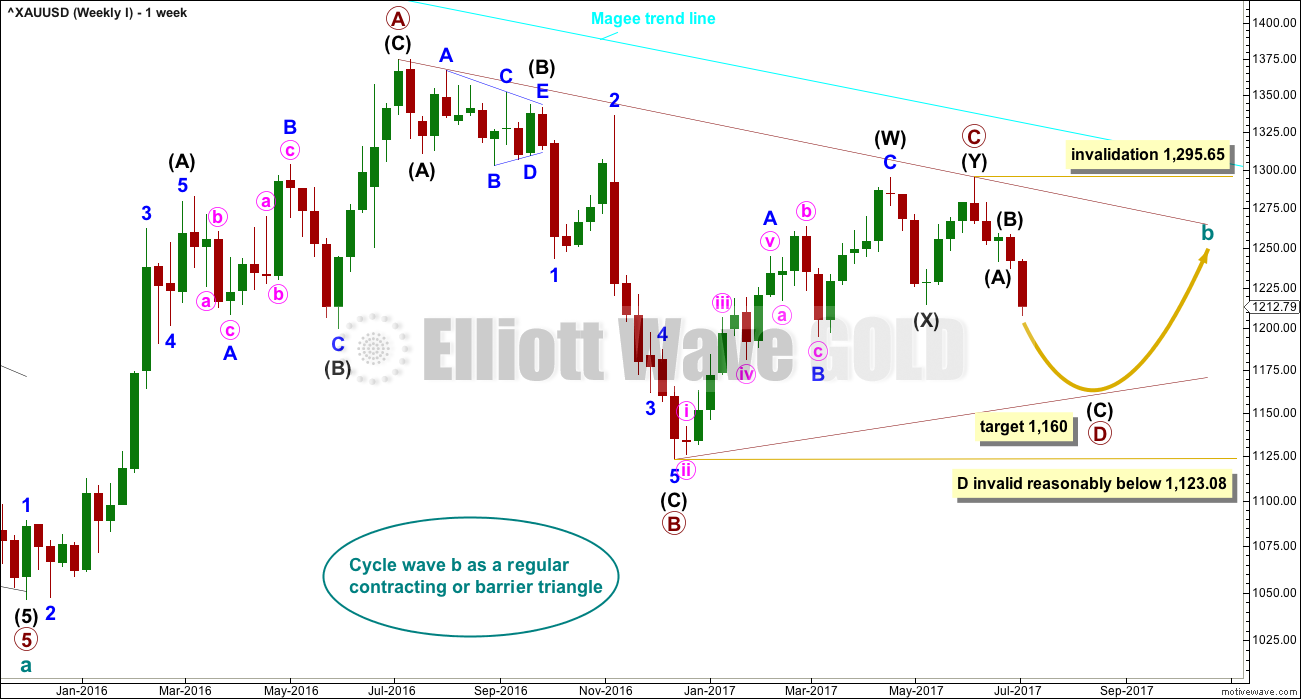
The Magee bear market trend line is added to the weekly charts. This cyan line is drawn from the all time high for Gold on the 6th of September, 2011, to the first major swing high within the following bear market on the 5th of October, 2012. This line should provide strong resistance.
At this stage, a triangle still looks most likely and has the best fit for cycle wave b.
Within a triangle, one sub-wave should be a more complicated multiple, which may be primary wave C. Primary wave C may not move beyond the end of primary wave A above 1,374.91. This invalidation point is black and white.
At this stage, it looks like primary wave C is now complete at the hourly and daily chart level. A new low on Friday below 1,214.81 cannot be minor wave B within intermediate wave (Y) within primary wave C, so now primary wave C must be over.
Primary wave D of a contracting triangle may not move beyond the end of primary wave B below 1,123.08. Contracting triangles are the most common variety.
Primary wave D of a barrier triangle should end about the same level as primary wave B at 1,123.08, so that the B-D trend line remains essentially flat. This involves some subjectivity; price may move slightly below 1,123.08 and the triangle wave count may remain valid. This is the only Elliott wave rule which is not black and white.
Finally, primary wave E of a contracting or barrier triangle may not move beyond the end of primary wave C above 1,295.65. Primary wave E would most likely fall short of the A-C trend line. But if it does not end there, then it can slightly overshoot that trend line.
There are three alternate wave counts that have been published in the last historic analysis, which is linked to above. They are all very bullish. They will only be published on a daily basis if price shows them to be true with a new high now above 1,295.65.
DAILY CHART
Click chart to enlarge.
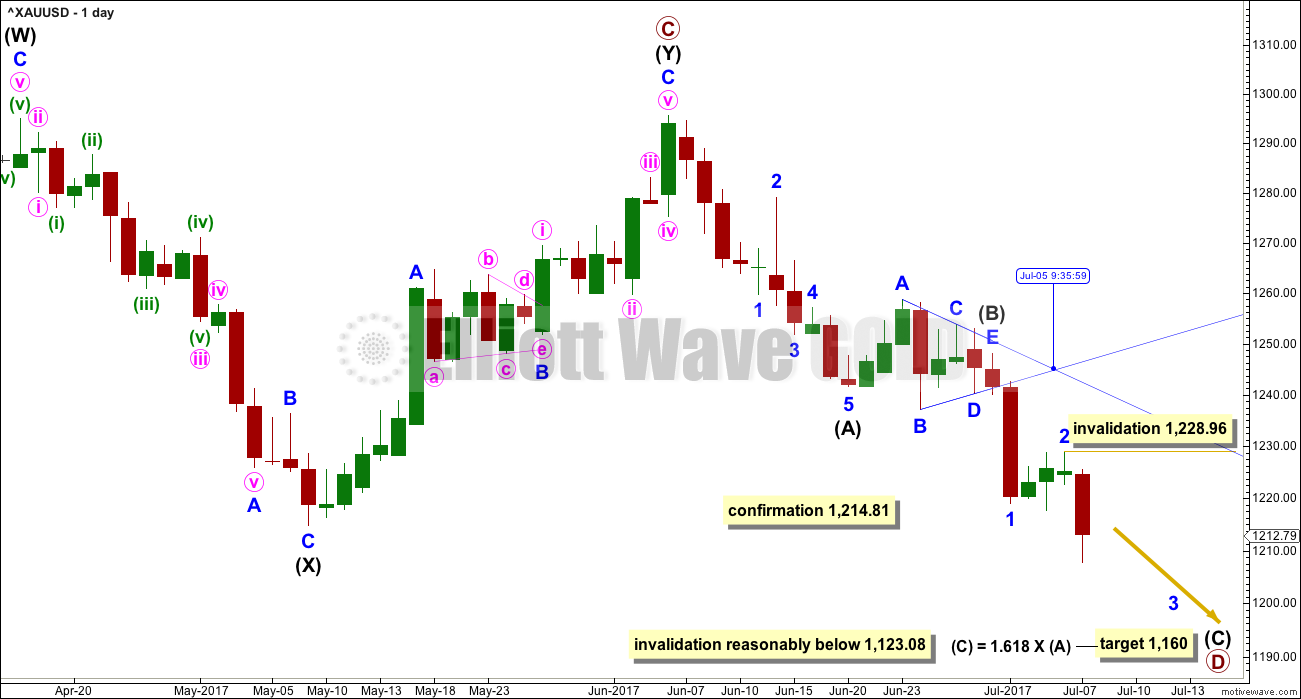
A new low below 1,214.81 could not be minor wave B within intermediate wave (Y) and has now provided strong confirmation that intermediate wave (Y) is over.
A common range for triangle sub-waves is from about 0.8 to 0.85 the prior sub-wave, this gives a range for primary wave D from 1,158 to 1,149. A Fibonacci ratio is used to calculate a target, which is just above this common range, for intermediate wave (C) now that intermediate waves (A) and (B) look to be complete.
The point in time when an Elliott wave triangle’s trend lines cross over often (not always) sees a trend change. This technique appears to have worked albeit not perfectly. It expected a trend change on the 5th of July, but the end of minor wave 2 came a few hours later within the 6th of July.
If primary wave C is correctly labelled as a double zigzag, then primary wave D must be a simple A-B-C structure and would most likely be a zigzag. With a triangle complete in the position labelled intermediate wave (B), the idea of a zigzag unfolding lower is strengthened. This may not be labelled a second wave as second waves do not subdivide as triangles. Triangles appear in positions of fourth waves, B waves, or within combinations.
Intermediate wave (A) lasted only ten days. Intermediate wave (B) has lasted eight days. As intermediate wave (C) is expected to be longer in length than intermediate wave (A), it may also be longer in duration and may last a Fibonacci thirteen days as the first expectation or a Fibonacci twenty one days as the next expectation. So far it has lasted only five days.
Intermediate wave (C) must subdivide as a five wave motive structure, either an impulse or an ending diagonal. An impulse is much more likely; so let us assume that is the more likely structure until proven otherwise, or until some overlapping suggests a diagonal may be possible.
Within intermediate wave (C), minor waves 1 and 2 are now complete. Within minor wave 3, no second wave correction may move beyond the start of its first wave above 1,228.96.
Primary wave A lasted 31 weeks, primary wave B lasted 23 weeks, and primary wave C may have been complete in 25 weeks.
Primary wave D should be expected to last at least 8 weeks (but most likely longer). The next Fibonacci ratio in the sequence would be a Fibonacci 13 and then 21.
HOURLY CHART
Click chart to enlarge.
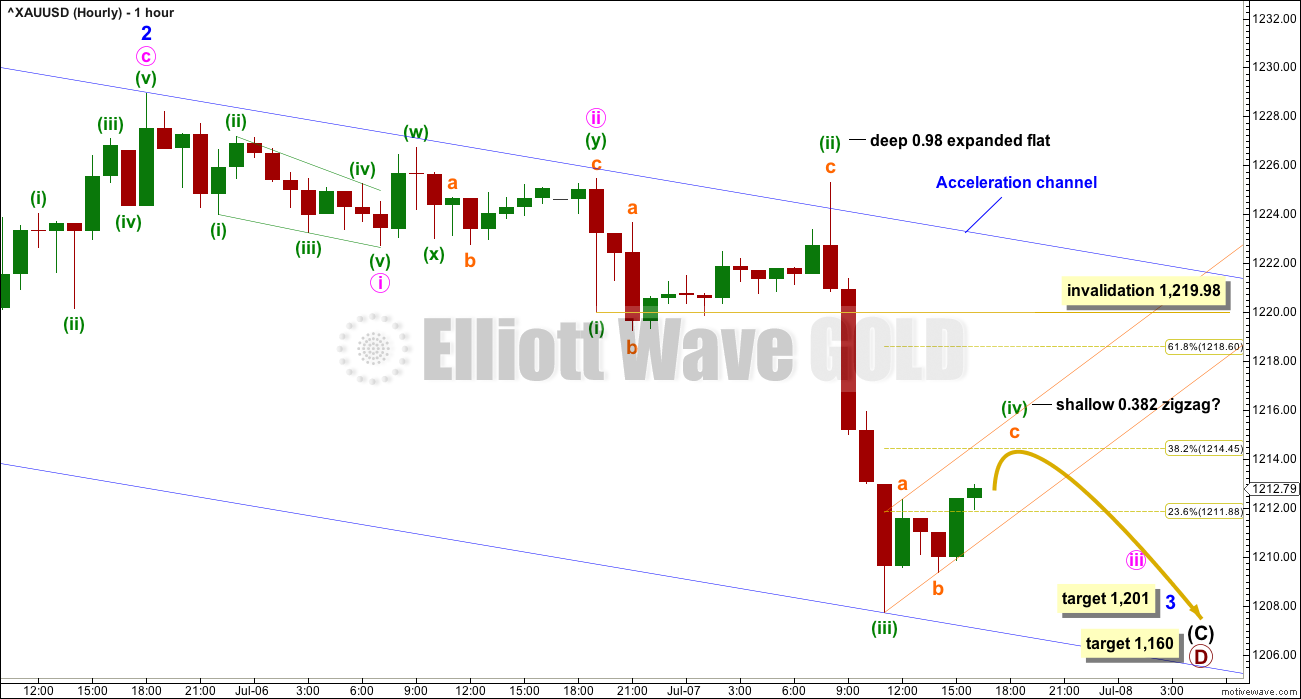
Minor wave 2 was over as a brief and shallow expanded flat correction.
Minor wave 3 may only subdivide as a simple impulse. It may be close to complete if the target is correct. At 1,201 minor wave 3 would reach 1.618 the length of minor wave 1.
When minor wave 3 is complete, then the invalidation point for minor wave 4 moves down slightly to the end of minor wave 1 at 1,219.05.
So far, within the impulse of minor wave 3, minute wave iii may be incomplete. Minute wave iii must subdivide as an impulse, and within it minuette wave (iv) may not move back up into minuette wave (i) price territory above 1,219.98.
Minuette wave (ii) was a deep expanded flat correction. Given the guideline of alternation,, expect minuette wave (iv) to be a more shallow single or multiple zigzag. The preferred target for it to end would be the 0.382 Fibonacci ratio of minuette wave (iii) at 1,214. Use the channel about minuette wave (iv) to see when it may be over and for confirmation it is over. It may end if price comes up to touch the upper edge of the small orange channel. When that channel is breached by downwards movement, that shall indicate minuette wave (iv) as over and minuette wave (v) as most likely underway.
Minor wave 2 shows up on the daily chart lasting three days. For the wave count at the daily chart level to have the right look, minor wave 4 should also show up on the daily chart lasting a few days. Minor wave 4 may be the next multi day interruption to this downwards trend.
TECHNICAL ANALYSIS
WEEKLY CHART
Click chart to enlarge. Chart courtesy of StockCharts.com.
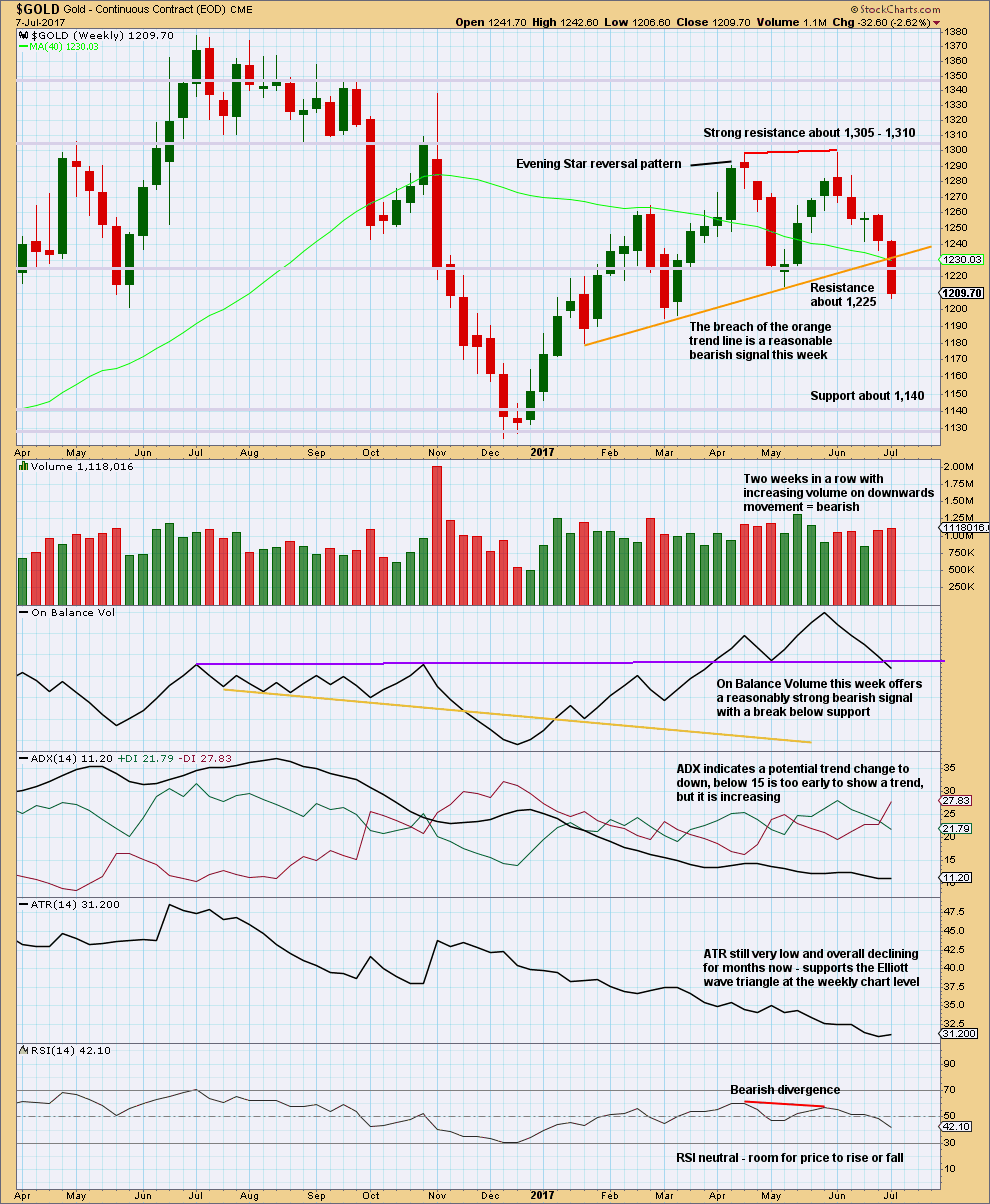
This chart offers strong support to the Elliott wave count.
The breach of the orange trend line by price is bearish. On Balance Volume gives a reasonable bearish signal, which should be given weight. Volume is bearish. ADX is slightly bearish. RSI is bearish.
Only ATR indicates weakness for the bigger picture (the Elliott wave triangle at the weekly chart level), but this does not preclude price from falling further here though.
DAILY CHART
Click chart to enlarge. Chart courtesy of StockCharts.com.
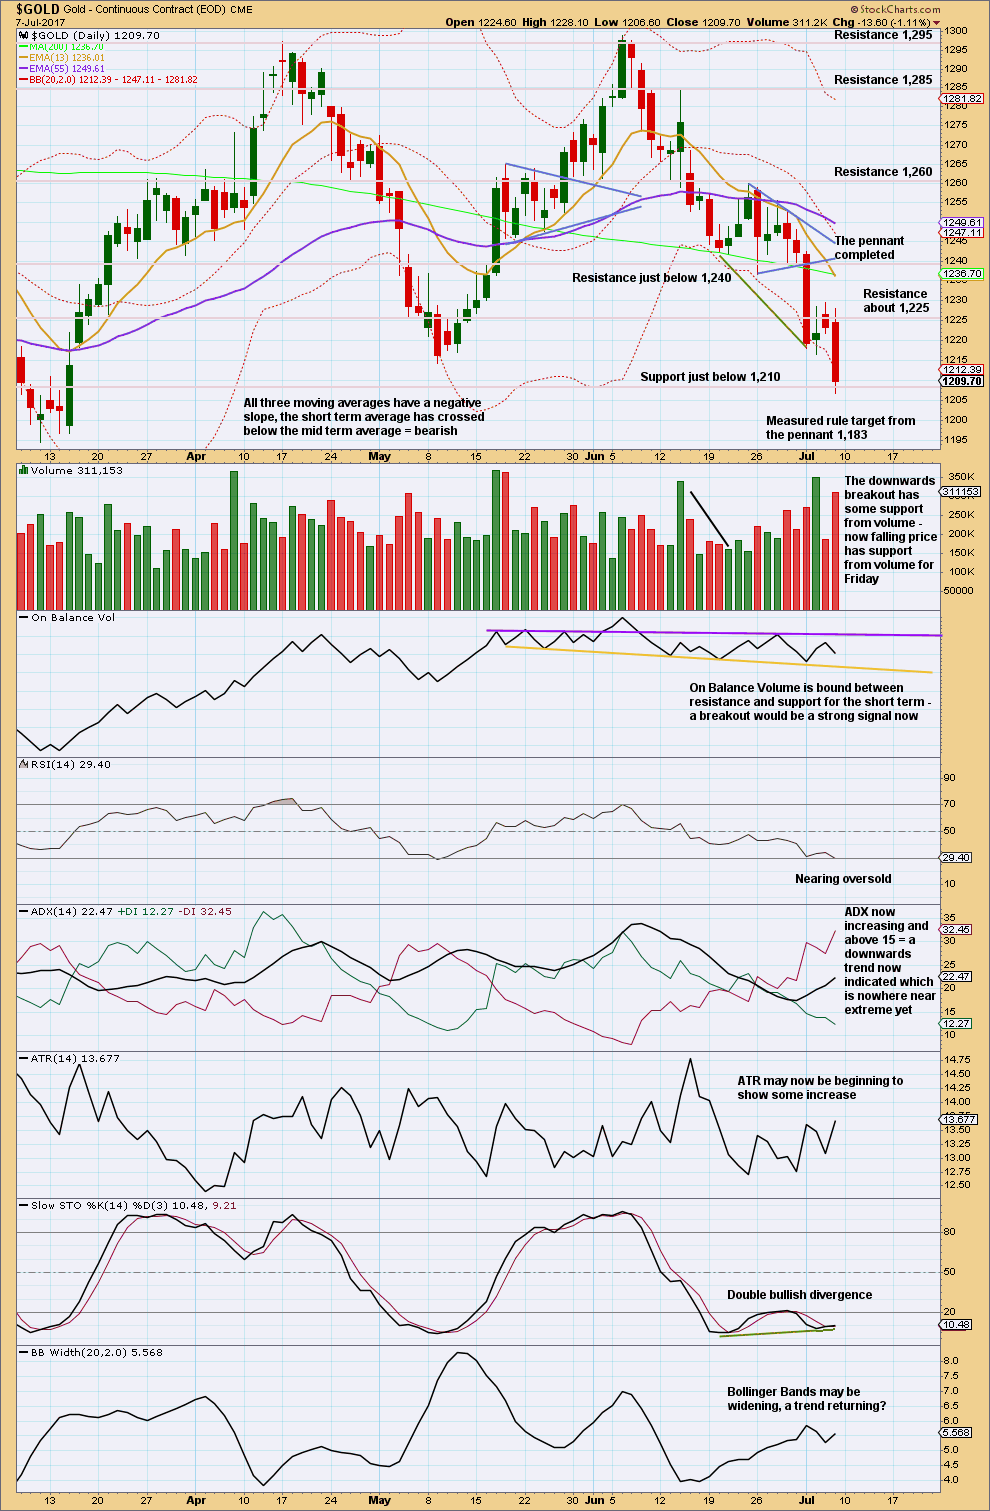
Price has bounced up from support, just below 1,210, on Friday. It looks reasonable to now expect the target given by the measured rule at 1,183 to be met, at least, and if not then the lower Elliott wave target at 1,160.
Volume is bearish. ADX is bearish.
On Balance Volume gives no signal for the short term; it is range bound.
Stochastics may remain extreme for long periods of time during a strong trend. Double divergence between price and Stochastics may signal a bounce here, or some weakness within the trend, but it should not be read as signalling an end to the trend here.
For the short term, this daily chart is less clearly bearish than the weekly chart, but it still indicates more downwards movement.
GDX
DAILY CHART
Click chart to enlarge. Chart courtesy of StockCharts.com.
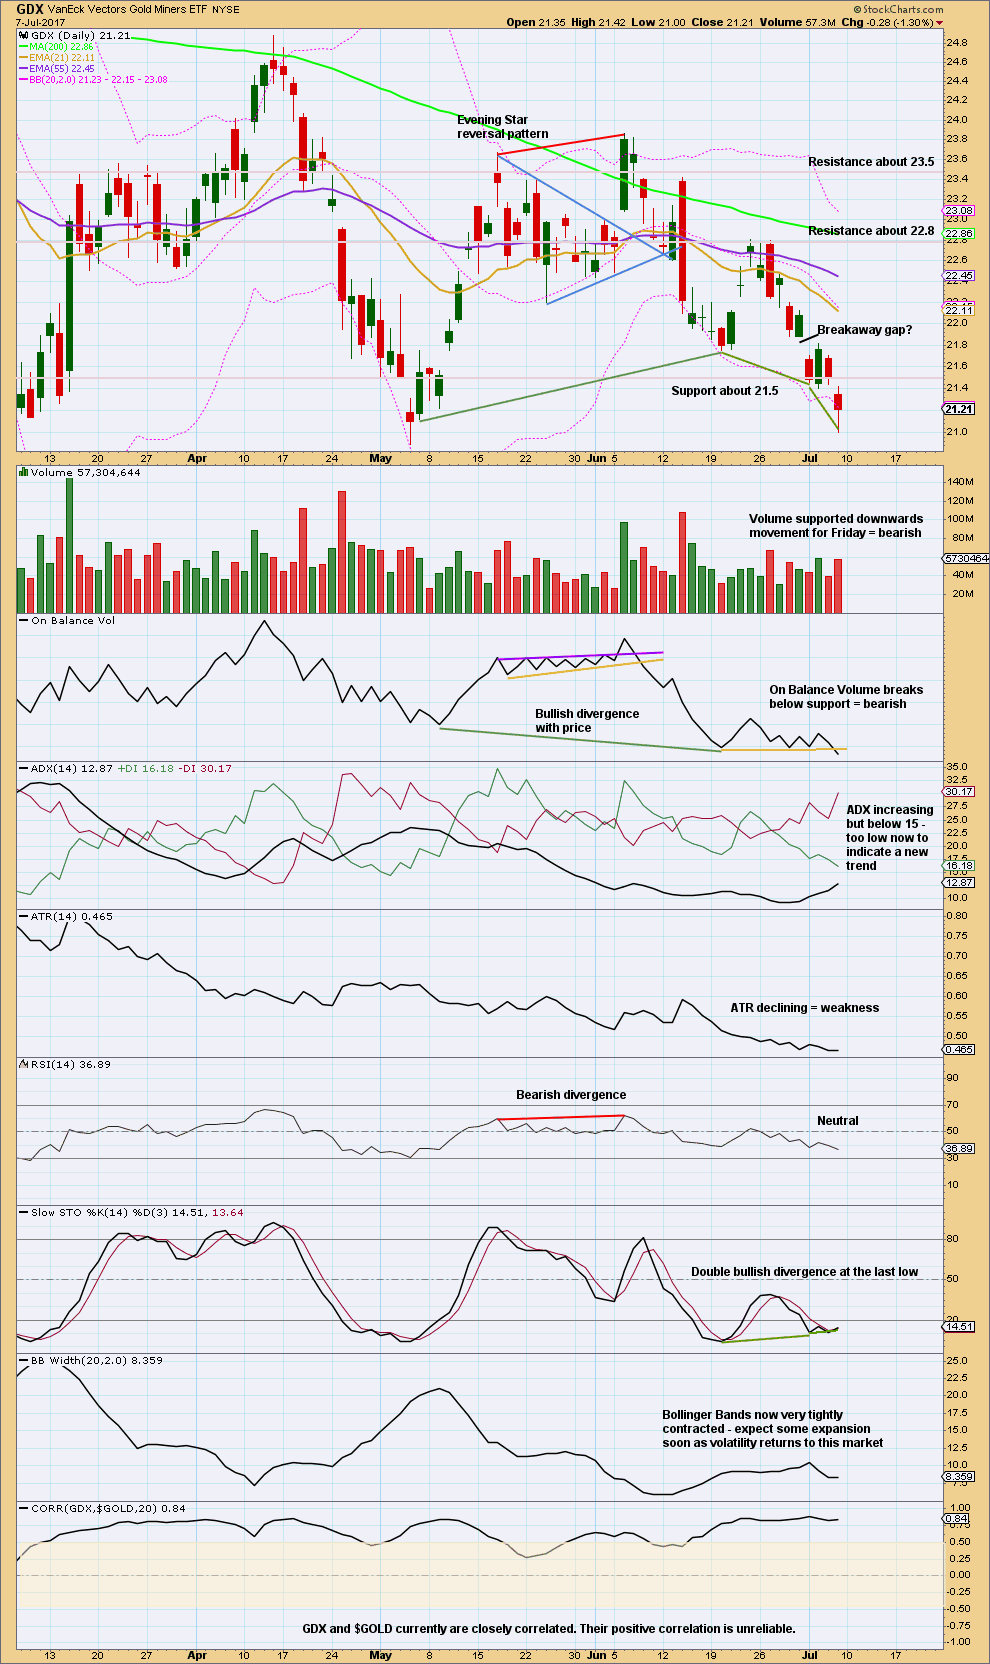
GDX looks a little more clearly bearish for the short term than Gold.
Give weight to the bearish signal from On Balance Volume here. But give little weight to bullish divergence between price and Stochastics, because it can persist and develop further before a trend change.
The long lower wick on Friday’s candlestick is bullish.
This analysis is published @ 02:32 a.m. EST on 9th July, 2017.
Apologies everybody for my tardiness today in not uploading a chart. Nothing much has changed really. Analysis will be done and published shortly.
Just got this notice from my US Broker. Good news coming for those without margin accounts. Faster settlements.
GDX hourly update
https://www.tradingview.com/x/yUwb1tMR/
Interesting theory?
Top Wall Street strategist sees bitcoin ‘cannibalizing’ gold, worth as much as $55,000
http://www.cnbc.com/2017/07/07/strategist-tom-lee-weighs-sees-bitcoin-going-as-high-as-55000.html
If TPTB ever percieve BC a threat, they will crush BC like a bug against a car windshield.
US Oil Weekly Ichimoku Analysis
Data as at market close of July 7
===========================
The crude oil markets continued the rally from the week before, reaching a high of 47.32 on Wednesday. It then turned back to reach a low of 43.78 on Friday. Oil had fallen below the long-term brown uptrend support line about three months ago. The market looks very likely to continue rolling over, as the oil markets are far oversupplied. Moreover, the Russians are not in favour of production cuts; the US producers similarly have no inclination to do so. Given enough time, the market should then break down below the 40 level, followed by the 35.24 lowest point on the brown uptrend line. Once that happens the crude oil market would collapse. The last support will be the 2016 February 11 low of 26.05. I believe that the oil market, like silver, continues to be a “seller rallies” type of situation, unless some really massive geopolitical tensions can arise, such as an all-out war with North Korea.
A relief rally occurred after oil prices touched the 43.78 low on Friday. This could continue until early next week. First resistance will be the tenkan-sen at 47.03 followed by the weekly cloud top boundary at 47.22. If all goes well, and prices do break the 47.32 last high, then it would encounter the kijun-sen resistance at 48.54. I doubt if the price rise can reach as high as the brown uptrend line, now turned strong resistance. The most it could do is to reach the purple downtrend line, and get rejected by it. Once a high is reached, I’m sure investors will be heading for the exits, shorting the market in all earnestness. And, of course, yours truly will be among them.
Alan, I see the tenkan sen is about to cross above the kijun sen on the daily. This should be indicative of a forthcoming bounce in oil, correct?
Vince, that is correct. A brief relief rally before the inevitable decline takes place. I’m waiting for this to end before shorting.
Thank you Alan. I will be attentively watching the lines on the daily chart.
Interestingly I noticed stockcharts still has the tenkan and kijun sen numbers from Friday. Whereas my think or swim chart already has the numbers updated today for oil futures.
I assume you go by the current trading day tenkan and kijun numbers? Not the previous the day, correct?
StockCharts only updates on a daily basis, and that after the market closes.
SILVER Weekly Ichimoku Analysis
Data as at market close of July 7
============================
Mirroring gold, the silver market initially plunged on Monday, but it was not until Friday that prices sliced easily through the brown uptrend support line. Silver’s price drop is all the more spectacular as all the action this week took place below the kumo.
Starting this coming week, the weekly cloud turns red, indicating that more price drops could be lined up. Having dropped to the low of 14.54 on Friday, past the 14.61 low of the brown uptrend support line, the next significant support is at the long-term 13.62 low reached in mid-December 2015. Although Lara’s Silver post on July 5 points to a rosy picture following this Intermediate B low, I don’t see any incentive for investors to buy silver at this point. The bounce from here would be telling. On fundamentals, the market looks very ominous, and seems more likely to suffer unless some type of massive surprise in the form of geopolitical concerns surface. I feel that it is quite a challenge to trade the market right now. If the price of silver fails to rise conclusively soon, I’m afraid it might be best to continue to short this market, especially in selling rallies.
Thank you Alan, for these updates.
End of Week Analysis
Data as at the market close of July 7
==============================
Gold markets began the week on a sour note, plunging from a high of 1242.62 to a low of 1219.05, slicing easily through the 1230 brown uptrend line support. Although the market pulled back towards a high of 1228.96 on Thursday, it was only to give a “final kiss” to the brown uptrend line. The bulls could not muster enough strength to push further, and the market fell flat on Friday to a lower low of 1207.73, slightly below the weekly kumo bottom cloud boundary. This is an extremely negative sign, and the market should then drop towards the psychological 1200 round number this coming week. If we break down from there, gold should continue on to the support given by the pink uptrend line. This line is drawn from the two past major lows and should have some relevance. The brown uptrend line, which had been strong support for the past six months, now becomes strong resistance. The purple downtrend line had proved to be staunch resistance, capping any rise during the drop from 1298.80.
The market is undergoing a relief rally after the hard fall towards 1207.73. At the end of this rally, prices should continue their downward journey. I would expect the pink support line to contain the drop. If not, the gold market will completely collapse. Looking at the geometry, it does seem that the drop would not continue beyond the end of the first week of August, where the pink and purple trendlines meet. The timing looks correct because August is traditionally a good month for gold to rise in price. Gold may then rebound in Primary E towards the brown resistance trendline. Rejection would then see gold plummeting in a free fall in Cycle C.
On a fundamental level, gold prices drop because of the increasing probability of the Fed continuing to raise interest rates. As a result, I am very bearish about the gold market right now. It appears that gold will continue to suffer unless geopolitical tensions emerge. I believe the flashpoint will be North Korea. This is because of the long-range missile being fired this week. Although it has a lot of concern from world leaders, the markets seemed to have shrugged it off. Hence, if the markets were to suddenly worry about North Korea, the consequences would be brutal and vicious; markets could spike straight through the roof as investors retreat to safe havens such as gold. Ultimately, I believe that the gold markets will continue to be under serious pressure as investors are more concerned about the interest rate situation than anything else. So, if geopolitical issues are not forthcoming, the gold market does not have much to support it.