
After the strong downwards session of the 5th of July, there was an update to technical analysis posted in comments of the last published post for US Oil which expected the bounce was most likely over. Price has moved down from there as expected so far.
Summary: Strong volume for recent downwards days does not look like a typical B wave; B waves normally exhibit weakness. It does look like the bounce is over and the next wave down may have begun. Stops may be set either just above the last swing high of the 4th of July, or for more patient members just above the upper edge of the base channel about 49.95.
Always use a stop. Invest only 1-5% of equity on any one trade.
New updates to this analysis are in bold.
MONTHLY ELLIOTT WAVE COUNT
Click chart to enlarge.
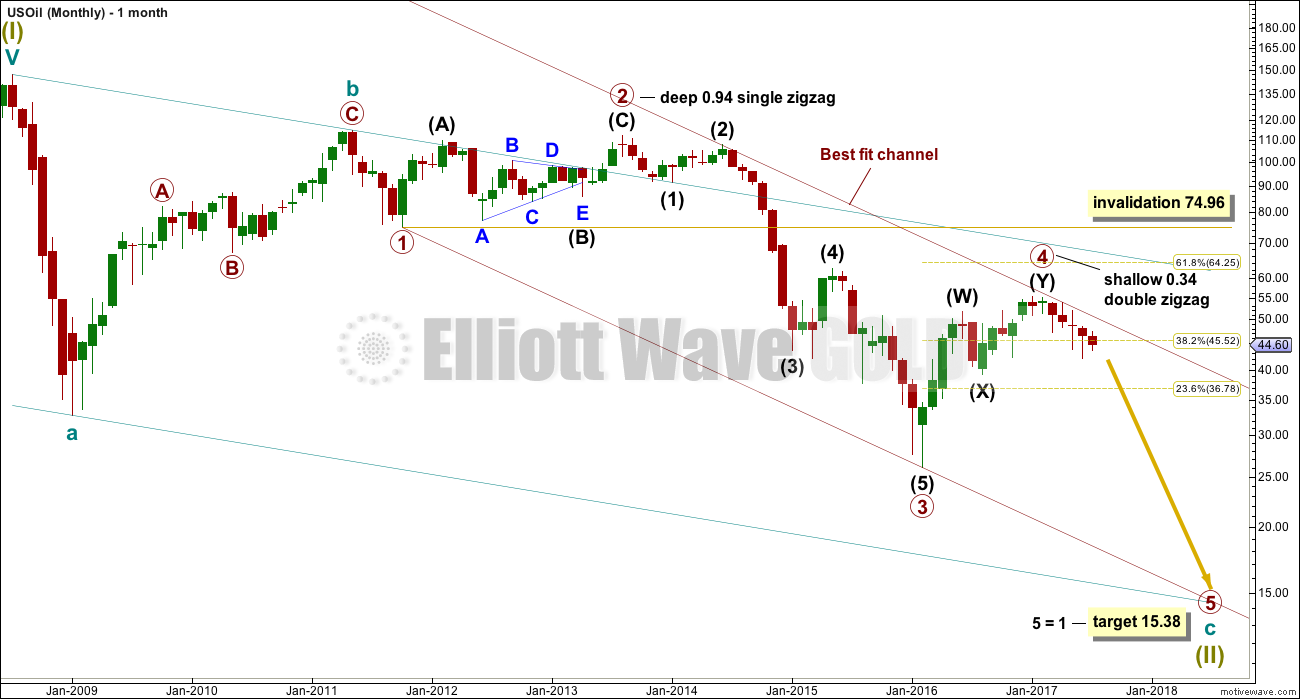
Within the bear market, cycle wave b is seen as ending in May 2011. Thereafter, a five wave structure downwards for cycle wave c begins.
Primary wave 1 is a short impulse lasting five months. Primary wave 2 is a very deep 0.94 zigzag lasting 22 months. Primary wave 3 is a complete impulse with no Fibonacci ratio to primary wave 1. It lasted 30 months.
There is alternation in depth with primary wave 2 very deep and primary wave 4 shallow. There is inadequate alternation in structure, both are of the zigzag family, but there is some alternation within structure. Primary wave 2 is a single zigzag and the triangle for intermediate wave (B) gives it a sideways look. Primary wave 4 is a sharper and quicker double zigzag.
If it continues as per the alternate, then primary wave 4 may not move into primary wave 1 price territory above 74.96.
WEEKLY ELLIOTT WAVE COUNT
Click chart to enlarge.
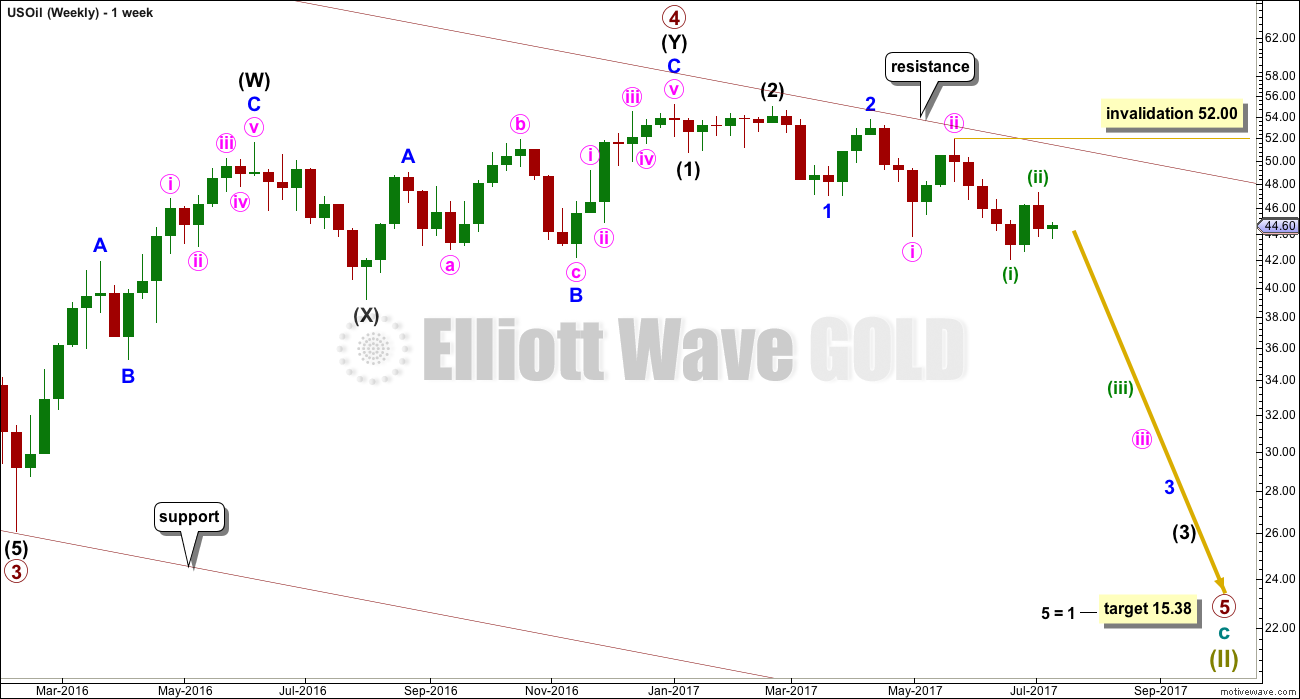
Primary wave 5 looks like it may beginning very typically with a series of overlapping first and second waves. The third wave within it looks to be extending. It should be expected that within one or more of these third waves that their fifth waves may be very strong and sharp, ending with selling climaxes typical of commodities.
Minuette wave (ii) may not move beyond the start of minuette wave (i) above 52.00.
DAILY ELLIOTT WAVE COUNT
Click chart to enlarge.
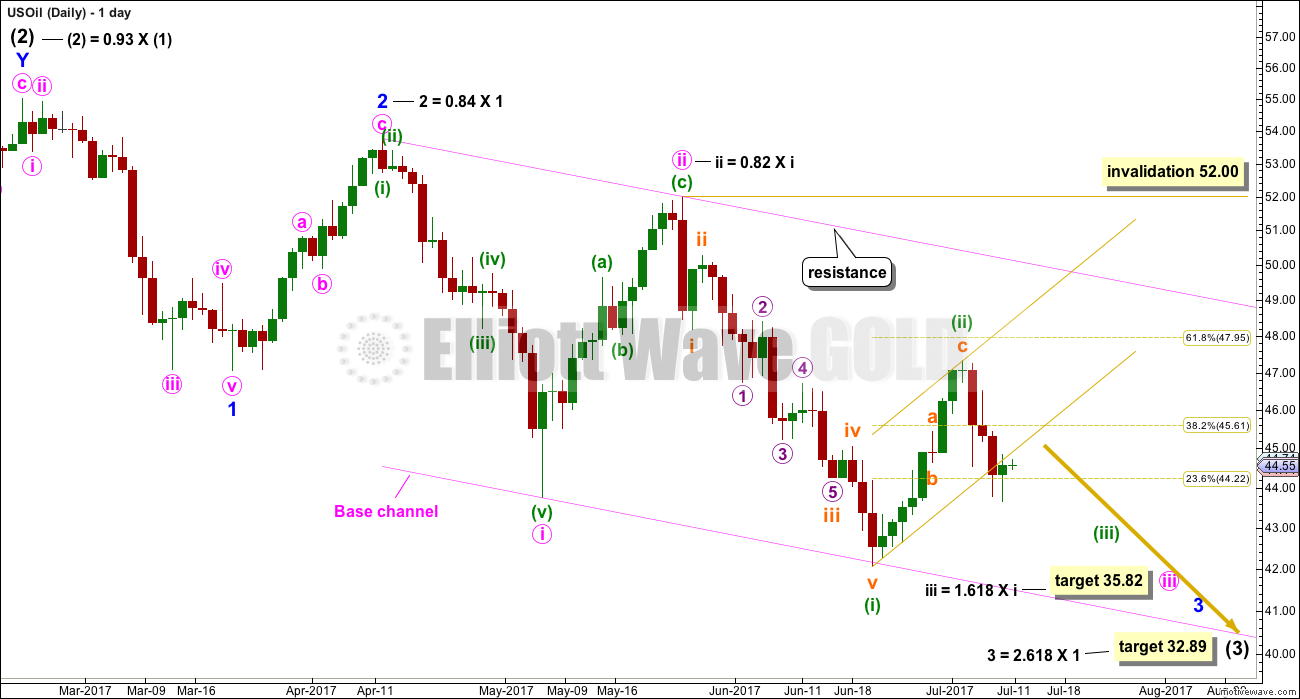
Primary wave 5 must subdivide as a five wave motive structure, either an impulse or an ending diagonal. With the overlapping of first and second waves so far, it looks very much like the more common impulse may be unfolding.
At this stage, volume analysis strongly suggests that minuette wave (ii) may be over. The yellow channel is a conservative best fit, and this is now breached by downwards movement. If minuette wave (ii) continues higher, then it should find very strong resistance at the upper edge of the pink base channel.
ALTERNATE WEEKLY ELLIOTT WAVE COUNT
Click chart to enlarge.
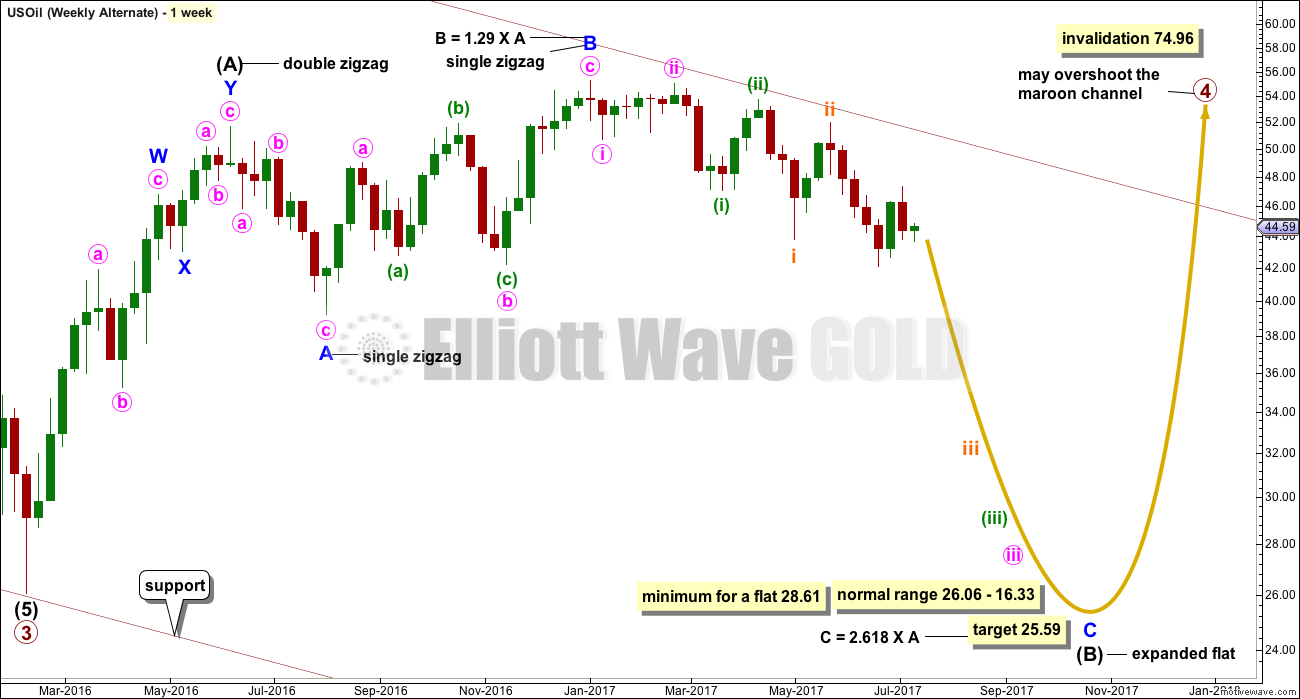
It will remain possible but less likely that primary wave 4 could continue and substantially breach the upper edge of the maroon channel at its end.
The whole structure of primary wave 4 is seen here in more detail.
The first wave labelled intermediate wave (A) is seen as a double zigzag, which is classified as a three.
Intermediate wave (B) is also a three. This means primary wave 4 is most likely unfolding as a flat correction if my analysis of intermediate wave (A) is correct. Flats are very common structures.
Intermediate wave (B) began with a zigzag downwards. This indicates it too is unfolding most likely as a flat correction.
Within intermediate wave (B), the zigzag upwards for minor wave B is a 1.29 correction of minor wave A. This indicates intermediate wave (B) may be unfolding as an expanded flat, the most common type.
The normal range for intermediate wave (B) within a flat correction for primary wave 4 is from 1 to 1.38 the length of intermediate wave (A) giving a range from 26.06 to 16.33.
Primary wave 4 may not move into primary wave 1 price territory above 74.96.
Within the larger expanded flat correction of primary wave 4, intermediate wave (B) must retrace a minimum 0.9 length of intermediate wave (A) at 28.61 or below.
Because there is no divergence in expected direction nor structure for several weeks between this alternate wave count and the main wave count, only one daily chart will be published for the main wave count.
TECHNICAL ANALYSIS
DAILY CHART
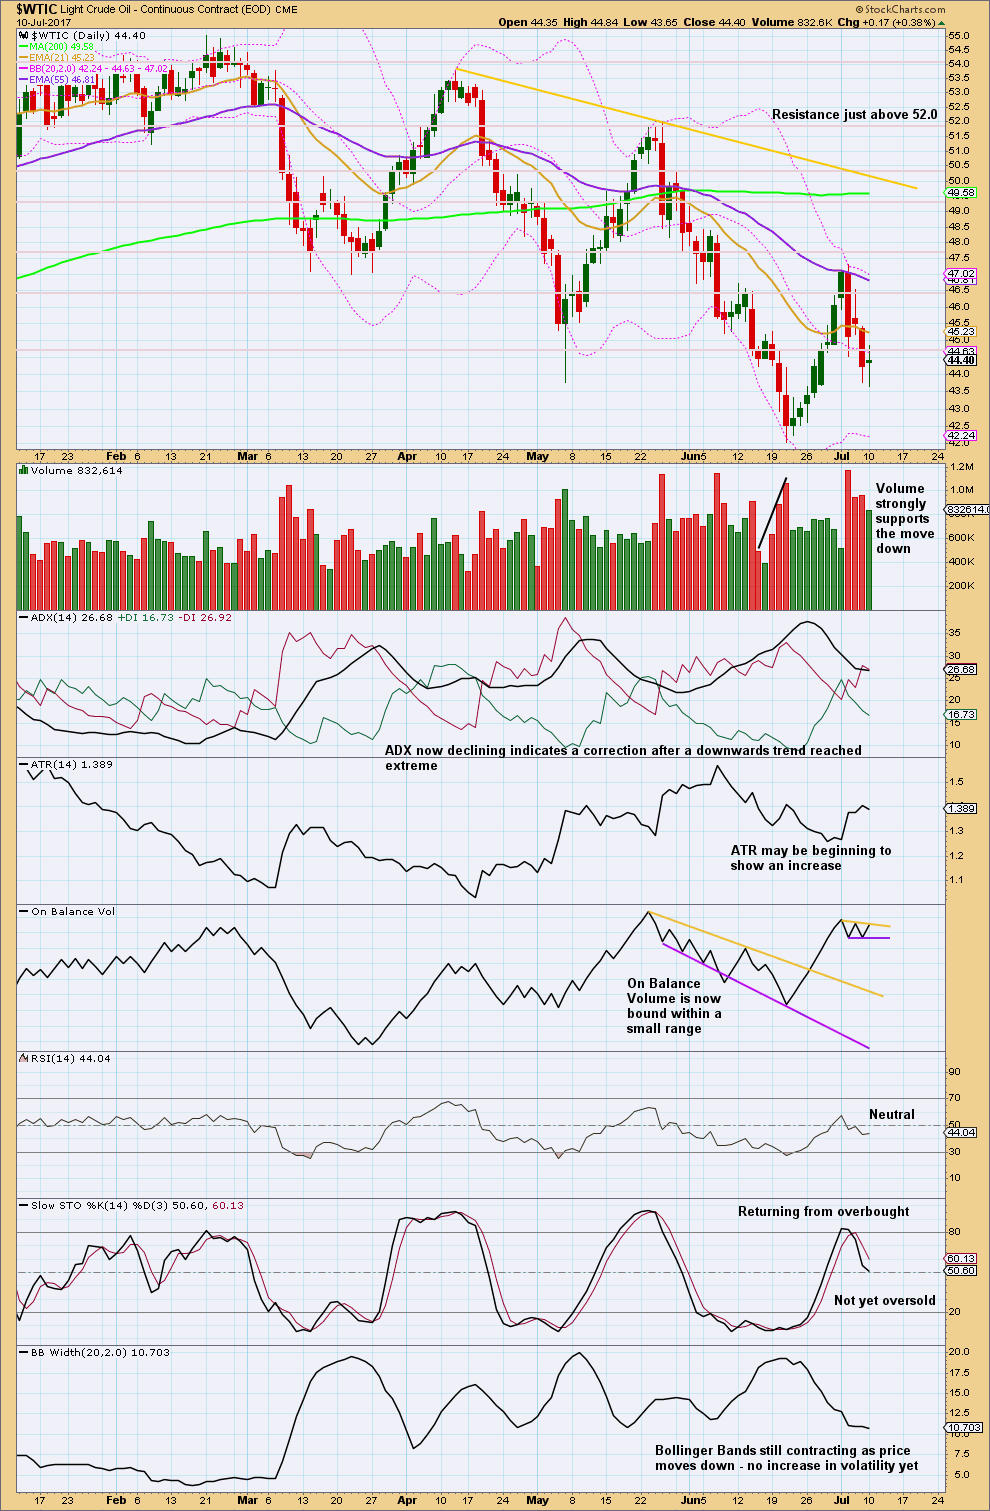
Click chart to enlarge. Chart courtesy of StockCharts.com.
The last three red daily candlesticks came with much stronger volume than recent green daily candlesticks. Downwards movement has support from volume.
This downwards movement does not exhibit any weakness, so the idea that it may be a B wave should only be considered as a less likely scenario because B waves should exhibit weakness.
If ADX turns up from here, then it may quickly again be above both directional lines, again indicating an extreme trend. But when Oil trends strongly, ADX can remain extreme for the majority of the trend, as it did from June 2014 to January 2015.
Watch On Balance Volume closely over the next few days. A breakout here would offer a weak signal, either bullish or bearish.
It looks like the bounce may have found resistance at the mid term Fibonacci 55 day moving average.
VOLATILITY INDEX
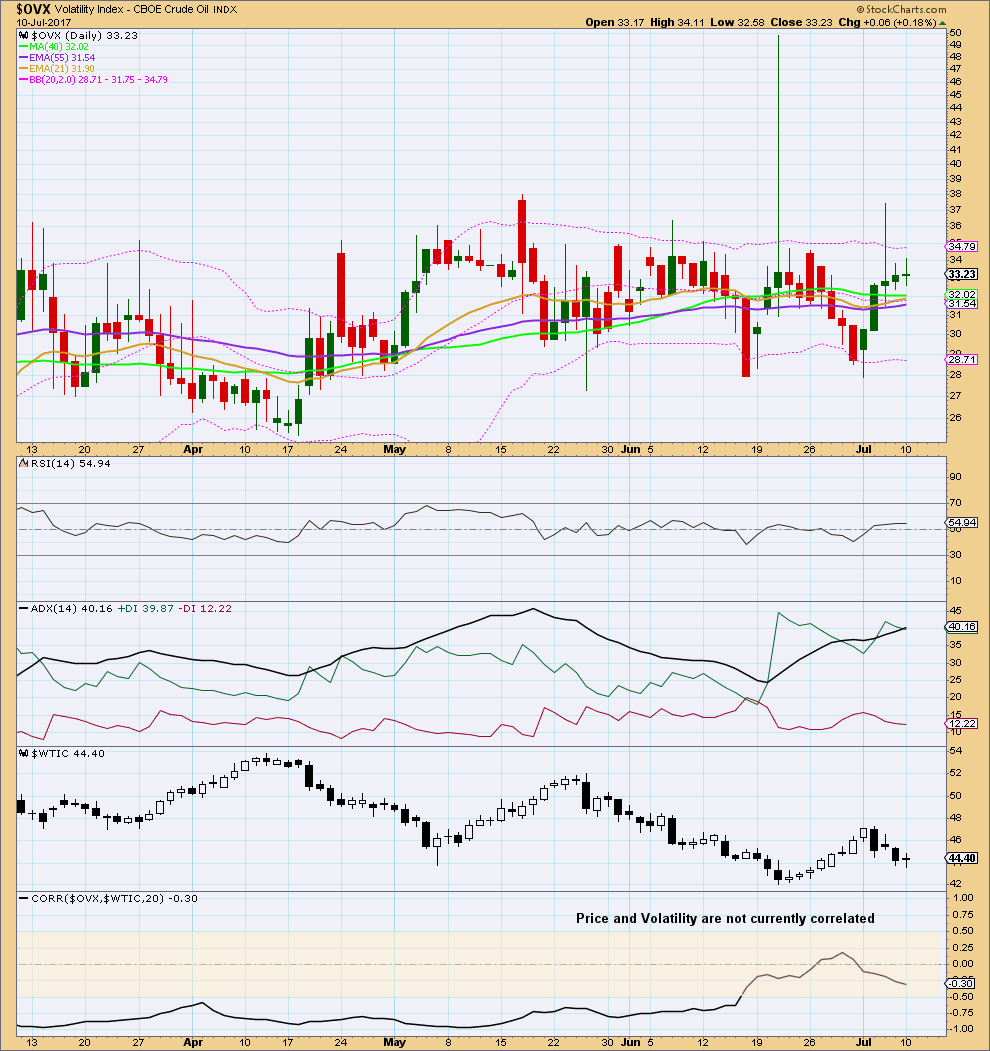
Click chart to enlarge. Chart courtesy of StockCharts.com.
Normally, volatility should decline as price rises and volatility should increase as price falls. Divergence from this normal can provide a bullish or bearish signal for Oil. However, it is noted that this signal occurs both in minor and major lows and it cannot be used to distinguish between them.
At this time, volatility and price do not have a negative correlation. Volatility cannot be used at this time to signal if a low is in place or not.
This analysis is published @ 12:12 a.m. EST.
Today’s close for /CL looks very close to a sushi roll. Any thoughts?
To me oil looks very bullish, wouldn’t surprise me if this gets up to $49+, to build that upward momentum for the eventual drop down to Lara’s target.
It could do. That would see it end pretty much on that pink resistance line I have on the daily EW chart
Could we be looking at this? subminuette c yet to complete?
Wow, I just realized Lara indicated this labeling below. Sorry. I must have gotten distracted bouncing between gold and other sites and missed that update.
Yes that’s exactly what Lara’s update shows.
Looking at up coming news, I wouldn’t be surprised we go higher until the OPEC meeting on Monday July 24th before the next wave down… expectation of a big news and production cuts… buy the rumor sell the news.
And that’s what happened going into the last meeting.
what made you think wave C (ii) was completed earlier Sandy?
Certainly was a scary fall right after you called it Sandy
Smaller waves did look to have completed, but after a sharp drop to 45.80 (CLQ) (was an excellent short trade for me) It came right back for a retest and slightly higher.
Oil is wild, best is to be swift and nimble in both directions.
Lara,
Perhaps Wace c of (ii) completed at 6:53 AM?
Oil doesn’t look right again. I don’t think it’s going rebound. Seems like too much resistance. Could be dropping from here.
Agree. It’s been all over the place. I am going to stand aside, after repeatedly getting the timing wrong…
USO up 1.3% today. Moving up just fine for now…
something doesn’t look right, minuette (ii) may not be over and that we was a B wave, now we could be looking at wave C of minuette (ii). Any thoughts?
I agree.
Despite strong volume for that downwards movement, it does now look like it was a B wave.
And so the 0.618 Fibonacci ratio OR the upper edge of the pink base channel should now be a target for this bounce to end.
We can now draw a channel about it with reasonable confidence, the channel does not have too strong a slope.
Yep. A sharp move up in futures supportive of a C wave to complete minuette two.
Hi Lara,
sorry I can not read the small numbers, how far up are we expecting this correction to go? This would also offer a new entry to go short.
Thanks
Ursula, the chart directly above
shows the 0.618 Fibonacci for C wave @ $47.95
I view it on my smart phone, where I can zoom into the picture.
Lora,
Could we suggest to revert a website change? Currently if we click a chart, it will try to fit the whole picture to the screen. However the screen on laptop is 16:9. So the zoomed tall picture is actually smaller than the original one. The previous way of zooming is better which will enlarge the picture even it is just partially fit the screen.
Thanks.
Attach picture to show.
You can still accomplish an enlargement by command + (that’s on a Mac, on Windows use the Windows key)
Cesar changed EWG to be the same as EWSM in terms of this functionality after requests from some members.