
After last published analysis for Oil, another update was posted in comments the following day that expected that the bounce was not over. Price has moved higher since then.
Summary: A new target for the bounce to end is at 47.96 to 48.91. If price comes up to touch the upper pink trend line on the daily Elliott wave chart, then enter short with stops just above the line.
Always use a stop. Invest only 1-5% of equity on any one trade.
New updates to this analysis are in bold.
MONTHLY ELLIOTT WAVE COUNT
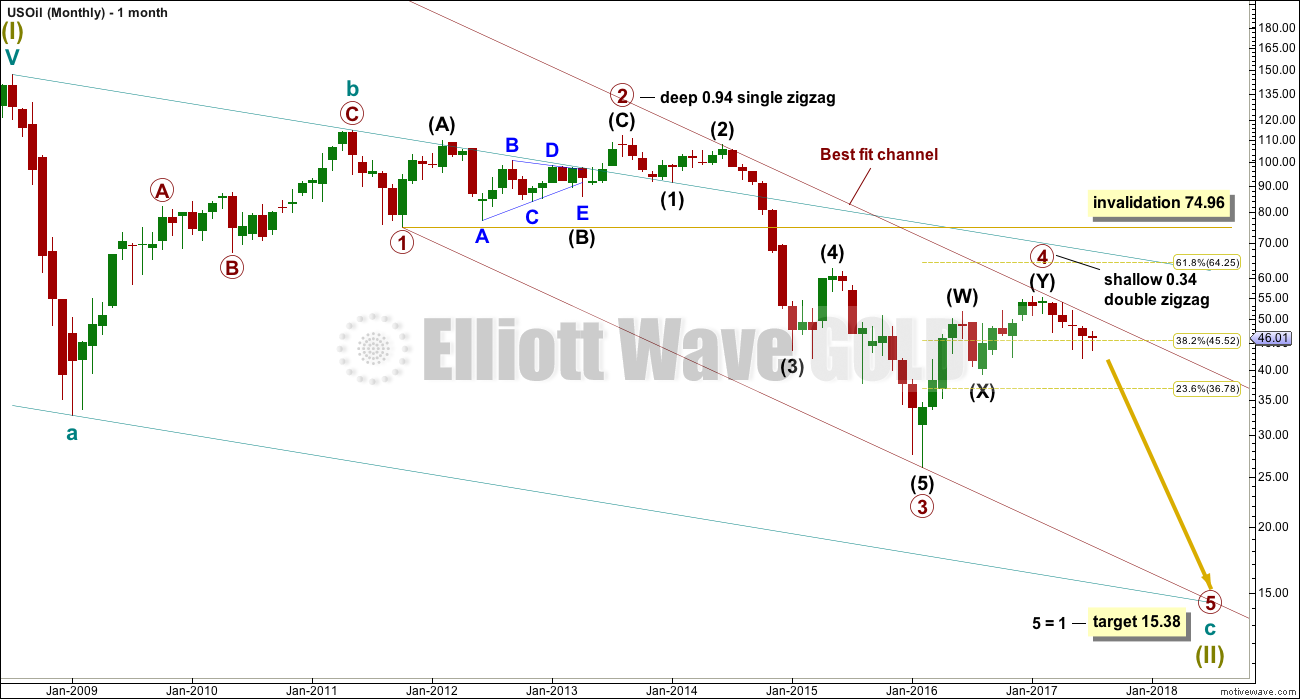
Click chart to enlarge.
Within the bear market, cycle wave b is seen as ending in May 2011. Thereafter, a five wave structure downwards for cycle wave c begins.
Primary wave 1 is a short impulse lasting five months. Primary wave 2 is a very deep 0.94 zigzag lasting 22 months. Primary wave 3 is a complete impulse with no Fibonacci ratio to primary wave 1. It lasted 30 months.
There is alternation in depth with primary wave 2 very deep and primary wave 4 shallow. There is inadequate alternation in structure, both are of the zigzag family, but there is some alternation within structure. Primary wave 2 is a single zigzag and the triangle for intermediate wave (B) gives it a sideways look. Primary wave 4 is a sharper and quicker double zigzag.
If it continues as per the alternate, then primary wave 4 may not move into primary wave 1 price territory above 74.96.
WEEKLY ELLIOTT WAVE COUNT
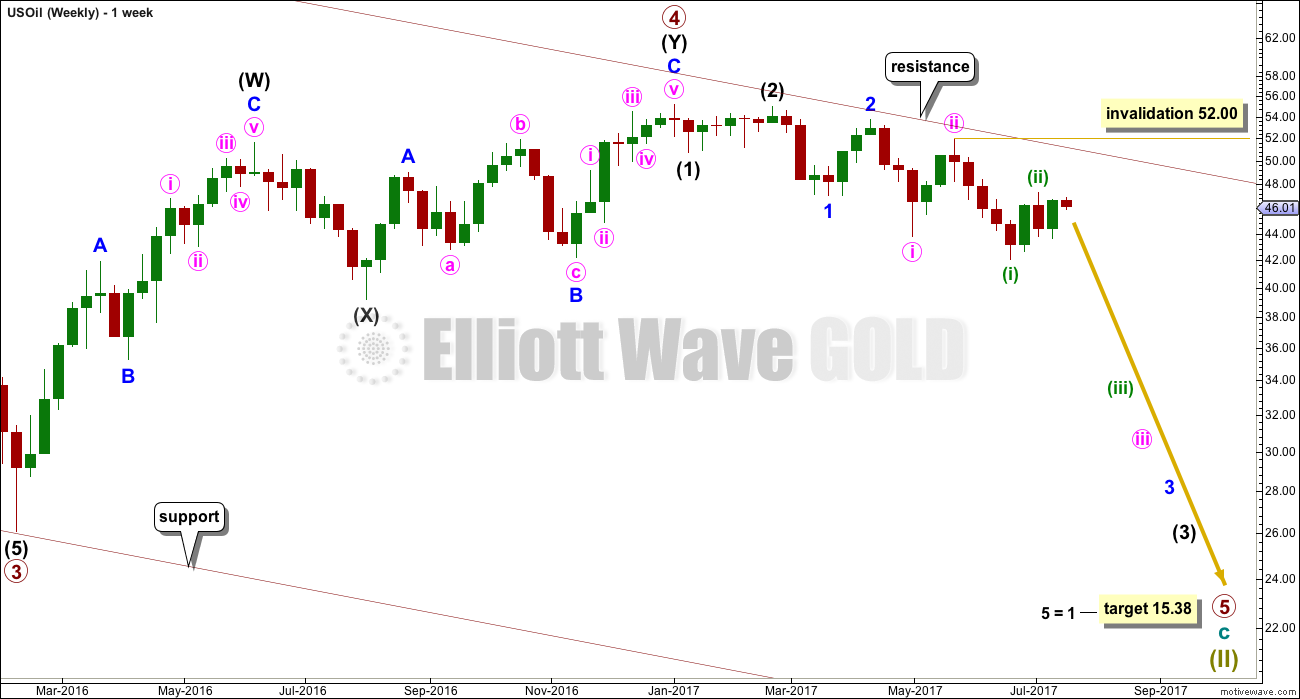
Click chart to enlarge.
Primary wave 5 looks like it may beginning very typically with a series of overlapping first and second waves. The third wave within it looks to be extending. It should be expected that within one or more of these third waves that their fifth waves may be very strong and sharp, ending with selling climaxes typical of commodities.
Minuette wave (ii) may not move beyond the start of minuette wave (i) above 52.00.
DAILY ELLIOTT WAVE COUNT
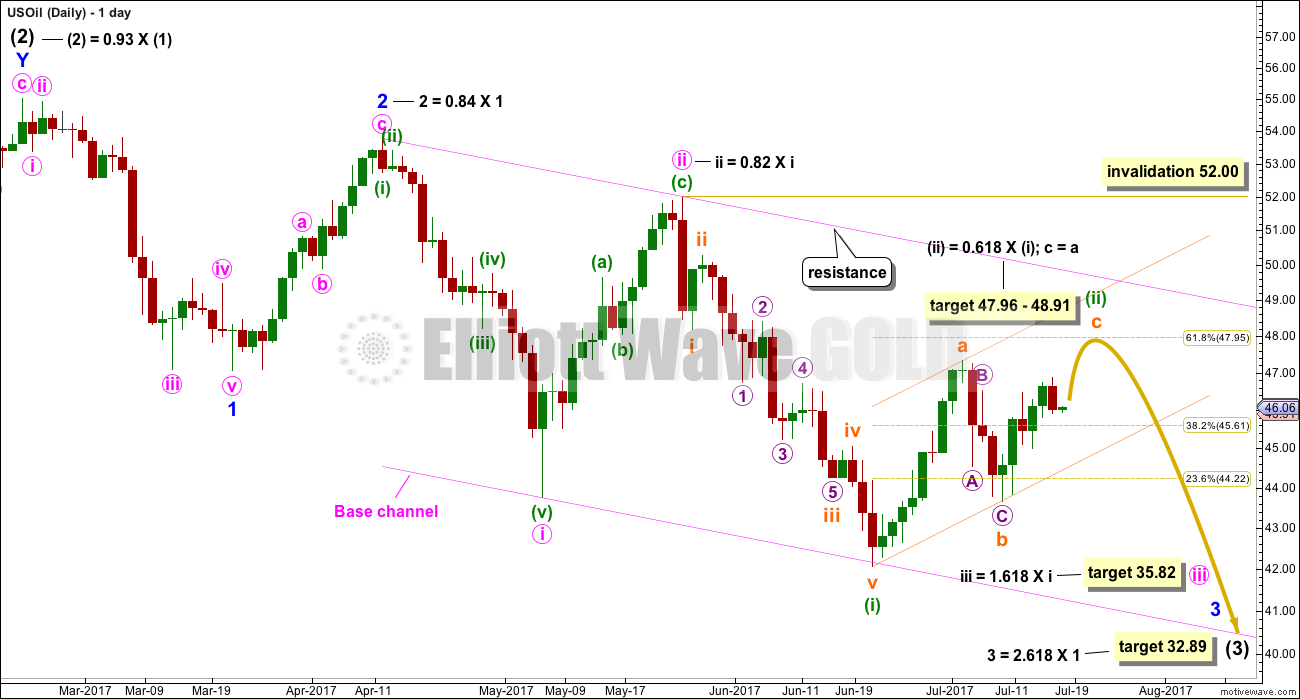
Click chart to enlarge.
Primary wave 5 must subdivide as a five wave motive structure, either an impulse or an ending diagonal. With the overlapping of first and second waves so far, it looks very much like the more common impulse may be unfolding.
Minuette wave (ii) may not move beyond the start of minuette wave (i) above 52.00.
Minuette wave (ii) should find very strong resistance at the upper edge of the pink base channel. Lower degree second waves should not breach base channels drawn about first and second waves one or more degrees higher.
The target is now widened to a small zone calculated at two degrees for minuette wave (ii) to end.
When price has broken below the orange channel containing minuette wave (ii), that may be taken as confirmation that the bounce is over and the next wave down has begun. But if price does come up to touch the upper edge of the pink channel, that should be used as an entry opportunity to join the downwards trend. Stops may be set a little above the pink trend line (allow for overshoots). But if that line is breached, then short positions should be exited.
ALTERNATE WEEKLY ELLIOTT WAVE COUNT
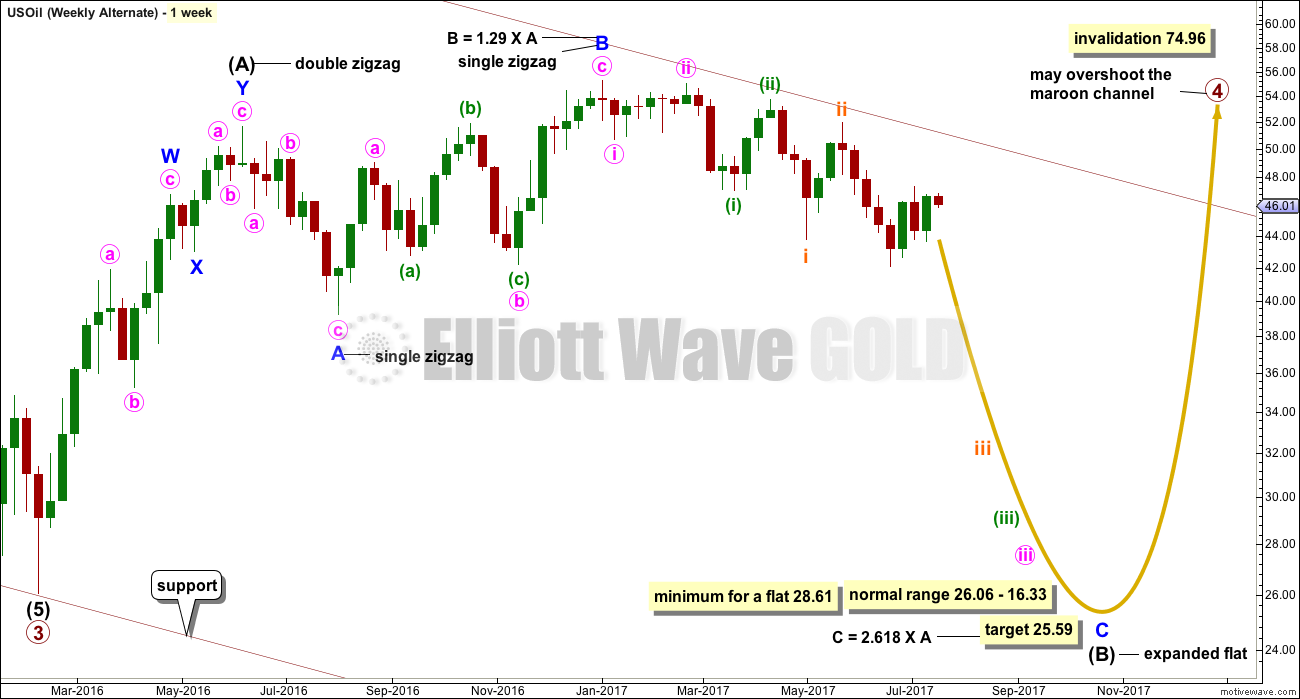
Click chart to enlarge.
It will remain possible but less likely that primary wave 4 could continue and substantially breach the upper edge of the maroon channel at its end.
The whole structure of primary wave 4 is seen here in more detail.
The first wave labelled intermediate wave (A) is seen as a double zigzag, which is classified as a three.
Intermediate wave (B) is also a three. This means primary wave 4 is most likely unfolding as a flat correction if my analysis of intermediate wave (A) is correct. Flats are very common structures.
Intermediate wave (B) began with a zigzag downwards. This indicates it too is unfolding most likely as a flat correction.
Within intermediate wave (B), the zigzag upwards for minor wave B is a 1.29 correction of minor wave A. This indicates intermediate wave (B) may be unfolding as an expanded flat, the most common type.
The normal range for intermediate wave (B) within a flat correction for primary wave 4 is from 1 to 1.38 the length of intermediate wave (A) giving a range from 26.06 to 16.33.
Primary wave 4 may not move into primary wave 1 price territory above 74.96.
Within the larger expanded flat correction of primary wave 4, intermediate wave (B) must retrace a minimum 0.9 length of intermediate wave (A) at 28.61 or below.
Because there is no divergence in expected direction nor structure for several weeks between this alternate wave count and the main wave count, only one daily chart will be published for the main wave count.
TECHNICAL ANALYSIS
DAILY CHART
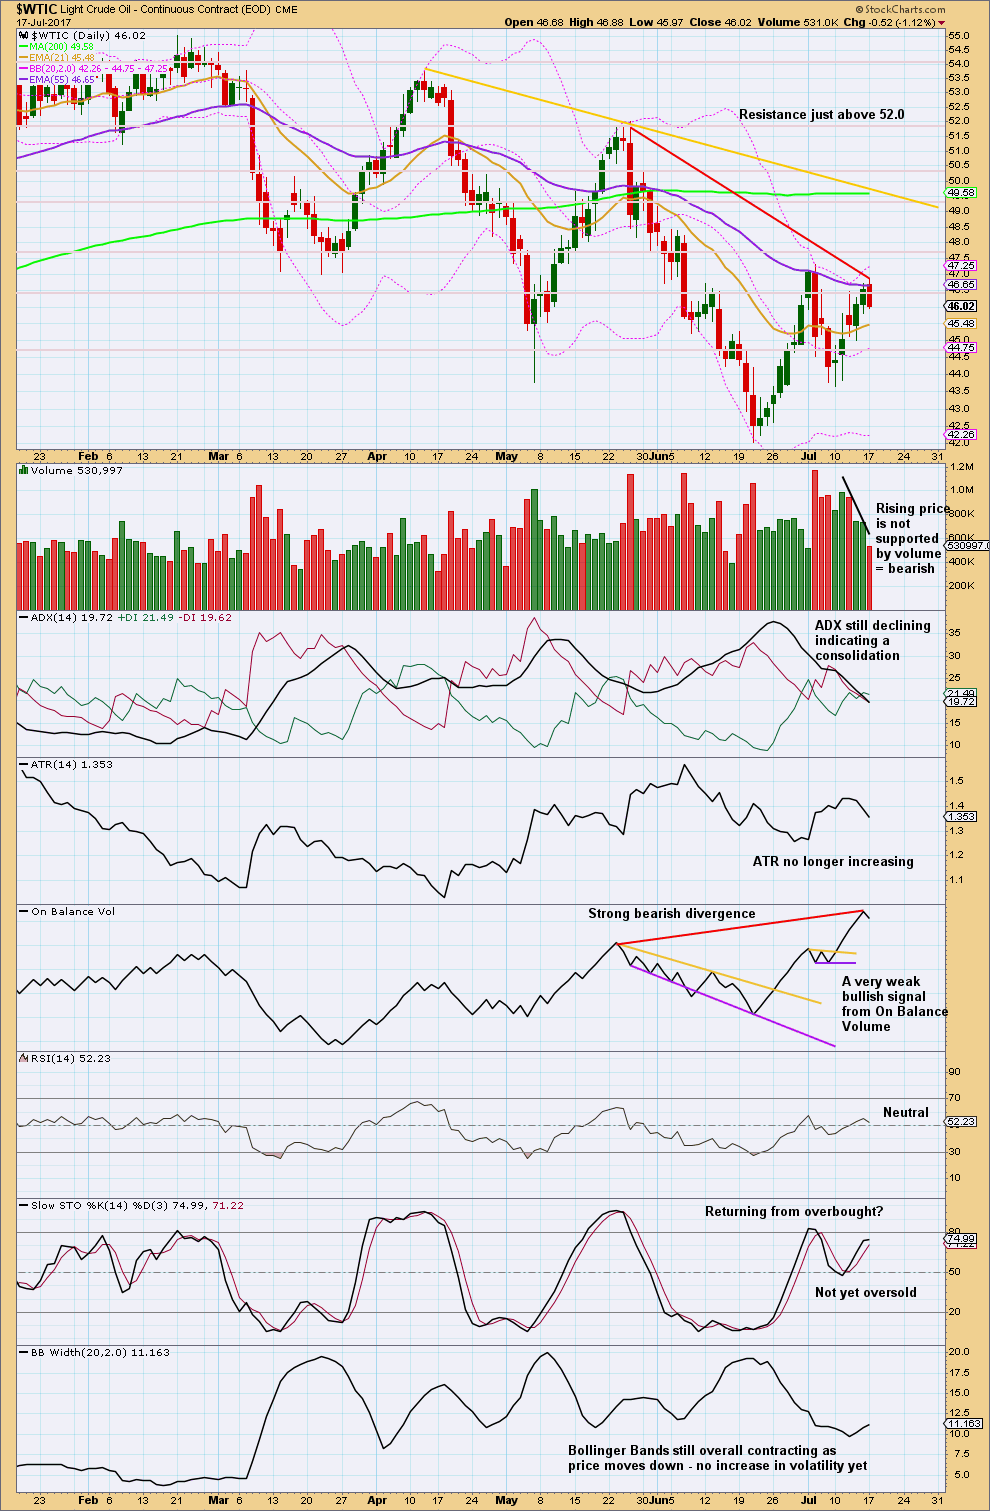
Click chart to enlarge. Chart courtesy of StockCharts.com.
Despite much stronger volume for the last three downwards days in a row, that was not the end of the bounce. Price looks likely now to move higher. Upwards movement is weak; the last five days of upwards movement is coming on consistently declining volume.
Volume, ADX, ATR and Bollinger Bands all agree that this upwards movement looks like a counter trend bounce.
This week On Balance Volume also suggests upwards movement is weak. Divergence there is hidden bearish divergence.
VOLATILITY INDEX
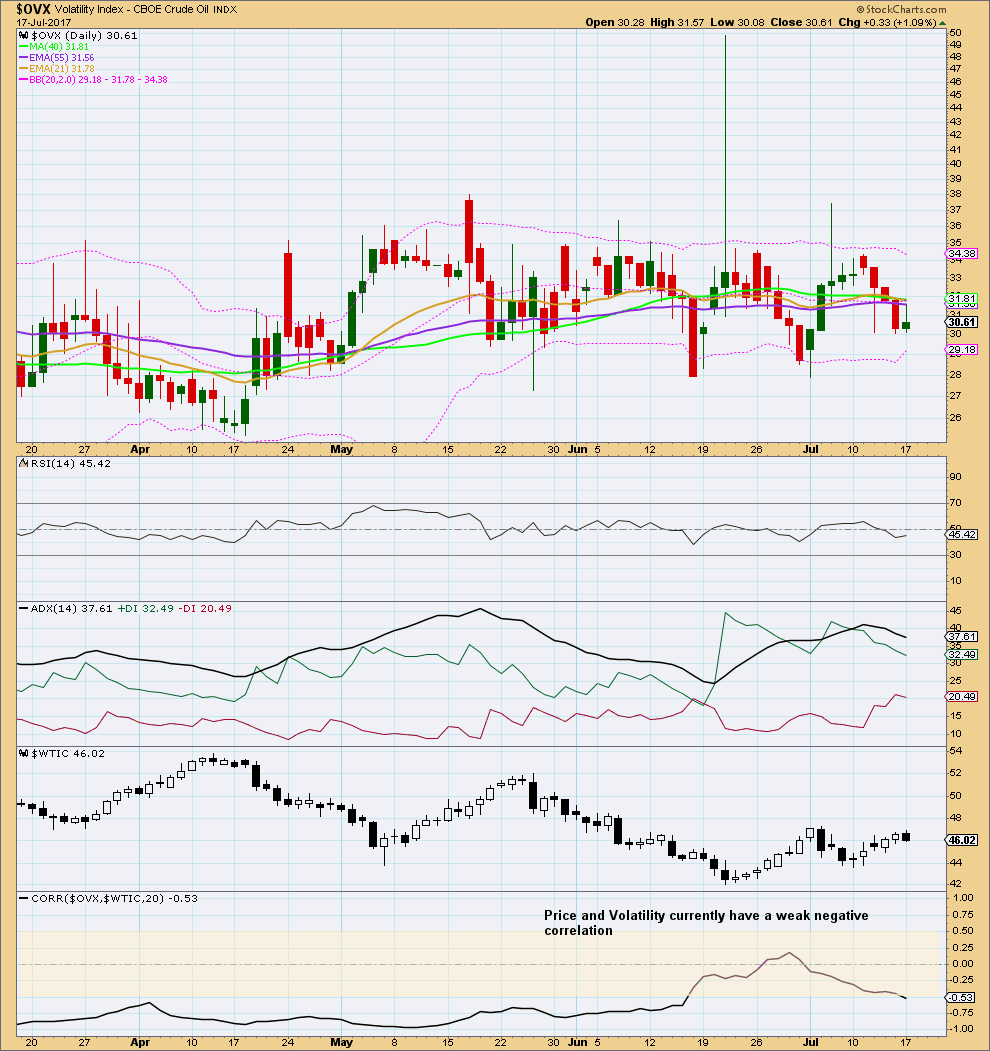
Click chart to enlarge. Chart courtesy of StockCharts.com.
Normally, volatility should decline as price rises and volatility should increase as price falls. Divergence from this normal can provide a bullish or bearish signal for Oil. However, it is noted that this signal occurs both in minor and major lows and it cannot be used to distinguish between them.
At this time, volatility and price have a weak negative correlation.
Price has today made a higher high, but volatility has not made a lower low. This single day divergence is bearish.
This analysis is published @ 08:42 p.m. EST.
I have oil in the third wave down, and expecting a bounce up for a 4th wave. I would like to add to my shorts then, just wondering if everyone is seeing the same as me? Thanks for any input.
Rin, I agree. The “OPEC-bounce” is an excellent opportunity to add to shorts.
It looks like Oil has turned, falling just short of the target zone.
Today’s strong downwards day doesn’t look like part of subminuette c of minuette (ii). It’s too big.
Members may like to take more risk and jump in short here. Positions should be profitable within 1-3 days if I’m right. Stops just above yesterday’s high, check that exact point with your broker data and add 3X normal spread. This ensures you’re not whipsawed out in times of volatility.
For a lower risk approach wait for the channel about minuette (ii) to be breached before going short. Stops in the same point, so reduce position size to risk only 1-5% of equity.
Risk management is the most boring aspect of trading, but the most necessary.
Any members trading without stops and letting losses run have in the past been removed from this membership. It sounds harsh, but that never ends well for you or me.
There’s no way I’m going to be always right. I’m wrong a reasonable amount of time.
If you manage risk then you don’t see your account wiped out when I’m wrong.
If you don’t manage risk… then your account will be wiped out at some stage. Of that I can be 100% certain.
We should get a sub minuette ii bounce?
While OIL has clearly broken out of its latest uptrending channel, I’m considering the possibility that minuette ii in Lara’s main count is not yet complete.
What if the downtrend after subminuette a was not all of subminuette b, but rather just micro a of a developing a-b-c flat at micro degree? I suggest this because the last uptrend has overlapping waves and so does not seem to have a simple 5-wave count. It seems to count as a WXY, consistent with a developing flat.
If this count is correct, then a short position would be good only in the short-term, as there would still be one more bounce up to complete subminuette c and minuette ii.
Comments are welcome.
I think that would see minuette (ii) far too time consuming.
Technically possible, but IMO it doesn’t have the right look.
Lara, Thanks for the Comment. I greatly appreciate your insights.
Is it another cup and handle or the end of minutte ii?
It has the look and feel that minuette ii ended at yesterday’s high. And it also looks like I missed this big drop so far. I hope we get subminuette ii bounce so I can load up on my shorts.
oil looks like it has broken channel and going down hard now
Oil was up earlier and then took a sharp turn down. I was expecting it to go higher until the OPEC meeting…
But we did go higher than 47.52 (high of wave a). Does anyone think today’s high was the end of subminuette ii???
I’m still long on oil Ari.
I’m watching out for any overthrow of the trend channel to catch early signs of a trend change. Will let you know if I notice anything peculiar Ari
Thanks rin.
If you are following Lara’s oil analysis, take a look at DRIP; I think it is ready for a move higher. I have been holding 15 strike calls for about a week and we have a bullish engulfing candle today. We should get a strong three days or more of upside momentum. Conversely GUSH is printing a bearish engulfing candle and will probably see at the very least a 10% downside move. Cheers!
Thanks for the updated Oil charts Lara
You continue to be spot on !